View Alert Triage Metrics
View statistics and get an overview of your alerts and team's activity.
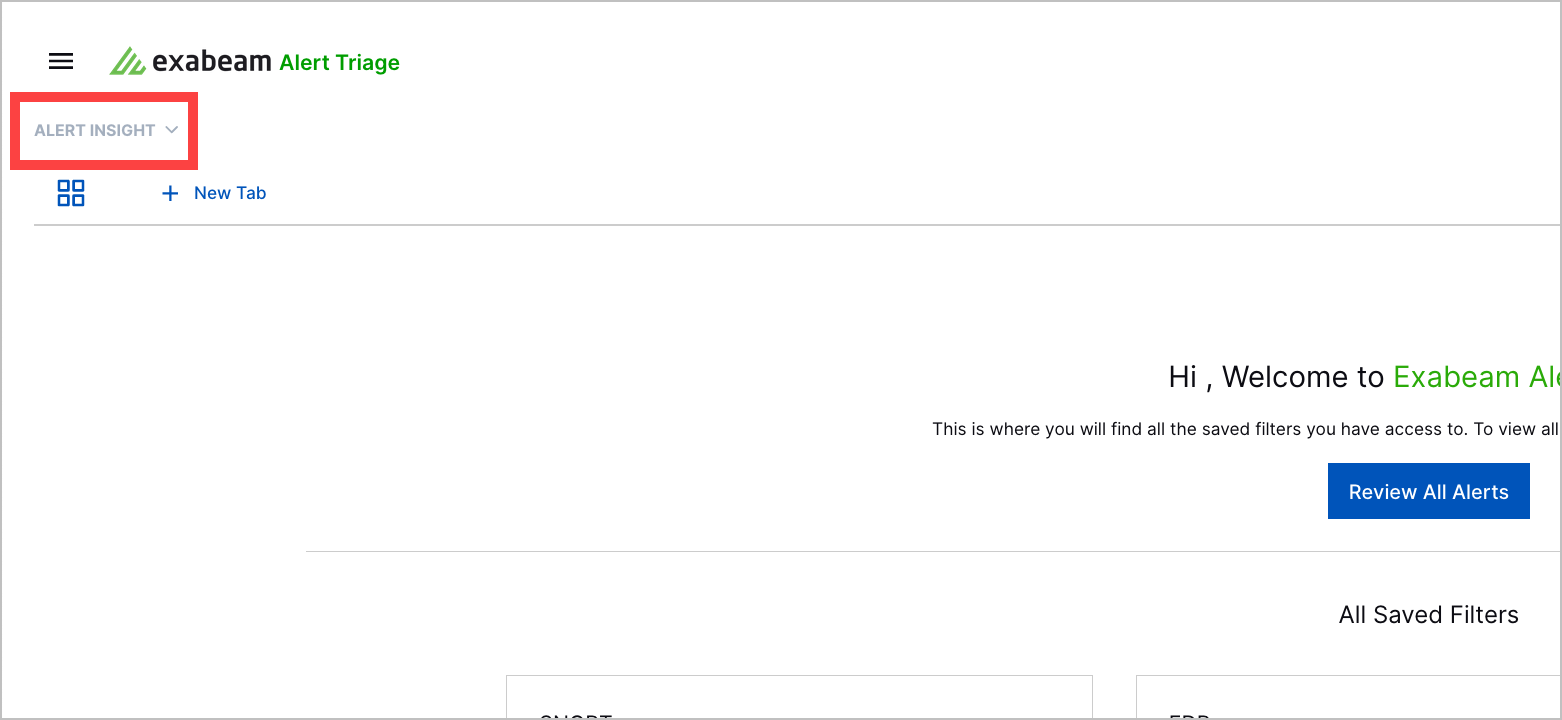
Click Alert Insight.

To view metrics from a certain period, select a time: last 24 hours, last three days, last seven days, or last 30 days.

The time you select determines how frequently the metrics update:
If you select Last 24 hrs, the metrics update every five minutes.
If you select Last 3 days, the metrics update every ten minutes.
If you select Last 7 days, the metrics update every ten minutes.
If you select Last 30 days, the metrics update every 30 minutes.
View metrics of your alerts and your progress triaging them, including:
The total number of alerts you received in the time you selected.
How many alerts are high priority, in number and as a percentage of total alerts.
How many alerts are low priority, in number and as a percentage of total alerts.
How many alerts are observational and how much time you saved ignoring these alerts. Time saved is calculated by multiplying the average time an analyst spends triaging an alert, approximately five minutes, and the number of alerts considered observational.
How many alerts have In Progress, Escalated, Resolved, or Dismissed statuses.
