- What is Exabeam?
- Welcome to the Advanced Analytics Homepage
- Get to Know a User Profile
- 1 General Information
- 2 Data Insights
- 3 Active Incident(s)
- 4 User Risk Trend
- 5 Risk Reasons
- Get to Know the User Timeline Page
- Examine Events by Category with the User Session Summary
- About the User Session Timeline
- Filter User Timelines
- View Activity Summary on a Specific Day
- Get to Know the Daily Timeline
- View and Understand an Account Lockout Sequence
- Get to Know the Account Lockout Sequence Timeline
- Accepting a Session or Sequence
- Entity Analytics
- Get Started with the Asset Page
- Get Started With the Threat Hunter Page
- Search Histograms Using the Data Insights Page
- Monitor Exabeam Processes Using the System Health Page
- Contact Technical Support
Get Started with the Asset Page
Learn about Exabeam analytics and the interactions available during an Asset investigation.
In Advanced Analytics, assets are as crucial to investigations as users. They represent any device on the network with an IP address. Throughout an attack campaign, one or several assets may become compromised; a compromise trail can start at the infection point with a workstation and extend to any server accessed by the attacker. The compromise can spread from one user or asset to others; often this is a result of either cached credentials on the asset getting stolen or malware being executed on the asset to steal the credentials of users logging into it.
Note
To ensure accuracy, Asset Session Timelines are updated only when session and non-session data, such as host to IP mappings, have been processed. Data processing may take up to two hours after ingestion.
The Assets page is divided into the following areas:
Asset Directory Information: Contains details about the Asset itself and useful for starting an investigation. This information is typically pulled in from LDAP Server or manually provided by the analyst.
Asset Risk Trend: Shows the risk trend of the asset over time. This graph shows the asset risk analyzed from various log feeds, along with Summary Counters along the top. Below the Summary Counters is a chart that shows different scores over a user-specified window of time. By default, all of the feeds are shown. Time range choices are one week, one month, three months, and one year - these choices are specified in the top right corner.
Asset Risk Reasons: Shows details about the events with non-zero risk scores. The order of the entries is from highest risk score to lowest, though they can also be organized by time. The context for each reason is best investigated in the Timeline Page.
About the Asset Directory Information Page
 |
The Asset Directory Information consists of general asset information, as well as an orange badge at the upper left that shows the number of third-party security alerts that have been triggered on this asset.
General information consists of:
IP Address and labels associated with the asset
First and last-seen dates (first-seen is when Advanced Analytics saw the asset in the IT environment for the first time, last-seen is the date of the most recent sequence where Advanced Analytics detected the asset in the network)
Location of the asset
Top User (the user that logs into this asset the most frequently)
The upper-right corner of the Directory Information always shows the asset’s most recent sequence score, regardless of which sequence is on-screen.
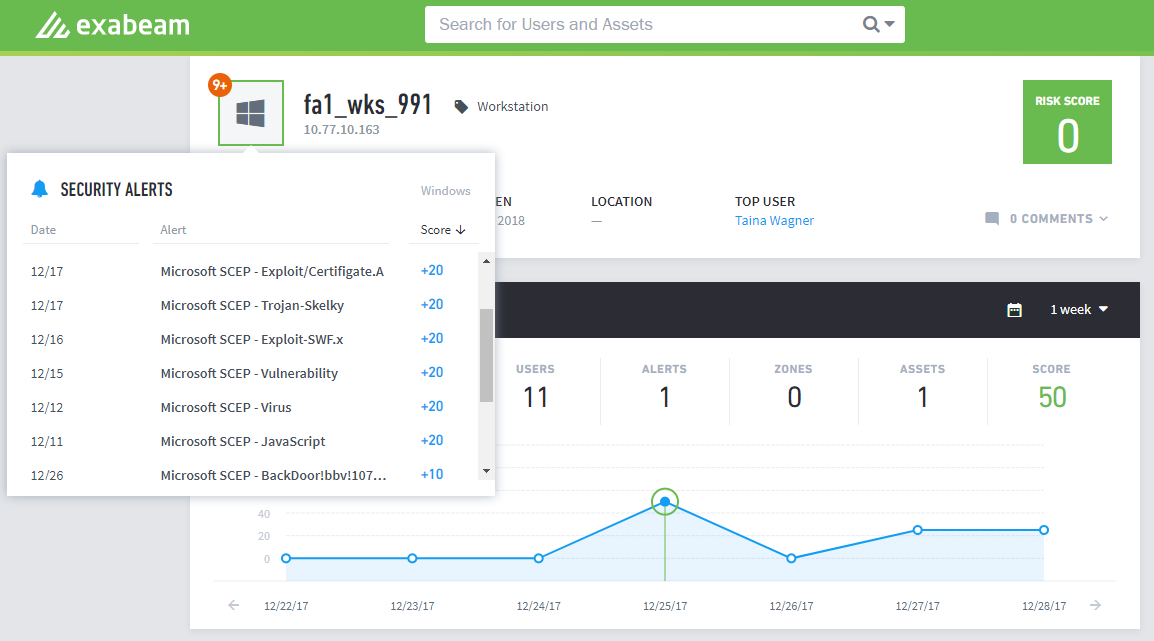 |
Advanced Analytics receives security alerts from an organization’s security systems through the customer’s SIEM,log repository, endpoint security system or malware analysis appliance which may indicate malware is present on a device. Exabeam includes these details in the Security Alerts drop-down list when the icon is clicked and in the Sequence Timeline Page. In the Security Alerts drop-down the event’s risk score determines where it appears in the list. In contrast, the Sequence Timeline Page shows the events by their time in the sequence.
The Comments icon at lower right opens an area for writing comments. Details about annotation are in Commenting on a User, Asset, or Session. In this example, the number of comments on this User is 0.
Get to Know the Asset Risk Trend Page
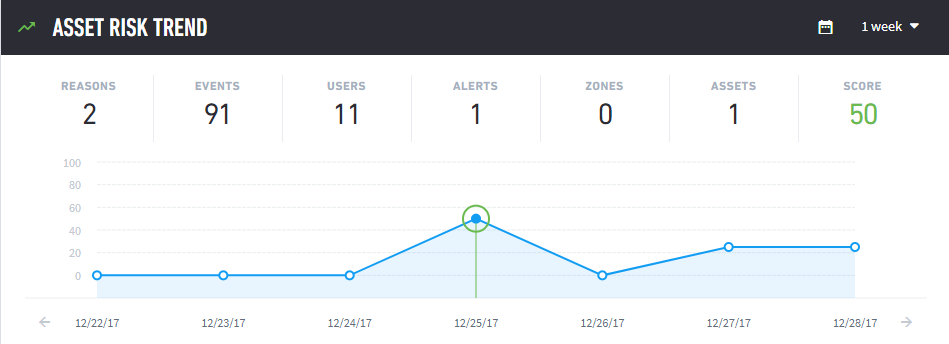 |
The interactive Risk Trend area in the above image shows Summary Counters along the top (these are dynamic and will change depending on your interactions with the graph), a graph of the user’s scores over time, detailed risk reasons for the scores, and links for opening more details.
At top right are choices for the timeframe of the data displayed. The period can be one week, one month, three months, or one year. The calendar icon will let you choose a specific date. Once the date is selected, the chart moves to that specific week with the day highlighted.
The Summary counters are non-interactive and give a quick at-a-glance view of what happened within each sequence or feed. The counters in the asset session summary change depending on the type of trend selected. Values change as the cursor moves over the data points in the graph. Each dot represents the asset session for the day. The Summary consists of the numbers of reasons, events, users, alerts, zones, assets, and score. The score is the total risk score attributed to the asset in the timeframe selected.
The Trend Graph in the center of the Risk Trend shows the scores for sequences and feeds over the period of the selected time frame (one week in this example). The green dots represent non-risky asset sessions, the yellow dots represent risky asset sessions, the red dots represent very high-risk asset sessions.
Clicking on the dot for the event itself in the graph will populate the Reasons area below the graph. When the 1 Year and 3 Months views are chosen, each dot on the graph represents one week; hovering over the dot displays the timeframe it represents as well as the highest score attained by the user in that period. When you select the highest score, the graph will switch to the weekly view for the user.
Immediately below the graph are the dates for the current time frame (whose breadth is selected near the top right of the page). Small arrowheads to the left and right of the dates are for sliding the time window ahead or back.
Get to Know the Asset Risk Reasons Page

This area contains details about all the reasons for the total score in an Asset Session. There are details for items in the Session summary and links to still more information appears among the reason details.
Analysts can reach the Asset Risk Timeline area from the Notable Assets section of the Homepage or the Starred Sessions area.
As in the image above, the title of the reason is to the left, while the score is to the right. By default, the risk reasons are listed by score (highest to lowest), but they can also be sorted by date (earliest first), and log feed type. The total number and values in the reason fields equal the totals in the Asset Session summary.
At the top, next to the Session start and end times, you will notice some smiling faces:
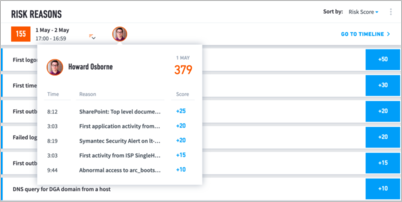
These are the users that had high risks scores and interacted with this asset during this Asset Session. The users are organized from highest risk score to lowest, with the top five highest user sessions highlighted. You can click on these users to see a list of their top risk reasons.
When you click on a specific risk it will expand to offer the description of the alert as well as the event type involved:
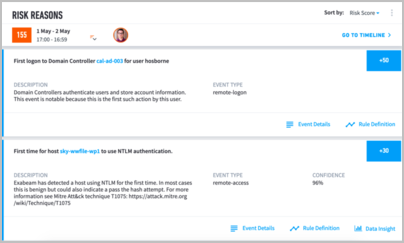
At the top right of the Risk Reasons section, note the Go To Timeline link. Clicking this takes you to the Asset Session Timeline page for the selected Session.
The vertical ellipsis to the right of the filter is where you can choose to accept the Session. Before doing so, be sure to read Accepting a Session or Sequence.
About the Asset Timeline Page
This section describes the contents and capabilities of the Asset Session Timeline Page.
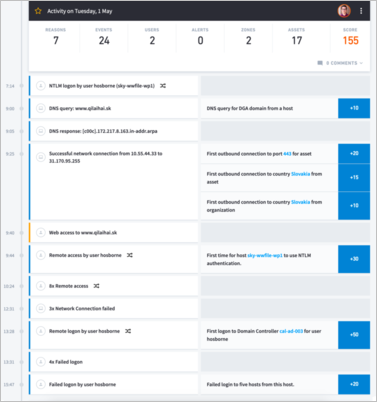 |
Analysts can access the Timeline Page by clicking on the asset score on the homepage or selecting Go To Timeline from the Entity Page.
The Session Timeline Page displays all the events in chronological order during the Session, so the analyst can see all events before and after a security, anomalous, or lockout event. Seeing the whole timeline helps the analyst see, for example, whether a hacker started the Session from outside the network or a legitimate user accessed the asset as part of her normal work on-site (the Entity Risk Trend in the Entity Page shows only anomalies). The timeline includes all events in that Session, whether high, low, or no risk.
Note
In order to ensure accuracy, the Asset Session Timeline is only updated once session and non-session data, such as host to IP mappings, have been processed. This can take up to two hours.
The timeline page shows all events within Asset Sessions by default. Clicking the filter icon at the upper-left corner opens a number of filter options. The analyst can choose to display User Events, Asset Events, Security Events, or a combination of all three. They can also choose to display any combination of lockouts, sequences, and feeds.
Analysts can move back and forth to other Sessions for a particular asset or user to see whether the current threat is a sudden change or has been a gradual development.
The list of events can be very long, so the Asset Session summary provides a mechanism for the analyst to jump to items of interest.
Get to Know the Asset Session Summary Page
Learn about the counters that make-up the Asset Session Summary.
The counters are for categories that an analyst might want to examine in detail. These are interactive and all-inclusive: they represent all events whether the events are benign, anomalous, or threatening.
The session summary expedites investigation. An asset session can have many thousands of events, but instead of scrolling through many screens to locate the risk-associated events, the analyst can click a counter to see a pop-up with all the events for that category. Clicking on an item in the pop-up shifts the timeline to that specific event. The choice of which count to click first can depend on previous steps, but analysts frequently start with a security event.
Details of the counters are as follows:
Reasons – Reasons are details about anomalies or risks. To see the anomalies that contributed to a non-zero risk score, the analyst can click the Reasons counter. Anomalies that also were security threats are in the Security Events counter.
Events – Events are the constituent activities of a session. For example, logging onto a VPN is an event, logging onto an account is an event, and sending a document to a printer is an event.
Users – Users can access different facilities with different sets of logon credentials. Each set of credentials represents an account. This list shows all accounts but does not indicate a first-time use of an account or another anomaly. A first-time use will be in Reasons.
Alerts – Security alert events are threats of malicious activity.
Zones – Network zones are internal network locations. Exabeam and an organization collaborate to define zones during the set-up process. Zones can be cities, business units, buildings, or even specific rooms. For example, “Atlanta” can refer to a network zone in a city rather than the city (all according to an organization’s preference).
Assets – The number of other assets that have connected with this asset during this session. An asset can be a server, workstation, a local host computer of any type, a printer, and so on.
Score - This is the total risk score for this session.
As part of an investigation, an analyst can review the timeline of a risky asset, find users that logged onto the asset at the same time and pivot to the user's timeline. This is important as you investigate threats involving lateral movement and compromised credentials.
At the bottom right is the option to Accept the asset session. Before accepting a session be sure to read Accepting a Session.
From the vertical ellipsis at the top right security analysts can export the events in the session and retrieve the raw logs associated with a session within Exabeam Data Lake. These logs would typically be used to continue the incident response process and forensic work. The analyst can click a link or button in the session page that will open a Log Manager search page pre-configured with a query string that will return all log events related to the current session.
The link in the session page will only appear when the log repository is Data Lake, Splunk, or IBM QRadar.
Get to Know the Asset Session Timeline
This section details the information elements in the Asset Session Timeline.
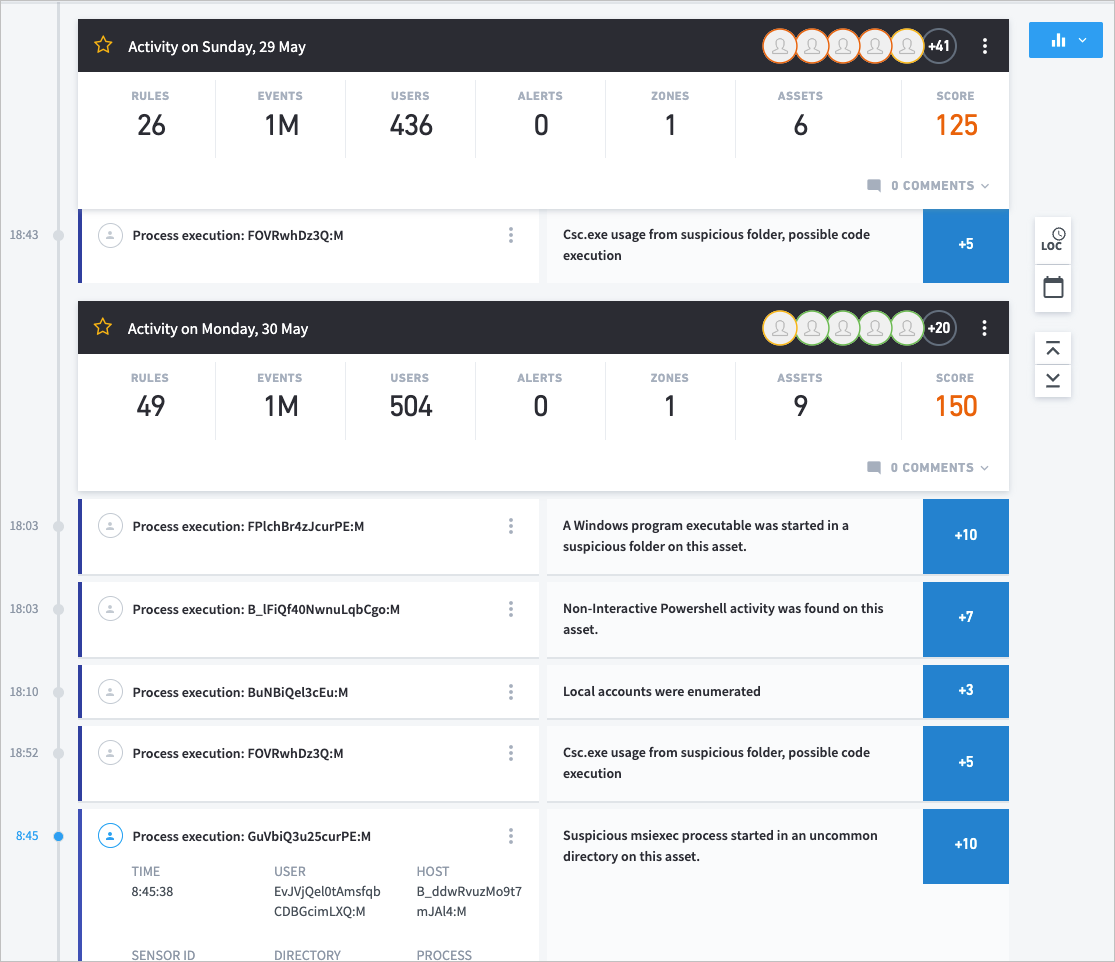
Details for an event are on the left side of the timeline regardless of whether the event was an anomaly or a security risk. If an event also has a risk score, the details of the risk are on the right side of the timeline. Select any event to see more related details, such as User, Event Code, Destination Host, etc.
When the session timeline is opened, by default the events that earned points are expanded. We collapse events of the same type that have no score, in which case the page displays something like, “3x Remote access."
Similar to risk transfer from one user session to another, for an asset risk can be transferred from one session to the next. Risk can also be transferred from an asset to a user. For example, if a user performs an interactive login to a high-risk asset (risk score of 90 or above), a portion of the risk could be transferred to his user session.
Filter Asset Timelines
The Asset Timeline filters can be accessed to the left of the timeline. An analyst can choose to see events associated with the users of the asset, events associated to the asset itself, security alerts on the asset, or a combination of all three. Additionally, they can choose to see any combination of asset session events, lockout events, and feeds. Analysts must select Apply Filters before their selections are applied to the data.
When loading the Asset Timeline Page from the Homepage the default selections are:
User Events
Asset Events
Security Alerts
Session
Selecting the Reset button at the bottom of the filter will reset to these selections.
Accept a Session, Export Events, Create Incidents, and Load Search Parameters From the Asset Timeline
When reviewing events in the Asset Timeline, click the three dots icon to use available actions, including:
Accept – Accept a portion of or an entire session.
Export Events – Export the session events as a .csv file.
The available actions depend on additional Exabeam modules or log integrations, such as:
Create Incident – Create and send an incident to Incident Responder. This option is only available if your Advanced Analytics deployment has an added Case Manager license.
Elasticsearch Logs – Load the Elasticsearch search parameters and link directly to your Elasticsearch console. This option is only available if your Advanced Analytics deployment has integrated with Elasticsearch.
Splunk Logs – Load the Splunk search parameters and link directly to your Splunk console. This option is only available if your Advanced Analytics deployment has integrated with Splunk.
QRadar Logs – Load the QRadar search parameters and link directly to your QRadar console. This option is only available if your Advanced Analytics deployment has integrated with QRadar.
