- What is Exabeam?
- Welcome to the Advanced Analytics Homepage
- High-Level Counters on the Advanced Analytics Homepage
- About the Notable Users List
- Watchlists
- Account Lockouts List on the Advanced Analytics Homepage
- Navigate to Other Pages, Sign Out, or Change Password from the Advanced Analytics Homepage
- Use Dark Mode in Advanced Analytics , Case Manager, and Incident Responder
- Change Language in Advanced Analytics, Case Manager, and Incident Responder
- Get to Know a User Profile
- 1 General Information
- 2 Data Insights
- 3 Active Incident(s)
- 4 User Risk Trend
- 5 Risk Reasons
- Get to Know the User Timeline Page
- Examine Events by Category with the User Session Summary
- About the User Session Timeline
- Filter User Timelines
- View Activity Summary on a Specific Day
- Get to Know the Daily Timeline
- View and Understand an Account Lockout Sequence
- Get to Know the Account Lockout Sequence Timeline
- Accepting a Session or Sequence
- Search for a Data Lake Log from an Advanced Analytics Smart Timelines™ Event
- View a Data Lake Log from an Advanced Analytics Smart Timelines™ Event
- Download a Data Lake Log from an Advanced Analytics Smart Timelines™ Event
- Copy Advanced Analytics Event Data to Your Clipboard
- Search Splunk Logs from an Advanced Analytics Smart Timeline™ Session
- Add Advanced Analytics Evidence to a Case Manager Incident
- Entity Analytics
- Get Started with the Asset Page
- Get Started With the Threat Hunter Page
- Search Histograms Using the Data Insights Page
- Monitor Exabeam Processes Using the System Health Page
- Contact Technical Support
Get to Know a User Profile
Each user in your organization has a profile that contains important security information about them. This section breaks down a profile into its components to help you learn about the information and functionality available in profiles.
From the Home page, under Notable Users, Account Lockouts, Executive Users, or a custom watchlist, select a user's name to navigate to their profile.
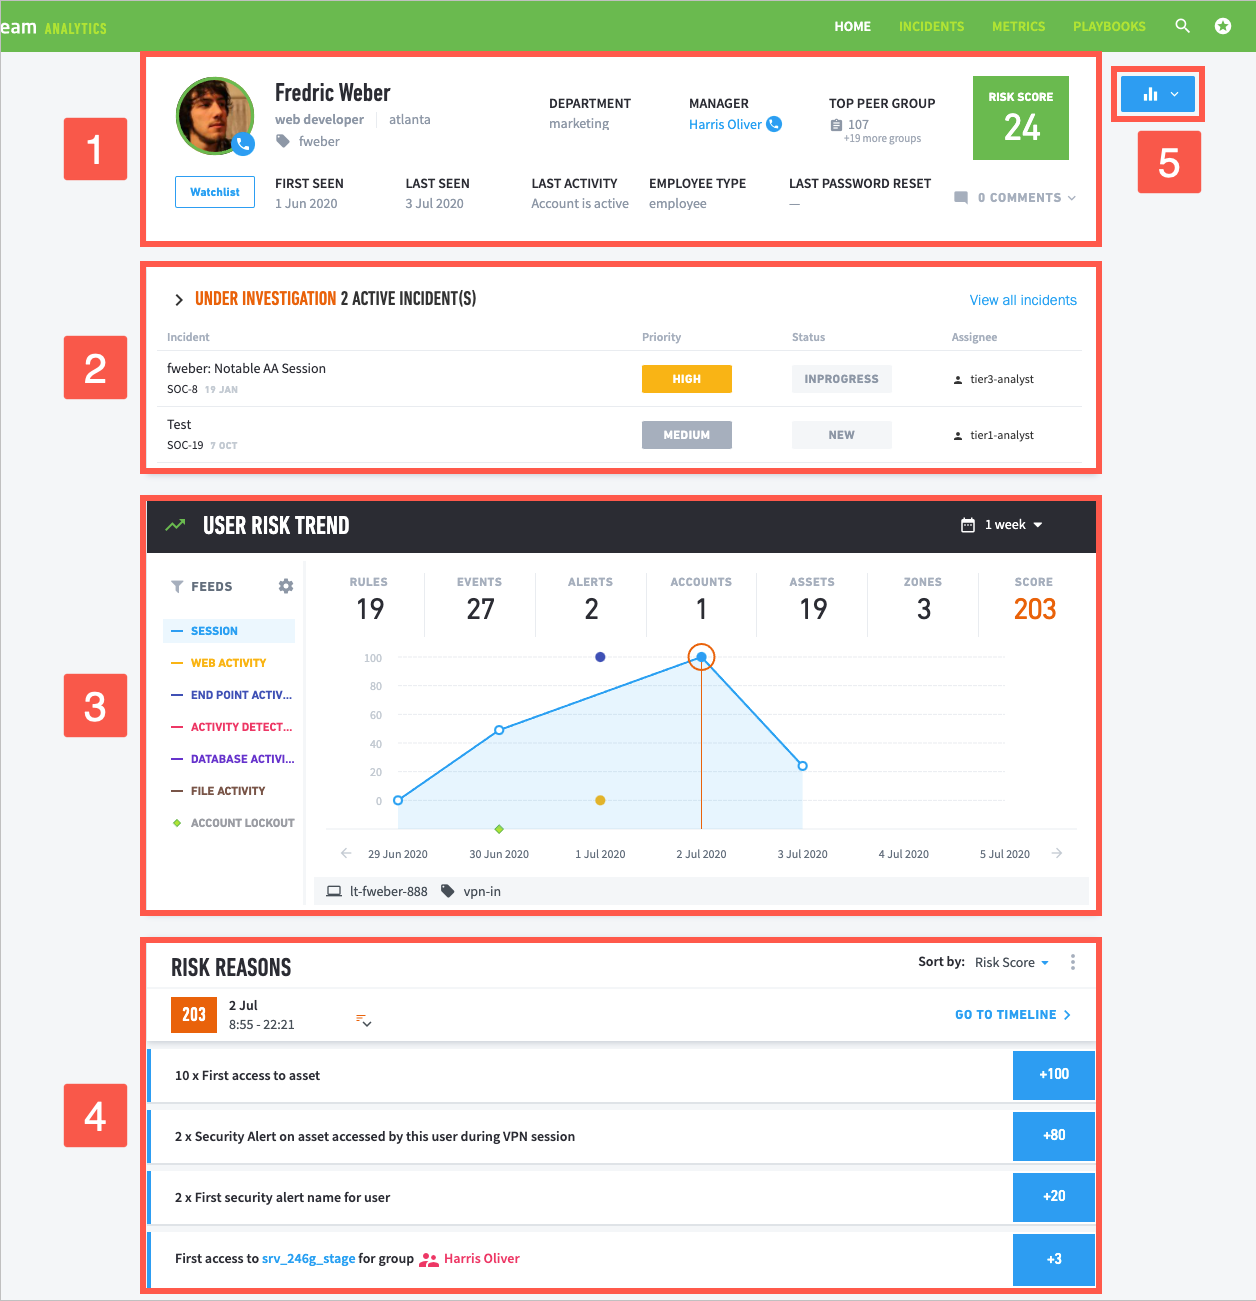

View general information about the user.
1 Review the user's full name, job title, and location, and other identifying labels like executive or privileged. You also see information like:
First seen: Date when Exabeam first detected the the user in the IT environment.
Last seen: Date the user last logged in to a device or network; the user's most recent login event.
Department: Corporate department the user works in.
Manager: Full name of the user's manager. Click to navigate to the manager's user profile.
Top peer group: The peer group the user is most strongly associated with, as defined by a factor of group cohesiveness.
Last activity: Whether the user's account is active, disabled, locked out, or deleted.
Employee type: Type of employee, as defined in the user_employee_type context table; for example, full-time, part-time, or contractor.
Last password reset : Last date and time Advanced Analytics detected that the user reset their password.
2 To reveal the user's contact information, click the phone  icon on the user's profile picture.
3 To add or remove the user from an existing watchlist on the Home page, click the Watchlist button.
4 View the risk score from the user's most recent session.
5 Write comments and notes about the user and view how many comments have been written.
View the user's top five workstations and assets they use, zones and countries they connect from, and times they are active and inactive.
Under each section, hover over each item to to view the number of times the user:
Workstation – Logged onto this workstation.
Assets – Logged onto this asset.
Zones – Accessed this network zone.
Countries – Connected to this country using a VPN.
Time of Week – Was active during this period.
To view more data about the user, click MORE INSIGHTS.
View all active Case Manager incidents for which this user is an entity. Review the date the incidents were created and their priority, status, and assignee.
To navigate to an incident in Case Manager, click the incident's name.
To view this list of incidents in Case Manager, click View all incidents.
View a graph of the user's risk score over a time frame you select.
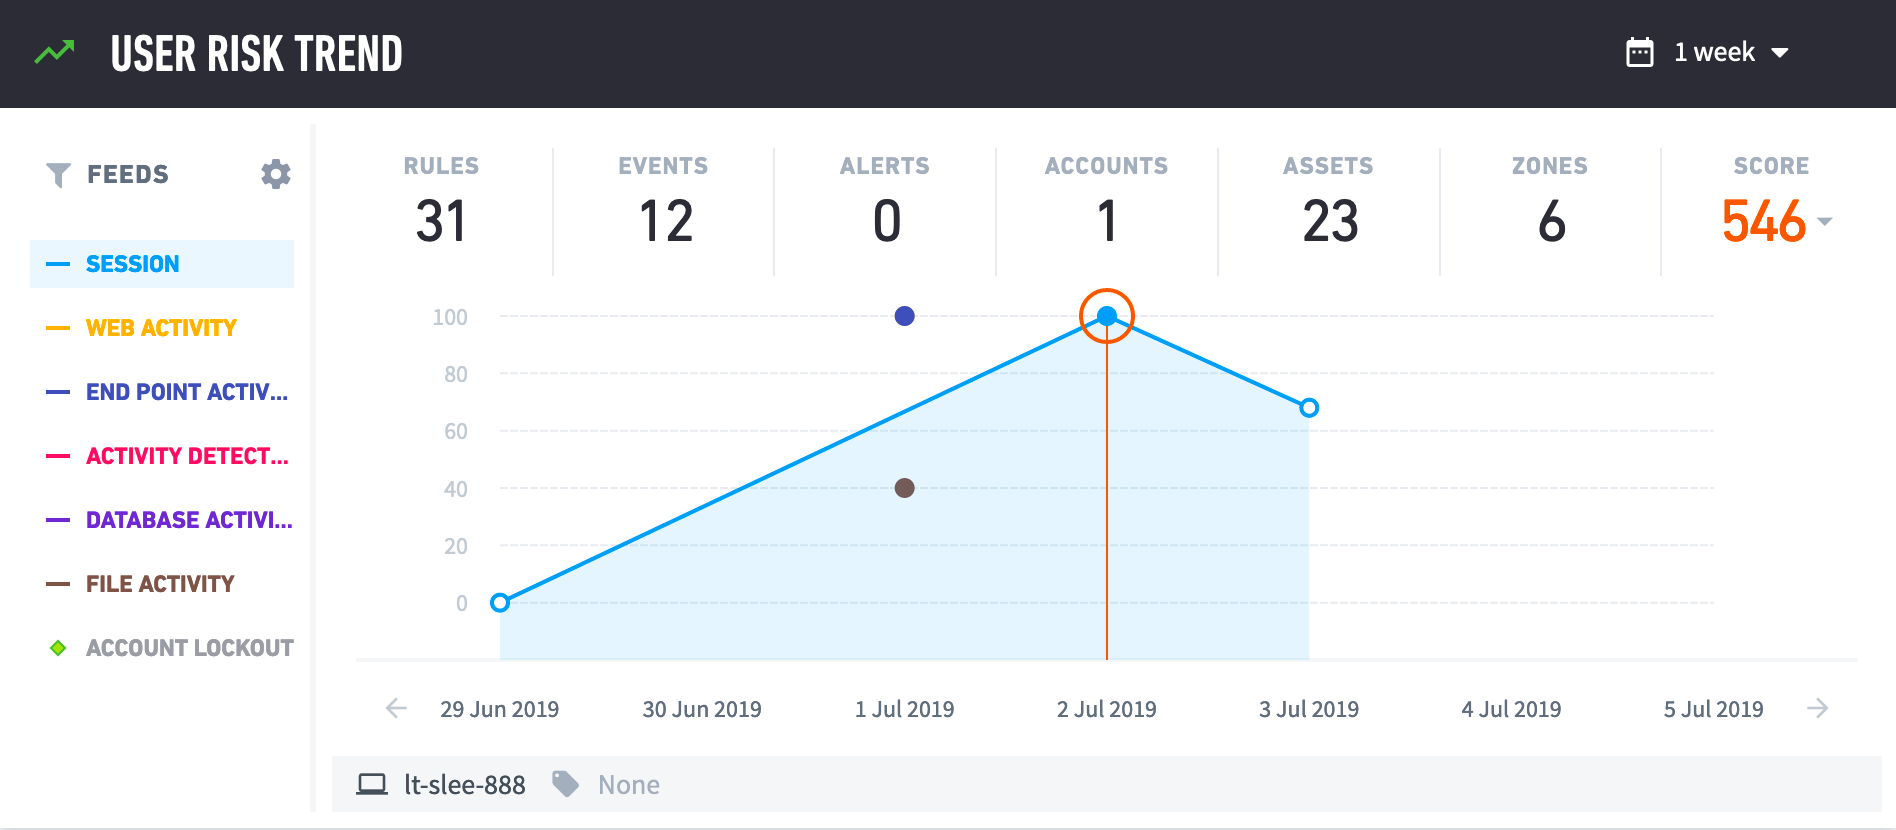
You can view risk scores over a time frame of one week, one month, three months, or one year. To view the risk score from a specific day, click the calendar icon. The graph highlights that day within the time frame you selected.
The y-axis shows the risk score out of 100. The x-axis shows dates in a time frame. To move forward or backward in this time frame, click the left and right arrows.
Depending on time frame, each data point represents something different. If you select one week or one month, each data point represents a user session. If you select three months or one year, each data point represents the user session with the highest risk score in a given week. When you select a data point, the graph switches to the one week time frame.
To view the risk scores for specific types of user activity, you can view different feeds:
Session: All user activity, starting from the time they log in until the time they log out, in a 24 hour period.
Web activity: The user accessed a website, domain, or other web activity.
End point activity: The user accessed an endpoint, or other endpoint activity.
Activity detected by external sources: Any unusual activity as detected by the Change in Daily Activity algorithm, if enabled.
Database activity: The user logged onto a database or other database activity.
File activity: The user read a file, wrote to a file, or other file activity.
Account lockout: The user was locked out of their account or failed to log in.
These feeds correspond to log feeds you configured. To view a feed, click Feeds.
Each data point is highlighted in green, yellow, or red. Green indicates that the session was not risky. Yellow indicates that the session was risky. Red indicates that the session was highly risky.
As you move along the data points, the counters at the top of the graph changes. These counters summarize what happened in the user session; for example, how many events in the session were notable, how many third party alerts the session triggered, how many assets or accounts were involved, and more. The counters vary based on the feed you select.
When you select a data point, you reveal the Risk Reasons. If you view the Account lockout feed, selecting a data point reveals information about the user's account, like any changes, assets they use, and reasons for why the lockout was risky.
When you select a data point in User Risk Trend, you reveal the Risk Reasons. It lists the events that contributed to the data point's risk score.
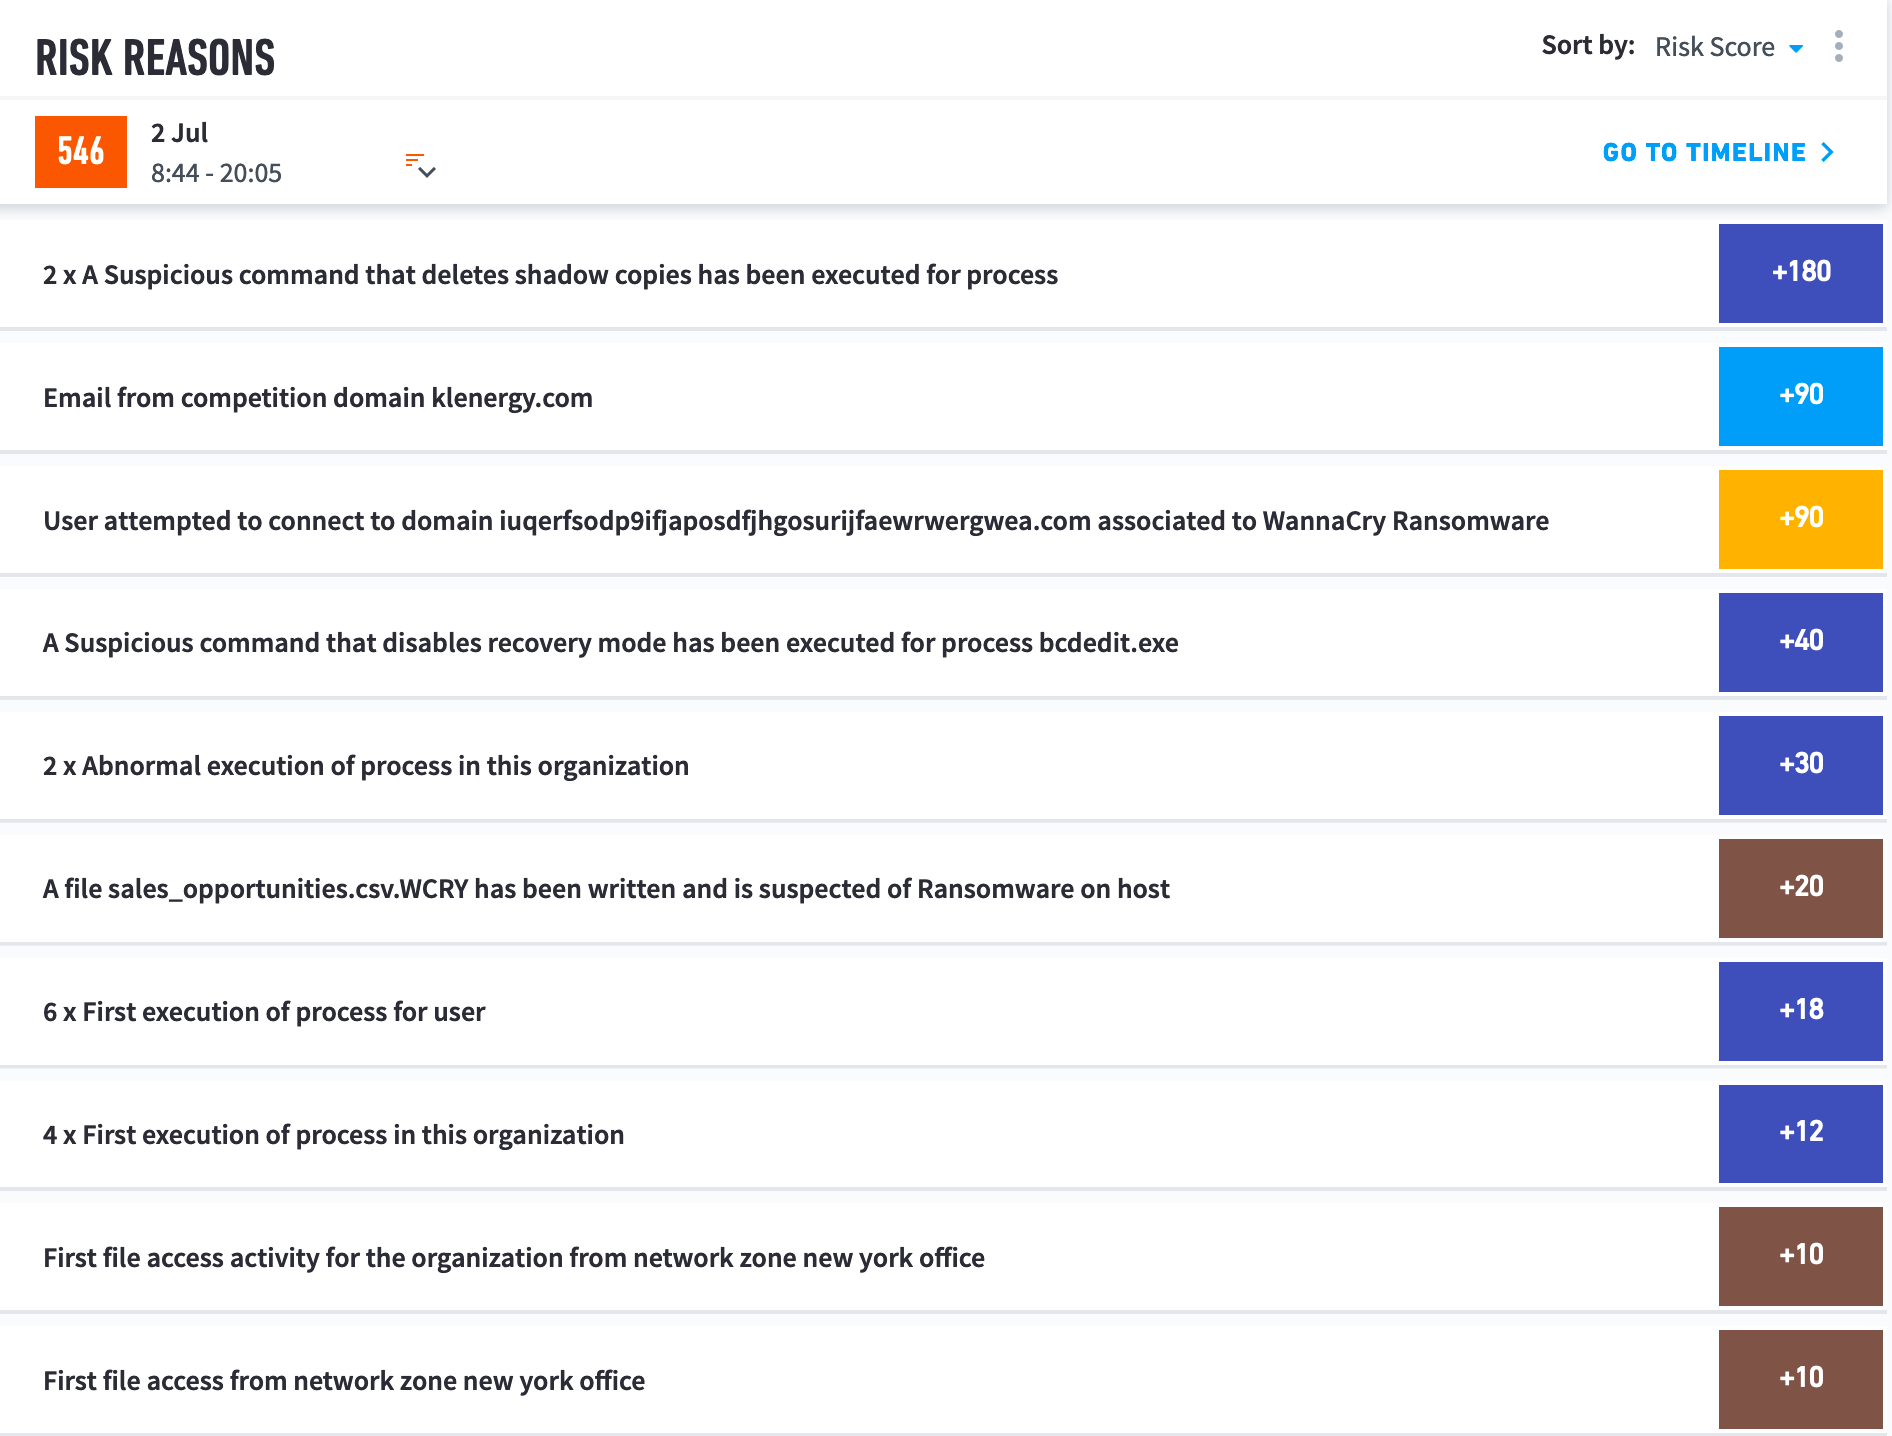
You can sort the events by:
Risk score – Highest to lowest risk score.
Date – Earliest to latest time of day the event occurred.
Log feed – Type of activity, as corresponding to a log feed.
To view the session's Smart Timeline™, click GO TO TIMELINE.
If you view the Account lockout feed, each event is labelled with an arrow. A down arrow indicates that the event reduced the user's risk score, usually that the user was locked out of their own workstation. An up arrow indicates that the the event increased the user's risk score; for example, the user failed to log in from an unusual location.
To view further information about an event, click to open it.
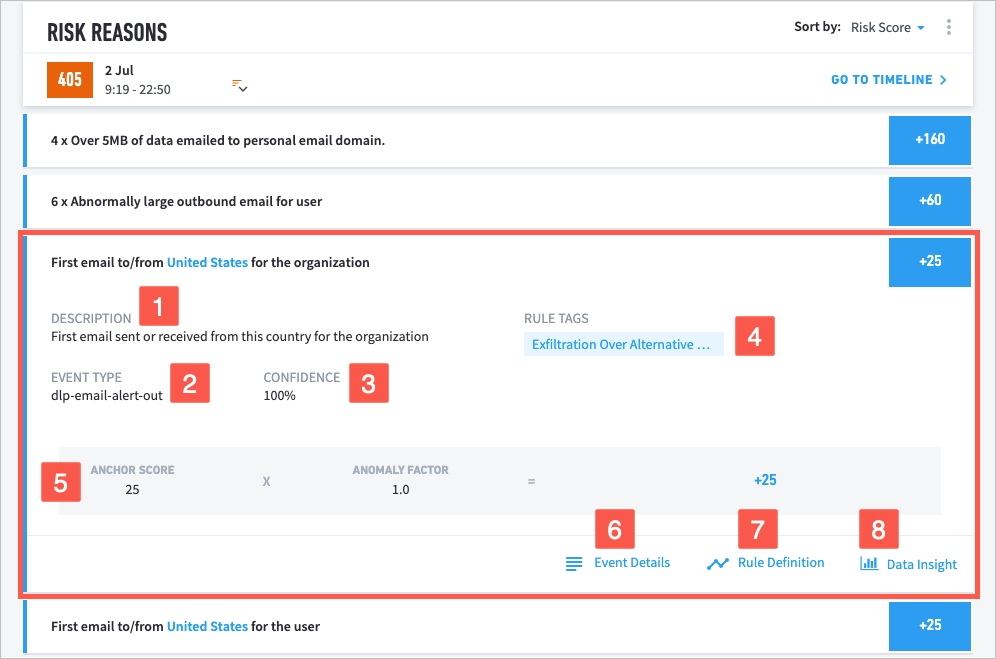
1 Description of the event.
2 Type of event.
3 Level of confidence Exabeam has in the model that triggered the risk rule (not applicable to fact-based rules).
4 Tagged MITRE tactics or techniques that the event is associated with. Click the tag to view a description and navigate directly to the MITRE ATT&CK™ database to learn more.
5 Formula for calculating the event's total risk score, which is based on two variables: the anchor score and anomaly factor.
The anchor score is determined by the specific rule that was triggered.
The anomaly factor measures the degree to which the the action was anomalous for the user. The number is calculated in part by the shape of the user's histogram, how often a rule is triggered, and the size of the user's peer group.
The total risk score is the anchor score multiplied by the anomaly factor.
6 Event Details links to further contextual data about the event.
Note
When a Risk Reason includes more than one of the same event type, you can access Event Details by moving your pointer over an event and clicking the link on the right.

7 Rule Definition links to information about the rule that triggered the event.
8 Data Insights links to information about the model. The link appears only if the triggered rule is associated with a histogram model.
Note
When a Risk Reason includes more than one of the same event type, you can access Data Insight by moving your pointer over an event and clicking the link on the right.

Get to Know the User Timeline Page
This section describes the contents and capabilities of the User Session Timeline page.
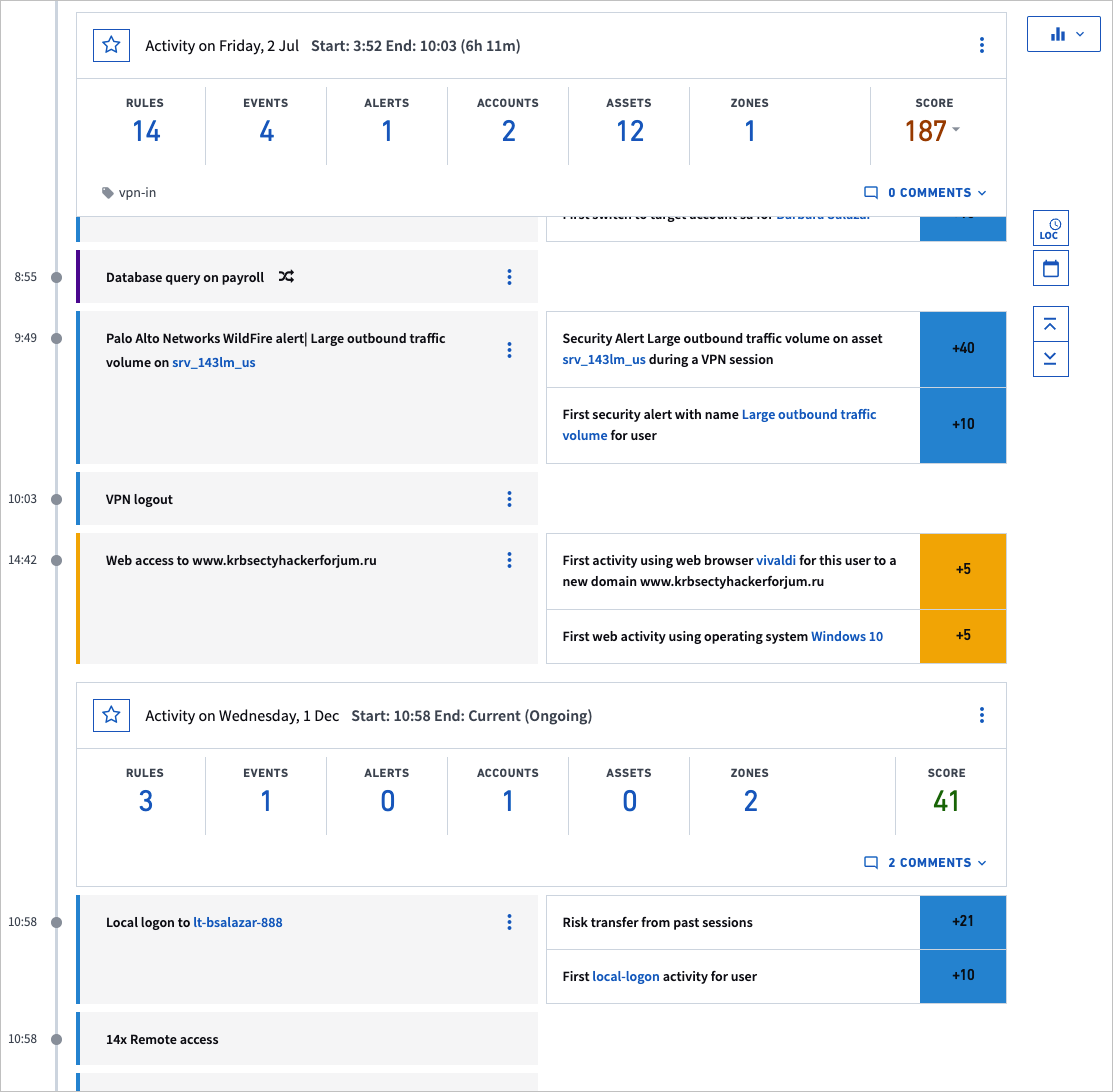
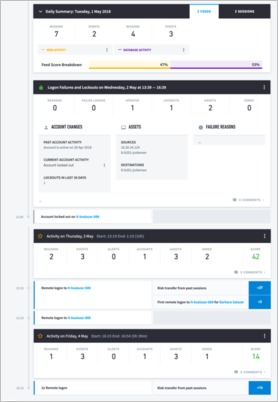
Analysts can access a user's Timeline by clicking on the user risk score on the homepage, selecting Go to Timeline from the user page, or from user search results in Threat Hunter.
The Session Timeline Page displays all the events in chronological order during the session, so the analyst can see all events before and after a security, anomalous, or lockout event. Seeing the whole timeline helps the analyst see, for example, whether a hacker started the session from outside the network or the legitimate user started the session on-site (the Risk Timeline in the User Page shows only anomalies). The timeline includes all events in that session, whether high, low, or no risk. There are three logical containers of information that are displayed on the timeline: Daily Summary, Sessions, and Account Lockout Sequences.
By default, the timeline page will only show sessions and events within sessions. Daily Summary and Feeds are turned off. However, clicking the filter icon at the upper-left corner of the Session Page opens a calendar and filters. The analyst can choose to display all events or only those events that were anomalous. They can also choose to display lockouts, sessions, feeds, or all. In the calendar any date with a color is a day for which Exabeam has data - black numbers are inactive days, green are days within a normal range, and red are days with a high risk score. The analyst can choose the date of a different session for the same user and filter how they see the timeline.
Account Lockout Sequences appear within the Timeline when the Show Lockouts filter is selected. It is also turned on by default when the analyst is clicking on notable lockouts from the home page. They contain their own Sequence Summary, followed by the events in that sequence.
Feeds appear within the Timeline under the heading Daily Summary when any feed is selected in the filter.
Analysts can move back and forth to other sessions for a particular user to see whether the current threat is a sudden change or has been a gradual development. The image above shows the Session Summary, which is the upper part of the Session Timeline Page and illustrates how to go to the previous session. At the bottom of the timeline, the analyst can go to the next timeline if one exists.
The list of events can be very long, so the session summary provides a mechanism for the analyst to jump to items of interest.
Examine Events by Category with the User Session Summary
This section defines the counters that make up the session summary. The counters are for categories that an analyst might want to examine in detail. These are interactive and all-inclusive: they represent all events whether the events are benign, anomalous, or threatening.


The session summary expedites research. A session can have many thousands of events, but instead of scrolling through many screens to locate the risk-associated events, the analyst can click a counter to see a popup with all the events for that category. Clicking on an item in the popup shifts the timeline to that specific event. The choice of which count to click first can depend on previous steps, but analysts frequently start with a security event.
Details of the counters are as follows:
Reasons: Reasons are details about anomalies or risks. To see the anomalies that contributed to a non-zero risk score, the analyst can click the Reasons counter. Anomalies that also were security threats are in the Security Events counter.
Events: Events are the constituent activities of a session. For example, logging onto a VPN is an event, logging onto an account is an event, and sending a document to a printer is an event.
Alerts – Security alert events are threats of malicious activity.
Accounts: Users can access different facilities with different sets of logon credentials. Each set of credentials represents an account. This list shows all accounts but does not indicate a first-time use of an account or another anomaly. A first-time use will be in Reasons.
Assets: An asset can be a server, workstation, a local host computer of any type, a printer, and so on.
Locations: Locations are networks zones rather than a necessarily physical place. Network zones are internal network locations. Exabeam and an organization collaborate to define zones during the set-up process. Zones can be cities, business units, buildings, or even specific rooms. For example, “Atlanta” can refer to a network zone in a city rather than the city (all according to an organization’s preference).
Score: This is the total risk score for this session.
Near the bottom of the session summary in is a tag icon. This icon is a label for the nature of the VPN that started the session (if applicable). In the current release, this label is informational only. The possible labels are:
VPN-in means the user started the session by logging onto a VPN to get inside the IT environment.
VPN-within means the user started the session from a local workstation but then started a VPN, for example, to a more secure part of the enterprise.
VPN-out means the user logged onto a VPN to the outside of the local network. This scenario is the least likely.
At the bottom right is the option to query Splunk Logs, Export Events, and Accept Session. Before accepting a session be sure to read Accepting a Session on page 1.
If your SIEM is Splunk, then clicking Splunk Logs opens a new window where you can search for events within Splunk, with the appropriate query parameters set. This is helpful if an analyst wants to gather additional details regarding the user by looking within the SIEM during investigations.
Clicking the Export Events link exports all the events in a user session to a CSV file that the user can save locally; default file name is Exabeam_<username>_<sessionid>_<riskscore>. The CSV contains a list of all events and key details. Columns titled time, session_id, Event_id, event type, host source, user, and account are populated for every file. The columns following those are dependent on the information available (i.e. dest_host, domain, etc.). Under risk_reason the rules that were triggered are listed; if more than one rule was triggered then semicolons separate them.
About the User Session Timeline
This section describes the information elements in the User Session Timeline.
Details for an event are on the left side of the timeline regardless of whether the event was an anomaly or a security risk. If an event also has a risk score, the details of the risk are on the right side of the timeline.
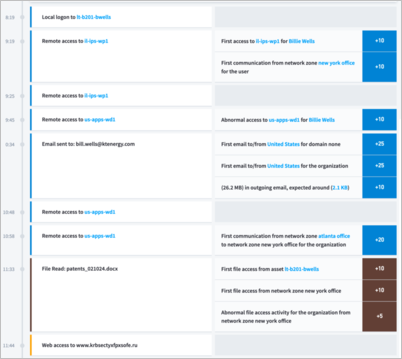
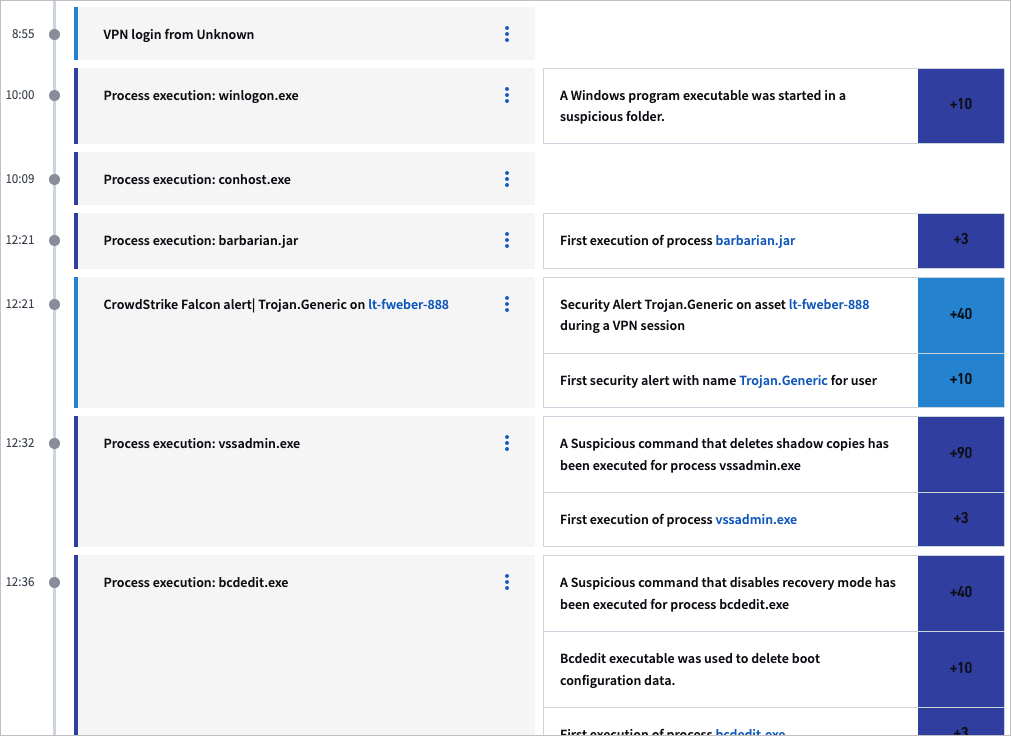
The risk from Sequences and Daily Feeds can be transferred to the session. For example, Exabeam could have found that the user’s web activities included going to a malicious domain, which resulted in a risk score. This score will be transferred to the user’s session. If the malicious web activity happened outside of a session (i.e. during a time period where there was not an open session) the score will be transferred to the user’s next session.
When the session timeline is opened, by default the events that earned points are expanded. We collapse events of the same type that have no score, in which case the page displays something like, “3x Remote access,” as in the center of the image above.
The image also shows a session started about 5:45PM, with three risk transfers from web activities (clicking on any of those highlighted web activities links will take you to the relevant Daily Summary where they occurred) and ten points added to the session because of the abnormal session start time.
Filter User Timelines
The drop-down Filter panel can be accessed to the left of the timeline. An analyst can choose to see all events, or only those with anomalies. They can also choose to see any combination of session and feeds. When loading the timeline page from the homepage the default selections are All Events and Session Activity turned on; Web Activity and Account Lockout are off.
The calendar at the bottom makes it easy to jump to a different day. The days are color coded to signpost when there was a high-risk session - red indicates a high-risk session, green indicates a low-risk session.
View Activity Summary on a Specific Day
The Daily Summary and Timeline only appear when at least one of the feeds filters are turned on.


A Feed here refers to events that happen outside of the logical container of a session. They are often high volume feeds and processed in parallel to session and lockout sequences. These can be application logs, web access logs, DHCP, etc. Feeds are measured in a different timeframe to sessions - they are 24 hours. If a feed begins at 5pm on 01/10/16 then it will end at 5pm on 01/11/16. Anomalies within daily feeds will be assigned a risk score and that score is transferred to the nearest session that begins after the feed. You will also notice the Feed Score Breakdown at the bottom of the Daily Summary. This is an at-a-glance bar graph that breaks down what percentage of each feed comprises the Daily Summary. This is color-coded to match the color of each feed in the timeline.
The Daily Summary provides a look at what happened in a 24-hour period. This is different from the session view because sessions are bound by the time a user logs in, to when the user logs out. The Daily Summary is a way to look only at what happened on a specific day.
At the top of the Daily summary heading are tabs on the right which allow you to select if you want to see a summary of the day’s feeds or a summary of the day’s session and lockout events that also occurred in that same day. In the image above, the Feed tab is selected. This informs the analyst of all the feed activity that happened during the day; in this case the user had 2 feeds, one with 160 web activity events for which there was 0 risk reasons, and one with 273 DHCP events for which there was 1 risk reason. Clicking on the reason will open a pop-up window that explains what the event was and how many points were added to the session because of it.


If the analyst were to select the Session & Lockout tab, as in the above image, she would see that there was 1 Lockout Event and one Session that began during that day. Because there is no logout event the session did not end during that same day, however. You can jump to the lockout or session header by clicking Go to Lockout or Go to Session.
Get to Know the Daily Timeline
This section describes the information elements present in the Daily Timeline.
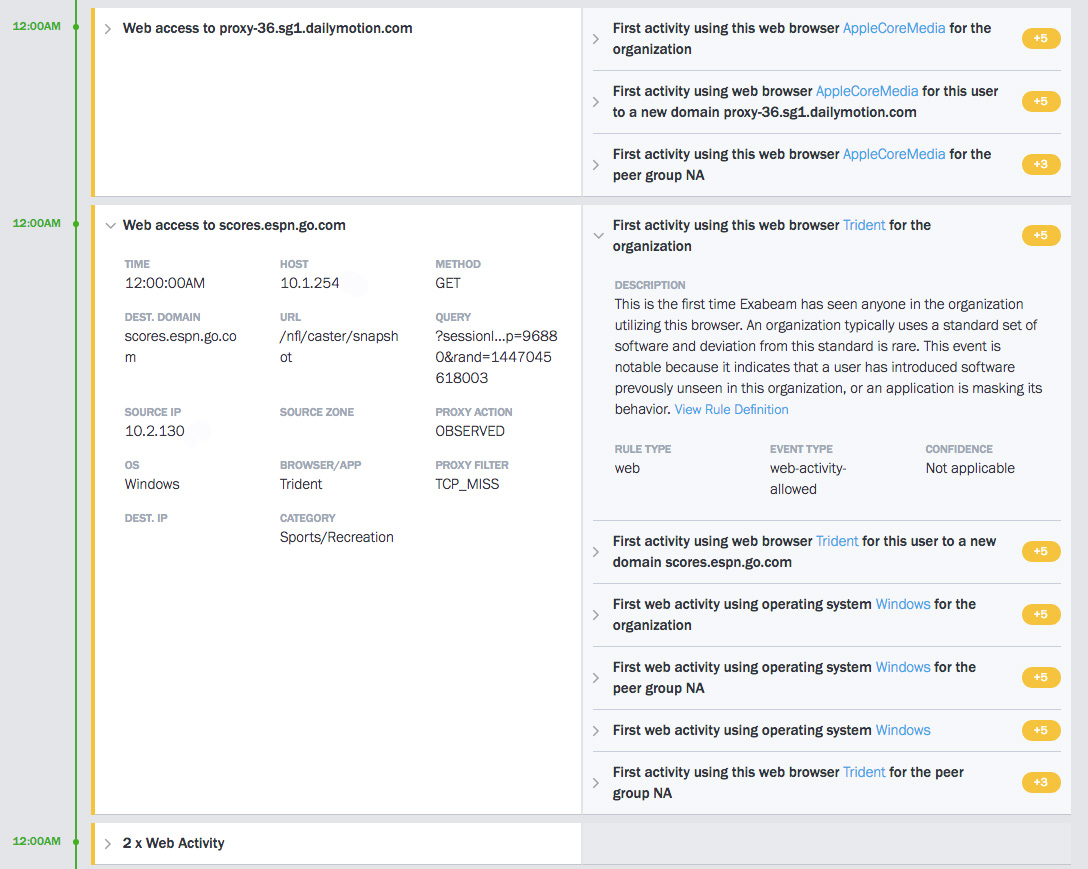
The Daily Summary and Daily Timeline only appear when one or more of the feeds filters are turned on; the Daily Timeline will show all of the feeds that are selected in the filter. For example, in the image above, the Web Access filter is turned on, and so all of the Web Access events are present in the Daily Timeline.
The event itself is on the left side of the timeline, and if the event was assigned a risk score then the details of the rule(s) triggered are to the right. We collapse events of the same type that have no risk score. Clicking a caret will open further details. In the image above, six rules were triggered by the Web Access to scores.espn.go.com event, five of those rules were assigned a risk score of 5 points and one a score of 3 points, totaling 28 risk scores for that one event.
View and Understand an Account Lockout Sequence
Analysts can access an Account Lockout Sequence by clicking the warning symbol on the homepage or clicking View Activity on the User page. By default, the Show Lockouts filter will be turned on and the Show Sessions filter will be off.
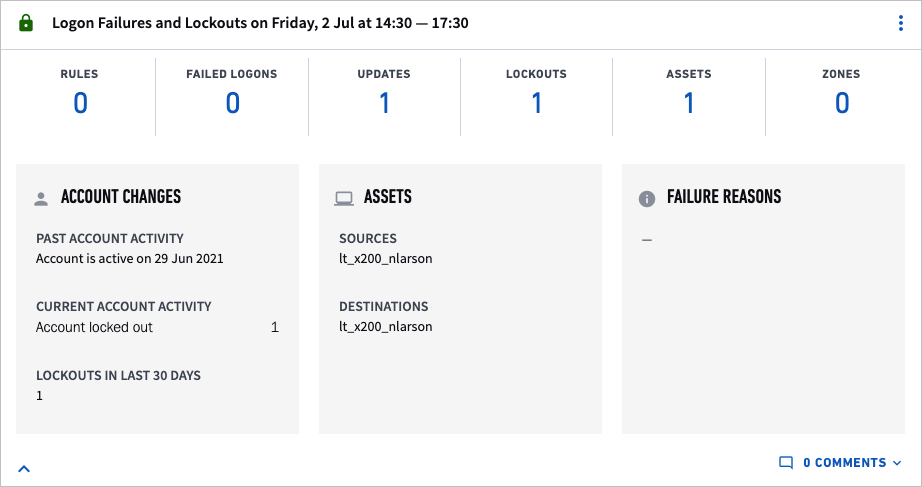
The image above shows the summary for an account lockout sequence in the timeline. To the left of the Logon Failures and Lockouts title is a warning icon – orange means Exabeam deems this sequence risky, green means Exabeam sees it as normal. The summary counters at the top give detailed information about the lockout related activities, including:
Reasons – Anomalies or risks that were identified in a lockout sequence. To see the anomalies that contributed to a non-zero risk score, click the Reasons counter.
Failed Logons – The number of times this user has failed to logon in this sequence.
Updates – These represent any changes to the user account within Active Directory, such as a user account disabled or a user account password reset.
Lockouts – The number of times this user has been locked out of an account in this sequence.
Assets – An asset can be a server, workstation, a local host computer of any type, a printer, and so on.
Zones – Zones are network zones rather than a necessarily physical place. Network zones are internal network locations. Exabeam and an organization collaborate to define zones during the set-up process. Zones can be cities, business units, buildings, or even specific rooms. For example, “Atlanta” can refer to a network zone in a city rather than the city (all according to an organization’s preference).
Note
As with user sessions, you have the option to Accept Activities in the account lockout sequence. Before Accepting Activities please read the section Accepting a Session or Sequence.
Get to Know the Account Lockout Sequence Timeline
This section describes the information elements in an account lockout sequence timeline.
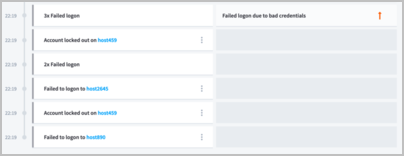
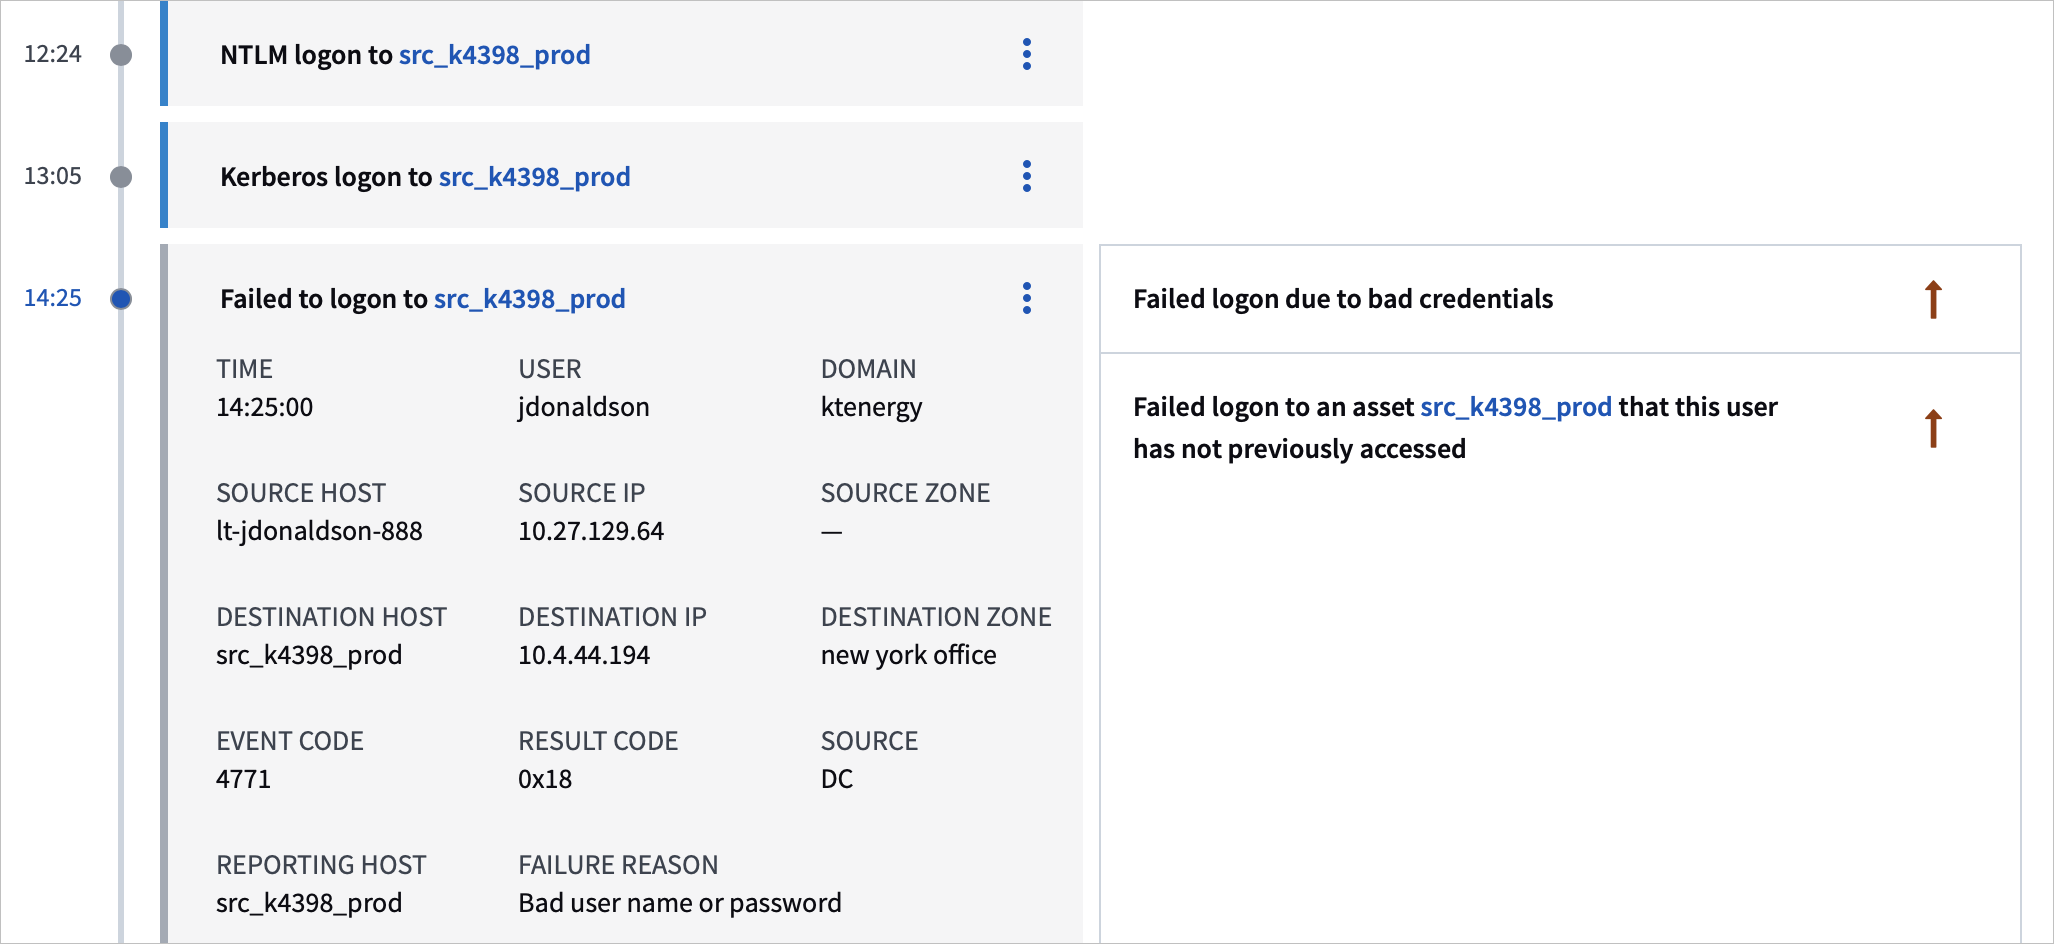
Details for the event itself are on the left side of the timeline and details of the risk – including the rule triggered and how Exabeam has evaluated the event – are on the right side of the timeline. Events of the same type and reason are aggregated, in which case the page displays something like “15 x Account lockout” as in the image below.
Exabeam views account lockout events slightly differently from standard session events. For one, they are not given a score, but a binary rank of either Risky or Normal. In addition, certain lockout related activities increase the risk of the event and some reduce it. For example, if a user fails to logon from an abnormal location, that is a risk increasing activity. Alternatively, if a user has changed their password recently and they are failing to logon to their workstation, that is a risk reducing activity. In the image below, the orange up arrow indicates this is a risk increasing event, while the green down arrow indicates a risk reducing event.
The sum of these scores determines whether Exabeam sees the sequence as risky or normal – if risky the sequence will show an orange warning symbol and appear on the homepage. In addition, if a sequence is risky, 50 points are added to the overall session score.
Comment on a User, Asset, or Session
An analyst can document the details and progress of an investigation by using text-entry boxes for writing comments. The boxes are available in the User Page, Asset Page, and Session Timeline Page. A comment can explain a change in behavior, such as why a new behavior is acceptable. Comments can be a thread of discussion between analysts.
Accepting a Session or Sequence
Experienced analysts, such as Tier 3 Analysts, can accept behaviors for users and assets so that the behaviors no longer trigger alerts. Accepted behaviors are effectively whitelisted. This action applies only to the particular user or asset associated with the session or sequence, and it is only applied to future events. Sessions and sequences that occurred prior to the date of acceptance are not affected. This feature requires extreme caution because once a behavior is accepted, the action cannot be undone.
Behaviors can be accepted from the User, User Timeline, Asset, and Asset Timeline pages.
Warning
When behaviors are accepted, they are permanently whitelisted for the associated user or asset. Reverting accepted behaviors is not supported.
Accepting behaviors can undermine security and put your organization at risk. The best practice for eliminating unwanted alerts is through tuning the rules and/or models.
Accept a Partial Session or Sequence
Warning
When behaviors are accepted, they are permanently whitelisted for the associated user or asset. Reverting accepted behaviors is not supported.
Accepting behaviors can undermine security and put your organization at risk. The best practice for eliminating unwanted alerts is through tuning the rules and/or models.
When analysts do not want to accept the behaviors in an entire session or sequence, they can accept individual behaviors. For example, in a session that includes a First Access to Asset alert and an Account Switch alert, the analyst can accept one of the behaviors without accepting the other.
Note
Risk transfers from previous sessions, account lockouts, and feeds cannot be accepted.
For simplicity, the remainder of this section refers only to sessions, but the procedure is also applicable to asset sequences and lockout sequences.
To accept a partial session:
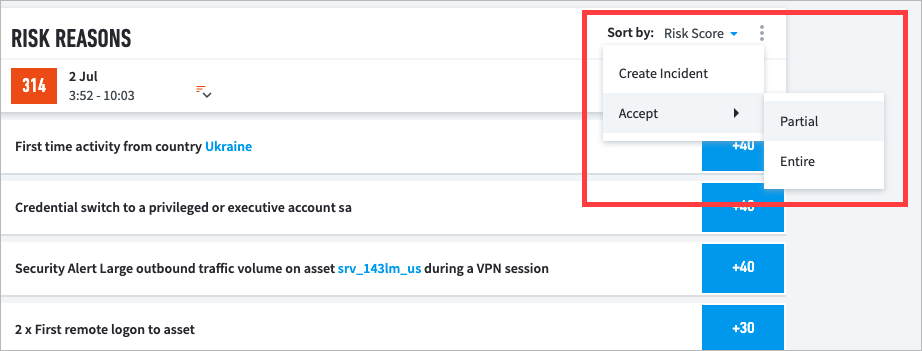
On the right side of the Risk Reasons header bar, click the vertical ellipsis icon (
 ), and then click Accept > Partial.
Note
If you do not have permission to accept behaviors, the Accept feature is disabled. The feature is also disabled if all the triggered rules in a session are risk transfers, or if they have already been whitelisted.
Checkboxes appear on the left for each of the individual risk items.
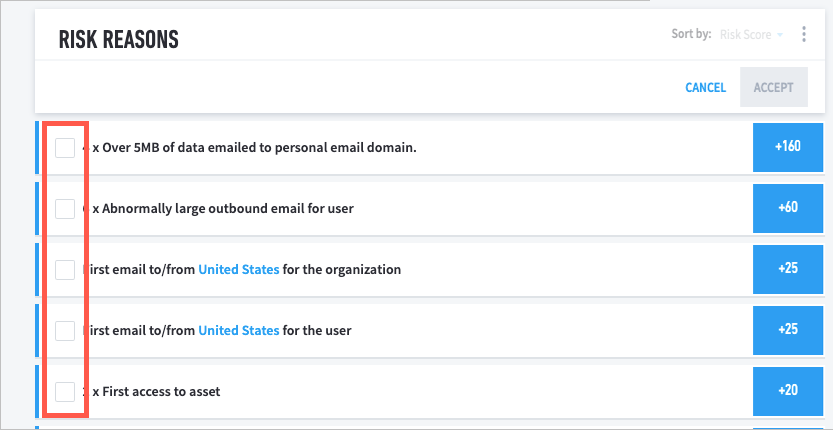
Select the checkbox for each of the behaviors that you want to accept.
Click Accept.
A confirmation dialog box appears.

To confirm that you want to accept the selected behaviors, click OK.
Note
This process can be repeated as many times as necessary within the same session.
Search for a Data Lake Log from an Advanced Analytics Smart Timelines™ Event
As you investigate an Advanced Analytics notable user or asset's event, search for the Data Lake log that created the event.
Ensure you configured the relevant settings.
Navigate to an asset or user's Smart Timeline™:
To navigate to an asset Smart Timeline: On the Home page, find the NOTABLE ASSETS watchlist or other watchlist you created, then select an asset's risk score. Or, from a watchlist, select the asset's name, then under Risk Reasons click Go to Timeline.
To navigate to a user Smart Timeline: On the HOME page, find the NOTABLE USERS, Account Lockouts, Executive Users, or other watchlist you created, then select a user's risk score. Or, from a watchlist, select the user's name, then under Risk Reasons click Go to Timeline.
In the session header, click the menu, then select ElasticSearch Logs.
Select the time range, accounts, and/or host names to query, then click Go to ElasticSearch.
View a Data Lake Log from an Advanced Analytics Smart Timelines™ Event
As you investigate an Advanced Analytics notable user or asset's event, view and navigate directly to the corresponding Data Lake log that created the event.
If you upgrade Advanced Analytics from a previous version to version i52, you can view logs only for events created after the upgrade.
You must have Data Lake i33 or above.
Ensure that you have Data Lake i33 or above, configured Data Lake as a log source, and View Raw Logs permissions.
If you don't have View Raw Logs permissions, you only see the Advanced Analytics event, but not the Data Lake log. To request View Raw Logs permissions, contact your Exabeam administrator.
Navigate to an asset or user's Smart Timeline™:
To navigate to an asset Smart Timeline: On the Home page, find the NOTABLE ASSETS watchlist or other watchlist you created, then select an asset's risk score. Or, from a watchlist, select the asset's name, then under Risk Reasons click Go to Timeline.
To navigate to a user Smart Timeline: On the HOME page, find the NOTABLE USERS, Account Lockouts, Executive Users, or other watchlist you created, then select a user's risk score. Or, from a watchlist, select the user's name, then under Risk Reasons click Go to Timeline.
Select a sequence, then click View Logs. View the parsed Advanced Analytics event data and the Data Lake raw log.
In the Advanced Analytics event data, the highlighted fields are those already appear in the Smart Timeline event. The non-highlighted fields are hidden from the timeline event and appear only under this view.
To view the raw log in Data Lake, click GO TO DATA LAKE. If your Data Lake session has been inactive, you may be asked to log in.
Download a Data Lake Log from an Advanced Analytics Smart Timelines™ Event
From an Advanced Analytics Smart Timelines™ event, download the Advanced Analytics event data in JSON format or raw Data Lake log in text format. Then, further investigate the log, or even attach these files to a Case Manager incident as an artifact.
If you upgrade Advanced Analyticsfrom a previous version to version i52 or later, you can view logs only for events created after the upgrade.
You must have Data Lake i33 or above.
Ensure that you have Data Lake i33 or above, configured Data Lake as a log source, and View Raw Logs permissions.
If you don't have View Raw Logs permissions, you only see the Advanced Analytics event, but not the Data Lake log. To request View Raw Logs permissions, contact your Exabeam administrator.
Navigate to an asset or user's Smart Timeline:
To navigate to an asset Smart Timeline: On the Home page, find the NOTABLE ASSETS watchlist or other watchlist you created, then select an asset's risk score. Or, from a watchlist, select the asset's name, then under Risk Reasons click Go to Timeline.
To navigate to a user Smart Timeline: On the HOME page, find the NOTABLE USERS, Account Lockouts, Executive Users, or other watchlist you created, then select a user's risk score. Or, from a watchlist, select the user's name, then under Risk Reasons click Go to Timeline.
Select a sequence, then click View Logs. View the parsed Advanced Analytics event data and the Data Lake raw log.
In the Advanced Analytics event data, the highlighted fields are those already appear in the Smart Timeline event. The non-highlighted fields are hidden from the timeline event and appear only under this view.
Click EXPORT LOGS.
Select to download the Advanced Analytics event data in JSON format or raw Data Lake log in text format, then click DOWNLOAD. The file(s) download as a compressed .zip file.
Copy Advanced Analytics Event Data to Your Clipboard
From an Advanced Analytics timeline event, copy the Advanced Analytics event data or Data Lake raw log to your clipboard. Then, verify if all the fields are parsed or continue to investigate specific log values in Data Lake.
To view the Data Lake raw log, ensure that you've configured Data Lake as a log source and you have View Raw Logs permissions.
If you don't have View Raw Logs permissions, you only see the Advanced Analytics event data, but not the Data Lake raw log. To request View Raw Logs permissions, contact your Exabeam administrator.
Navigate to an asset or user's Smart Timeline:
To navigate to an asset Smart Timeline: On the Home page, find the NOTABLE ASSETS watchlist or other watchlist you created, then select an asset's risk score. Or, from a watchlist, select the asset's name, then under Risk Reasons click Go to Timeline.
To navigate to a user Smart Timeline: On the HOME page, find the NOTABLE USERS, Account Lockouts, Executive Users, or other watchlist you created, then select a user's risk score. Or, from a watchlist, select the user's name, then under Risk Reasons click Go to Timeline.
Select a sequence, then click View Logs. View the parsed Advanced Analytics event data and the Data Lake raw log.
In the Advanced Analytics event data, the highlighted fields are those already appear in the Smart Timeline event. The non-highlighted fields are hidden from the timeline event and appear only under this view.
Next to Advanced Analytics Event or Raw Logs from Data Lake, click COPY. The data is copied to your clipboard as plain text, with the Advanced Analytics event data in JSON syntax. If there are multiple Data Lake logs, all of them are copied.
Search Splunk Logs from an Advanced Analytics Smart Timeline™ Session
If you configured Splunk as a log source, pivot from an Advanced Analytics user's or asset's Smart Timeline™ to a Splunk log to gather further details about the session.
Ensure that you configured Splunk as a log source.
Navigate to a user's or asset's Smart Timeline.
To navigate to a user's Smart Timeline:
On the Home page, under Notable Users, Account Lockouts, Executive Users, or other watchlist you created, select a user's name. Under Risk Reasons, select GO TO TIMELINE.
On the HOME page, under Notable Users, Account Lockouts, Executive Users, or other watchlist you created, select a user's risk score.
To navigate to an asset's Smart Timeline:
On the Home page, under Notable Assets or other watchlist you created, select an asset's name. Under Risk Reasons, select GO TO TIMELINE.
On the HOME page, under Notable Assets or other watchlist you created, select an asset's risk score.
In the session header, click the menu
 , then select Splunk Logs.
Select the time range, hostnames, and/or IP addresses to query, or enter your own custom query in the text box. By default, the query is index=*, but it's best if you replace * with the relevant index values.
Click Go to Splunk.
Add Advanced Analytics Evidence to a Case Manager Incident
If an Advanced Analytics-generated incident doesn't include all the entities or artifacts you need, add them to the incident directly from Advanced Analytics.
When an Advanced Analytics user or asset session crosses a configured risk threshold, Case Manager automatically creates an incident. By default, Advanced Analytics adds some evidence from notable events to the incident as entities or artifacts. If it misses any entities and artifact you need, or if you discover more relevant entities or artifacts as you investigate the timeline, add these entities or artifacts to the incident directly from the notable session.
When you update an incident with the relevant entities and artifacts, you can use them in playbooks to effectively triage, investigate, and respond to incidents.
You can only add Advanced Analytics evidence to an existing incident. You can't create a new incident directly from a notable session.
Navigate to an Advanced Analytics asset or user Smart Timeline:
To navigate from a Case Manager incident: navigate to the incident, find the Timeline Page incident field, then select Go to page.
To navigate to an asset Smart Timeline in Advanced Analytics: On the HOME page, find the NOTABLE ASSETS watchlist or other watchlist you created, then select an asset's risk score. Or, from a watchlist, select the asset's name, then under RISK REASONS click GO TO TIMELINE.
To navigate to a user Smart Timeline in Advanced Analytics: On the HOME page, find the NOTABLE USERS, Account Lockouts, Executive Users, or other watchlist you created, then select a user's risk score. Or, from a watchlist, select the user's name, then under RISK REASONS click GO TO TIMELINE.
Search for a user or asset, select from the results, then under RISK REASONS click GO TO TIMELINE.
Select an event in the Smart Timeline. The event expands to review further details.
Click the More
 menu, then click Add to Incident.
Select a Case Manager incident from your list of most recent assigned incidents, or to search for a specific incident, start typing. If you navigated directly from a Case Manager incident, this field is automatically populated.
Select the entities and/or artifacts. To create all the entities or artifacts, select the first checkbox.
Select ADD TO INCIDENT.
