- Advanced Analytics
- Understand the Basics of Advanced Analytics
- Deploy Exabeam Products
- Considerations for Installing and Deploying Exabeam Products
- Things You Need to Know About Deploying Advanced Analytics
- Pre-Check Scripts for an On-Premises or Cloud Deployment
- Install Exabeam Software
- Upgrade an Exabeam Product
- Add Ingestion (LIME) Nodes to an Existing Advanced Analytics Cluster
- Apply Pre-approved CentOS Updates
- Configure Advanced Analytics
- Set Up Admin Operations
- Access Exabeam Advanced Analytics
- A. Supported Browsers
- Set Up Log Management
- Set Up Training & Scoring
- Set Up Log Feeds
- Draft/Published Modes for Log Feeds
- Advanced Analytics Transaction Log and Configuration Backup and Restore
- Configure Advanced Analytics System Activity Notifications
- Exabeam Licenses
- Exabeam Cluster Authentication Token
- Set Up Authentication and Access Control
- What Are Accounts & Groups?
- What Are Assets & Networks?
- Common Access Card (CAC) Authentication
- Role-Based Access Control
- Out-of-the-Box Roles
- Set Up User Management
- Manage Users
- Set Up LDAP Server
- Set Up LDAP Authentication
- Third-Party Identity Provider Configuration
- Azure AD Context Enrichment
- Set Up Context Management
- Custom Context Tables
- How Audit Logging Works
- Starting the Analytics Engine
- Additional Configurations
- Configure Static Mappings of Hosts to/from IP Addresses
- Associate Machine Oriented Log Events to User Sessions
- Display a Custom Login Message
- Configure Threat Hunter Maximum Search Result Limit
- Change Date and Time Formats
- Set Up Machine Learning Algorithms (Beta)
- Detect Phishing
- Restart the Analytics Engine
- Restart Log Ingestion and Messaging Engine (LIME)
- Custom Configuration Validation
- Advanced Analytics Transaction Log and Configuration Backup and Restore
- Reprocess Jobs
- Re-Assign to a New IP (Appliance Only)
- Hadoop Distributed File System (HDFS) Namenode Storage Redundancy
- User Engagement Analytics Policy
- Configure Settings to Search for Data Lake Logs in Advanced Analytics
- Enable Settings to Detect Email Sent to Personal Accounts
- Configure Smart Timeline™ to Display More Accurate Times for When Rules Triggered
- Configure Rules
- Exabeam Threat Intelligence Service
- Threat Intelligence Service Prerequisites
- Connect to Threat Intelligence Service through a Proxy
- View Threat Intelligence Feeds
- Threat Intelligence Context Tables
- View Threat Intelligence Context Tables
- Assign a Threat Intelligence Feed to a New Context Table
- Create a New Context Table from a Threat Intelligence Feed
- Check ExaCloud Connector Service Health Status
- Disaster Recovery
- Manage Security Content in Advanced Analytics
- Exabeam Hardening
- Set Up Admin Operations
- Health Status Page
- Troubleshoot Advanced Analytics Data Ingestion Issues
- Generate a Support File
- View Version Information
- Syslog Notifications Key-Value Pair Definitions
Configure Advanced Analytics
This section includes everything administrators need to know for setting up and operating Advanced Analytics.
Set Up Admin Operations
Everything administrators need to know about setting up and operating Advanced Analytics.
Access Exabeam Advanced Analytics
Navigate, log in, and authenticate into your Advanced Analytics environment.
If you have an hardware or virtual deployment of Advanced Analytics, enter the IP address of the server and port number 8484:
https://<IP_address]:8484 or https://<IP_address>:8484/uba
If you have the SaaS deployment of Advanced Analytics, navigate to https://[company].aa.exabeam.com.
Use your organization credentials to log into your Advanced Analytics product.
These login credentials were established when Advanced Analytics was installed. You can authenticate into Advanced Analytics using LDAP, SAML, CAC, or SSO through Okta. To configure and enable these authentication types, contact your Technical Account Manager.
If you work for a federal agency, you can authenticate into Advanced Analytics using Common Access Card (CAC). United States government personnel use the CAC to access physical spaces, computer networks, and systems. You have readers on your workstations that read your Personal Identity Verification (PIV) and authenticate you into various network resources.
You can authenticate into Advanced Analytics using CAC combined with another authentication mechanism. To configure and and enable other authentication mechanisms, contact your Technical Account Manager.
Set Up Log Management
Note
The log management setup description in this section applies to Advanced Analytics versions i60–i62.
Large enterprise environments generally include many server, network, and security technologies that can provide useful activity logs to trace who is doing what and where. Log ingestion can be coupled with your Data Lake data repository, that can forward syslogs to Advanced Analytics. (See Data Lake Administration Guide > Syslog Forwarding to Advanced Analytics.)
Use the Log Ingestion Settings page to configure the following log sources:
Note
The Syslog destination is your site collector IP/FQDN, and only TLS connections are accepted in port TCP/515.
|
|
View Insights About Syslog Ingested Logs
Advanced Analytics has the ability to test the data pipeline of logs coming in via Syslog.
Note
This option is only available if the Enable Syslog Ingestion button is toggled on.
Click the Syslog Stats button to view the number of logs fetched, the number of events parsed, and the number of events created. A warning will also appear that lists any event types that were not created within the Syslog feed that was analyzed.
In this step you can also select Options to limit the time range and number of log events tested.
Ingest Logs from Google Cloud Pub/Sub into Advanced Analytics
To create events from Google Cloud Pub/Sub topics, configure Google Pub/Sub as an Advanced Analytics log source.
Create a Google Cloud service account with Pub/Sub Publisher and Pub/Sub Subscriber permissions.
Create and download a JSON-type service account key. You use this JSON file later.
Create a Google Cloud Pub/Sub topic with Google-managed key encryption.
For the Google Cloud Pub/Sub topic you created, create a subscription with specific settings:
Delivery type – Select Pull.
Subscription expiration – Select Never expire.
Retry policy – Select Retry immediately.
Save the subscription ID to use later.
In the navigation bar, click the menu
 , select Settings, then select Analytics.
Under Log Management, select Log Ingestion Settings.
Click ADD, then from the Source Type list, select Google Cloud Pub/Sub.
Enter information about your Google Cloud Pub/Sub topic:
Description – Describe the topic, what kinds of logs you're ingesting, or any other information helpful for you to identify this as a log source.
Service key – Upload the Google Cloud service account key JSON file you downloaded.
Subscriptions
Subscription name – Enter the Google Cloud Pub/Sub subscription ID you created.
Description – Describe the subscription, to which Google Cloud Pub/Sub topic it was created, or what messages it receives.
To verify the connection to your Google Cloud Pub/Sub topic, click TEST CONNECTION. If you see an error, verify the information you entered then retest the connection.
Click SAVE.
Restart Log Ingestion and Messaging Engine (LIME).
To ingest specific logs from your Google Cloud Pub/Sub topic, configure a log feed.
Set Up Training & Scoring
To build a baseline, Advanced Analytics extensively profiles the people, asset usage, and sessions. For example, in a typical deployment, Advanced Analytics begins by examining typically 60-90 days of an organization's logs. After the initial baseline analysis is done, Advanced Analytics begins assigning scores to each session based on the amount and type of anomalies in the session.
Set Up Log Feeds
Note
The log feed setup information in this section applies to Advanced Analytics versions i60–i62.
Advanced Analytics can be configured to fetch log data from a SIEM. Administrators can configure log feeds that can be queried during ingestion. Exabeam provides out-of-the-box queries for various log sources; or you can edit them and apply your own.
Once the log feed is setup, you can perform a test query that fetches a small sample of logs from the log management system. You can also parse the sample logs to make sure that Advanced Analytics is able to normalize the logs. If the system is unable to parse the logs, reach out to Customer Success and the Exabeam team will create a parser for those logs.
Draft/Published Modes for Log Feeds
Note
The information in this section applies to Advanced Analytics versions i60–i62.
There are two different modes when it comes to adding log feeds under Settings > Log Feeds. When you create a new log feed and complete the workflow you will be asked if you would like to publish the feed. Publishing the feed lets the Analytics Processing Engine know that the respected feed is ready for consumption.
If you choose to not publish the feed then it will be left in draft mode and will not be picked up by the processing engine. You can always publish a feed that is in draft mode at a later time.
This allows you to add multiple feeds and test queries without worrying about the feed being picked up by the processing engine or having the processing engine encounter errors when a draft feed is deleted.
Once a feed is in published mode it will be picked up by the processing engine at the top of the hour.
Advanced Analytics Transaction Log and Configuration Backup and Restore
Hardware and Virtual Deployments Only
Rebuilding a failed worker node host (from a failed disk for on on-premise appliance) or shifting a worker node host to new resources takes significant planning. One of the more complex steps and most prone to error is migrating the configurations. Exabeam has provide a backup mechanism for layered data format (LDF) transaction log and configuration files to minimize the risk of error. To use the configuration backup and restore feature, you must have:
An active Advanced Analytics worker node
Cluster with two or more worker nodes
Have read and write permission for the credentials you will configure to access the base path at the storage destination
A scheduled task in Advanced Analytics to run backup to the storage destination
Note
To rebuild after a cluster failure, it is recommended that a cloud-based backups be used. To rebuild nodes from disk failures, backup files to a worker node or cloud-based destination.
Warning
Master nodes cannot be backed up and restored. Only worker nodes.
If you want to save the generate backup files to your first worker node, then no further configuration is needed to configure an external storage destination. A worker node destination addresses possible disk failure at the master node appliance. This is not recommended as the sole method for disaster recovery.
Go to Settings > Additional Settings > Admin Operations > External Storage.
Click Add.
Fill all fields and then click TEST CONNECTION to verify connection credentials.
Once a working connection is confirmed Successful, click SAVE.
Once you have a verified destination to store your files, configure and schedule a recurring backup.
Go to Settings > Additional Settings > Backup & Restore > Backups.
Click CREATE BACKUP to generate a new schedule record. If you are changing the destination, click the edit icon
 on the displayed record.
Fill all fields and then click SAVE to apply the configuration.
Warning
Time is given in UTC.
A successful backup will place a backup.exa file at /opt/exabeam/data/backup at the worker node. In the case that the scheduled backup fails to write files to the destination, confirm there is enough space at the destination to hold the files and that the exabeam-web-common service is running. (If exabeam-web-common is not running, review its application.log for hints as to the possible cause.)
In order to restore a node host using files store off-node, you must have:
administrator privileges to run tasks a the host
SSH access to the host
free space at the restoration partition at the master node host that is greater than 10 times the size of
backup.exabackup file
Copy the backup file,
backup.exa, from the backup location to the restoration partition. This should be a temporary work directory (<restore_path>) at the master node.Run the following to unpack the EXA file and repopulate files.
sudo /opt/exabeam/bin/tools/exa-restore <restore_path>/backup.exa
exa-restorewill stop all services, restore files, and then start all services. Monitor the console output for error messages. See Troubleshooting a Restoration ifexa-restoreis unable to run to completion.Remove
backup.exaand the temporary work directory when restoration is completed.
If restoration does not succeed, the try following below solutions. If the scenarios listed do not match your situation,
Not Enough Disk Space
Select a different partition to restore the configuration files to and try to restore again. Otherwise, review files stored in to target destination and offload files to create more space.
Restore Script Cannot Stop All Services
Use the following to manually stop all services:
source /opt/exabeam/bin/shell-environment.bash && everything-stop
Restore Script Cannot Start All Services
Use the following to manually start all services:
source /opt/exabeam/bin/shell-environment.bash && everything-start
Restore Script Could Not Restore a Particular File
Use tar to manually restore the file:
# Determine the task ID and base directory (<base_dir>) for the file restoration that failed.
# Go to the <base_id>/<task_id> directory and apply following command:
sudo tar -xzpvf backup.tar backup.tgz -C <baseDir>

# Manually start all services.
source /opt/exabeam/bin/shell-environment.bash && everything-start
Configure Advanced Analytics System Activity Notifications
Configure Advanced Analytics to send notifications to your log repository or email about system health, notable sessions, anomalies, and other important system information.
Depending on the format in which you want information about your system, send notifications to your log repository or email.
Advanced Analytics sends notifications to your log repository in a structured data format using Syslog. These notifications are formatted so machines, like your log repository, can easily understand them.
Advanced Analytics sends notifications to your email in a format that's easier to read for humans.
Send Notifications to your Log Repository, Log Ticketing System, or SIEM
Send notifications to your log repository, log ticketing system, or SIEM using the Syslog protocol.
In the navigation bar, click the menu
 , select Settings, then select Core.
Under NOTIFICATIONS, select Setup Notifications.
Click add
 , then select Syslog Notification.
Configure your notification settings:
IP / Hostname – Enter the IP or host name of your Syslog server.
Port – Enter the port your Syslog server uses.
Protocol – Select the network protocol your Syslog server uses to send messages: TCP, SSL_TCP, or UDP.
Syslog Security Level – Assign a severity level to the notification:
Informational – Normal operational events, no action needed.
Debug – Useful information for debugging, sent after an error occurs.
Error – An error has occurred and must be resolved.
Warning – Events that will lead to an error if you don't take action.
Emergency – Your system is unavailable and unusable.
Alert – Events that should be corrected immediately.
Notice – An unusual event has occured.
Critical – Some event, like a hard device error, has occurred and your system is in critical condition.
Notifications by Product – Select the events for which you want to be notified:
System Health – All system health alerts for Advanced Analytics.
Notable Sessions – A user or asset has reached a risk threshold and become notable. This notification describes which rule was triggered and contains any relevant event details, which are unique to each event type. If an event detail isn't available, it isn't included in the notification.
Anomalies – A rule has been triggered.
AA/CM/OAR Audit – An Exabeam user does something in Advanced Analytics, Case Manager, or Incident Responder that's important to know when auditing their activity history; for example, when someone modifies rule behaviour, changes log sources, or changes user roles and permissions.
Job Start – Data processing engines, like Log Ingestion and Messaging Engine (LIME) or the Analytics Engine, have started processing a log.
Job End – Data processing engines, like LIME or the Analytics Engine, have stopped processing a log.
Job Failure – Data processing engines, like LIME or the Analytics Engine, have failed to process a log.
Click ADD NOTIFICATION.
Restart the Analytics Engine.
Send Notifications to Your Email
To get human-friendly notifications, configure email notifications.
Some Incident Responder actions also send email notifications, including:
Notify User By Email Phishing
Phishing Summary Report
Send Email
Send Template Email
Send Indicators via Email
If you configure these settings correctly, Incident Responder uses IRNotificationSMTPService as the service for these actions. If you configure these settings incorrectly, these actions won't work correctly.
In the navigation bar, click the menu
 , select Settings, then select Core.
Under NOTIFICATIONS, select Setup Notifications.
Click add
 , then select Email Notification.
Configure your notification settings:
IP / Hostname – Enter the IP or hostname of your outgoing mail server.
Port – Enter the port number for your outgoing mail server.
SSL – Select if your mail server uses Secure Sockets Layer (SSL) protocol.
Username Required – If your mail server requires a username, select the box, then enter the username.
Password Required – If your mail server requires a password, select the box, then enter the password.
Sender Email Address – Enter the email address the email is sent from.
Recipients – List the email addresses to receive these email notifications, separated by a comma.
E-mail Signature – Enter text that's automatically added to the end of all email notifications.
Notifications by Product – Select the events for which you want to be notified.
Incident Responder:
System Health – All system health alerts for Case Manager and Incident Responder.
Advanced Analytics:
System Health – All system health alerts for Advanced Analytics.
Notable Sessions – A user or asset has reached a risk threshold and become notable. This notification describes which rule was triggered and contains any relevant event details, which are unique to each event type. If an event detail isn't available, it isn't included in the notification.
Anomalies – A rule has been triggered.
AA/CM/OAR Audit – An Exabeam user does something in Advanced Analytics, Case Manager, or Incident Responder that's important to know when auditing their activity history; for example, when someone modifies rule behaviour, changes log sources, or changes user roles and permissions.
Job Start – Data processing engines, like Log Ingestion and Messaging Engine (LIME) or the Analytics Engine, have started processing a log.
Job End – Data processing engines, like LIME or the Analytics Engine, have stopped processing a log.
Job Failure – Data processing engines, like LIME or the Analytics Engine, have failed to process a log.
Click ADD NOTIFICATION.
Exabeam Licenses
Exabeam products require a license in order to function. These licenses determine which Exabeam products and features you can use. You are not limited by the amount of external data you can ingest and process.
There are multiple types of Exabeam product licenses available. Exabeam bundles these licenses together and issues you one key to activate all purchased products. For more information on the different licenses, see Types of Exabeam Product Licenses.
License Lifecycle
When you first install Exabeam, the installed instance uses a 30 day grace period license. This license allows you to try out all of the features in Exabeam for 30 days.
Grace Period
Exabeam provides a 30-day grace period for expired licenses before products stop processing data. During the grace period, you will not experience any change in product functionality. There is no limit to the amount of data you can ingest and process.
When the license or grace period is 14 days away from expiring, you will receive a warning alert on the home page and an email.
You can request a new license by contacting your Exabeam account representative or by opening a support ticket.
Expiration Period
When your grace period has ended, you will start to experience limited product functionality. Please contact your Exabeam representative for a valid license and restore all product features.
For Advanced Analytics license expirations, the Log Ingestion Engine will continue to ingest data, but the Analytics Engine will stop processing. Threat Hunter and telemetry will also stop working.
You will receive a critical alert on the home page and an email.
License Alerts
License alerts are sent via an alert on the home page and in email when the license or grace period is 14 days away from expiring and when the grace period expires.
The home page alert is permanent until resolved. You must purchase a product license or renew your existing license to continue using Exabeam.
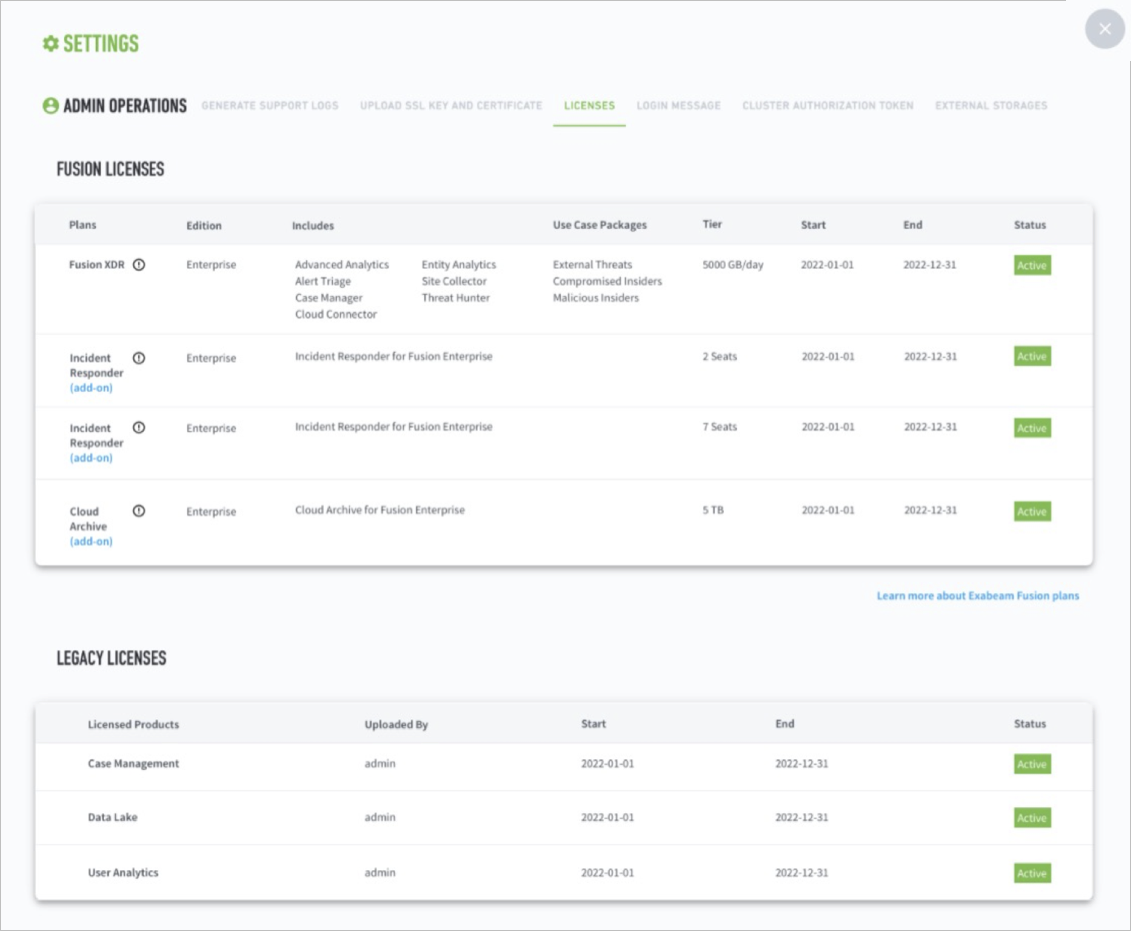
To check the status and details of your license, go to Settings  > Admin Operations > Licenses.
License Versions
Currently, Exabeam has three versions of our product licenses (V1, V2, and V3). License versions are not backward compatible. If you are upgrading from Advanced Analytics I41 / or earlier you must apply the V3 license version. The table below summarizes how the different license versions are designed to work:
V1 | V2 | V3 | |
|---|---|---|---|
Products Supported |
|
|
|
Product Version | Advanced Analytics I38 and below | Advanced Analytics I41 | Advanced Analytics I46 and above Data Lake I24 and above |
Uses unique customer ID | No | No | Yes |
Federal License Mode | No | No | Yes |
Available to customers through the Exabeam Community | No | No | Yes |
Licensed enforced in Advanced Analytics | Yes | Yes | Yes |
Licensed enforced in Data Lake | NA | NA | No |
Applied through the UI | No, the license must be placed in a path in Tequila | No, the license must be placed in a path in Tequila | Yes |
Note
Licenses for Advanced Analytics I46 / and later must be installed via the GUI on the license management page.
Types of Exabeam Product Licenses
Exabeam licenses specify which products you have access to and for how long. We bundle your product licenses together into one license file. All products that fall under your Exabeam platform share the same expiration dates.
Advanced Analytics product licenses:
User Analytics – This is the core product of Advanced Analytics . Exabeam’s user behavioral analytics security solution provides modern threat detection using behavioral modeling and machine learning.
Threat Hunter – Threat Hunter is a point and click advanced search function which allows for searches across a variety of dimensions, such as Activity Types, User Names, and Reasons. It comes fully integrated with User Analytics.
Exabeam Threat Intelligence Services (TIS) – TIS provides real-time actionable intelligence into potential threats to your environment by uncovering indicators of compromise (IOC). It comes fully integrated with the purchase of an Advanced Analytics V3 license. TIS also allows access to telemetry.
Entity Analytics (EA) – Entity Analytics offers analytics capabilities for internet-connected devices and entities beyond users such as hosts and IP addresses within an environment.
Entity Analytics is available as an add-on option. If you are adding Entity Analytics to your existing Advanced Analytics platform, you will be sent a new license key. Note that you may require additional nodes to process asset oriented log sources.
Incident Responder – Also known as Orchestration Automation Response. Incident Responder adds automation to your SOC to make your cyber security incident response team more productive.
Incident Responder is available as an add-on option. If you are adding Incident Responder to your existing Advanced Analytics platform, you will be sent a new license key. Note that you may require additional nodes to support automated incident responses.
Case Manager – Case Manager can fully integrate into Advanced Analytics enabling you to optimize analyst workflow by managing the life cycle of your incidents.
Case Manager is available as an add-on option. If you are adding Case Manager to your existing Advanced Analytics platform, you will be sent a new license key. Note that you may require additional nodes to support this module extension.
After you have purchased or renewed your product licenses, proceed to Download a License.
Download an On-premises or Cloud Exabeam License
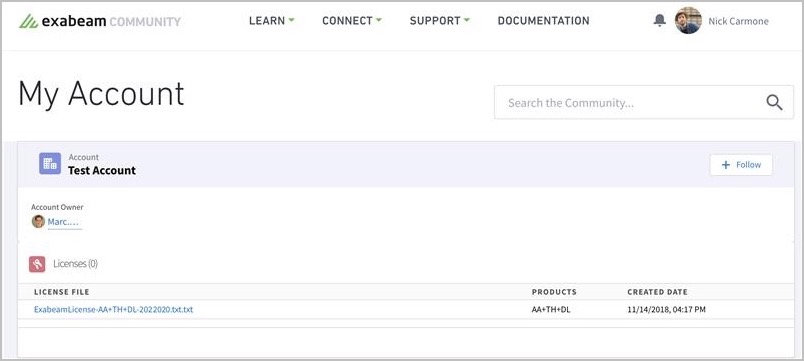
You can download your unique customer license file from the Exabeam Community.
To download your Exabeam license file:
Log into the Exabeam Community with your credentials.
Click on your username.
Click on My Account.
Click on the text file under the License File section to start the download
After you have downloaded your Exabeam license, proceed to Apply a License.
Exabeam Cluster Authentication Token
The cluster authentication token is used to verify identities between clusters that have been deployed in phases as well as HTTP-based log collectors. Each peer cluster in a query pool must have its own token. You can set expiration dates during token creation or manually revoke tokens at any time.
Note
This operation is not supported for Data Lake versions i40.2 through i40.5. For i40.6 and higher, please see the Contents of the exabeam-API-docs.zip file section of the following document: Exabeam Saas API Documentation.
To generate a token:
Go to Settings > Core > Admin Operations > Cluster Authentication Token.
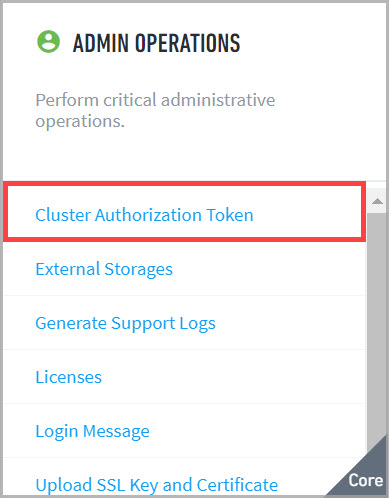
The Cluster Authorization Token page appears.

Click
 .
.The Setup Token dialog box appears.
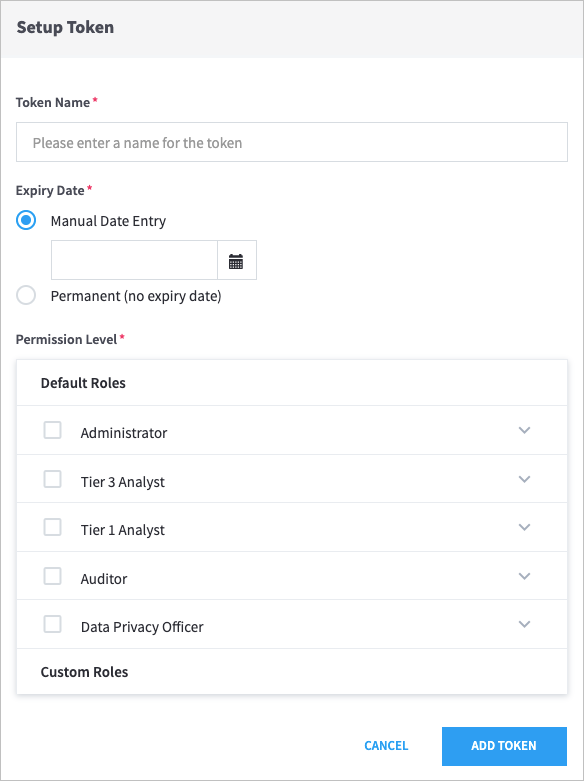
Enter a Token Name, and then select an Expiry Date.
Important
Token names can contain only letters, numbers, and spaces.
Select the Default Roles for the token.
Click Add Token.
Use this generated file to allow your API(s) to authenticate by token. Ensure that your API uses
ExaAuthTokenin its requests. For curl clients, the request structure resembles the following:curl -H "ExaAuthToken:<generated_token>" https://<external_host>:<api_port>/<api_request_path>
Set Up Authentication and Access Control
What Are Accounts & Groups?
Peer Groups
Peer groups can be a team, department, division, geographic location, etc. and are defined by the organization. Exabeam uses this information to compare a user's behavior to that of their peers. For example, when a user logs into an application for the first time Exabeam can evaluate if it is normal for a member of their peer group to access that application. When Dynamic Peer Grouping is enabled, Exabeam will use machine learning to choose the best possible peer groups for a user for different activities based on the behaviors they exhibit.
Executives
Exabeam watches executive movements very closely because they are privileged and have access to sensitive and confidential information, making their credentials highly desirable for account takeover. Identifying executives allows the system to model executive assets, thereby prioritizing anomalous behaviors associated with them. For example, we will place a higher score for an anomaly triggered by a non-executive user accessing an executive workstation.
Service Accounts
A service account is a user account that belongs to an application rather than an end user and runs a particular piece of software. During the setup process, we work with an organization to identify patterns in service account labels and uses this information to classify accounts as service accounts based on their behavior. Exabeam also adds or removes points from sessions based on service account activity. For example, if a service account logs into an application interactively, we will add points to the session because service accounts should not typically log in to applications.
What Are Assets & Networks?
Workstations & Servers
Assets are computer devices such as servers, workstations, and printers. During the setup process, we will ask you to review and confirm asset labels. It is important for Exabeam to understand the asset types within the organization - are they Domain Controllers, Exchange Servers, Database Servers or workstations? This adds further context to what Exabeam sees within the logs. For example, if a user performs interactive logons to an Exchange Server on a daily basis, the user is likely an Exchange Administrator. Exabeam automatically pulls in assets from the LDAP server and categorizes them as servers or workstations based on the OS property or the Organizational Units they belong to. In this step, we ask you to review whether the assets tagged by Exabeam are accurate. In addition to configuration of assets during setup, Exabeam also runs an ongoing classifier that classifies assets as workstations or servers based on their behavior.
Network Zones
Network zones are internal network locations defined by the organization rather than a physical place. Zones can be cities, business units, buildings, or even specific rooms. For example, "Atlanta" can refer to a network zone within an organization rather than the city itself (all according to an organization's preference). Administrators can upload information regarding network zones for their internal assets via CSV or add manually one at a time.
Asset Groups
Asset Groups are a collection of assets that perform the same function in the organization and need to be treated as a single entity from an anomaly detection perspective. An example of an asset group would be a collection of Exchange Servers. Grouping them this way is useful to our modeling processing because it allows us to treat an asset group as a single entity, reducing the amount of false positives that are generated when users connect to multiple servers within that group. As a concrete example, if a user regularly connects to email exchange server #1 then Exabeam builds a baseline that says this is their normal behavior. But exchange servers are often load-balanced, and if the user then connects to email exchange server #2 we can say that this is still normal behavior for them because the exchange servers are one Asset Group. Other examples of asset groups are SharePoint farms, or Virtual Desktop Infrastructure (VDI).
Common Access Card (CAC) Authentication
Exabeam supports Common Access Card (CAC) authentication. CAC is the principal card used to enable physical spaces, and it provides access to computer networks and systems. Analysts have CAC readers on their workstations to read their Personal Identity Verification (PIV) credentials and authenticate them to use various network resources.
Note the following restrictions:
Configure CAC users that are authorized to access Exabeam from the Exabeam User Management page.
During the user provisioning, the CAC analysts must be assigned roles. The roles associated with a CAC user will be used for authorization when they login.
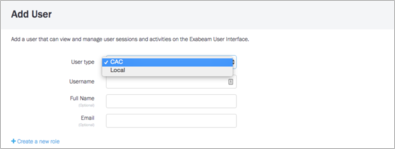 Figure 1. Add User menu
Configure Client Certificates
Retrieve your
ca.pemfile to/home/exabeamdirectory at the master node.Run the following commands on the master node (note that an alias of
cacbundleis applied to the certificate being installed):source /opt/exabeam/bin/shell-environment.bash docker cp ca.pem exabeam-web-common:/ docker exec exabeam-web-common:/ keytool -import -trustcacerts -alias cacbundle -file ca.pem -keystore /opt/exabeam/web-common/config/custom/truststore.jks -storepass changeit -noprompt
Note
With
docker exec exabeam-web-common,exabeam-web-commondoes not resolve to the docker container. As a result, you must query docker ps and find the container ID or use–name exabeam-web-common.Note
If you need to remove the alias, use the following command:
docker exec -it exabeam-web-common keytool -delete -alias cacbundle
Located in
/opt/exabeam/config/common/web/custom/application.conf, thesslClientAuthflag must be set totrue, as shown in the following example:webcommon { service { interface = "0.0.0.0" #hostname = "<hostname>" port = 8484 https = true sslKeystore = "$EXABEAM_HOME/config/custom/keystore.jks" sslKeypass = "password" # The following property enables Two-Way Client SSL Authentication sslClientAuth = trueTo install client certificates for CAC, add the client certificate bundle to the trust store on the master host.
To verify the contents of the trust store on the master host, run the following:
# For Exabeam Data Lake
sudo docker exec exabeam-web-common-host1 /bin/bash -c "keytool -list -v -keystore /opt/exabeam/config/custom/truststore.jks -storepass changeit"

# For Exabeam Advanced Analytics
 sudo docker exec exabeam-web-common /bin/bash -c "keytool -list -v -keystore /opt/exabeam/config/custom/truststore.jks -storepass changeit"
When you have completed the configuration changes, restart
web-common.source /opt/exabeam/bin/shell-environment.bash; web-common-restart
Configure a CAC User
To associate the credentials to a login, create a CAC user by navigating to Settings > Core > User Management > Users > Add User and select CAC in User type.
Ensure that the
usernamematches theCNattribute of the CAC user.If LDAP authentication is enabled, use LDAP group mapping to enable the users.
Configure an LDAP Server for CAC Authentication
To configure an Active Directory server for CAC authentication, follow the instructions in Set Up LDAP Server and Set Up LDAP Authentication for using Active Directory servers to manage CAC user access.
After LDAP is configured, the identity held by the Active Directory server is used to grant or deny CAC card access to Exabeam.
Delete a CAC User Account
CAC user accounts are deleted by removing the users from the Mongo database.
As the Exabeam user, source the environment.
$ sos
Find the user that you want to delete by running the following command (replacing
<userid>with the user's ID):mongo --quiet exabeam_user_db --eval 'db.exabeam_user_collection.find({_id:"<userid>"})'The output is similar to the following:
{ "_id" : "johndoe", "email" : "", "password" : "6008c8a26014989270343e9bb40548360a400a425523cc3636954dac33f", "passwordReset" : false, "roles" : [ ], "passwordLastChanged" : NumberLong("1427907776669"), "lastLoginAt" : NumberLong(0), "failedLoginCount" : 0, "fromLDAP" : false, "passwordHistory" : [ { "hashAlgorithm" : "sha256", "password" : "6008c8a26014989270343e9bb40548360a400a425523cc3636954dac33f", "salt" : "[B@3bd37f64" } ], "salt" : "[B@3bd37f64", "hashAlgorithm" : "sha256" }Note
If you do not receive output, it indicates that the user does not exist in the database. Make sure that you entered the ID correctly and run the command again.
To delete the user, run the following command:
mongo --quiet exabeam_user_db --eval 'db.exabeam_user_collection.remove({_id:"johndoe"})'If the user is successfully deleted, the output is as follows:
WriteResult({ "nRemoved" : 1 })Note
If you do not receive output, the user was not successfully deleted. Make sure that you entered the ID correctly and run the command again. Refresh the page in the UI to confirm that the user is deleted from the user list.
Role-Based Access Control
You can control the responsibilities and activities of your SOC team members with Role-Based Access Control (RBAC). To tailor access, you can assign local users, LDAP users, or SAML authenticated users one or more roles within Exabeam.
The responsibilities of those roles are determined by the permissions the role allows. If users are assigned more than one role, that user receives the permissions of each role.
Note
If a user is assigned multiple roles with conflicting permissions, Exabeam enforces the role having more permission. For example, if a role with read-only permissions and a role with full permission are both assigned to a user, then the user will have full permission.
To access the Roles page, navigate to Settings > User Management > Roles.
Out-of-the-Box Roles
Advanced Analytics provides five out-of-the-box pre-configured roles:
This role is intended for administrative access to Exabeam. Users assigned to this role can perform administrative operations on Exabeam, such as configuring the appliance to fetch logs from the SIEM, connecting to Active Directory to pull in contextual information, and restarting the analytics engine. The default admin credential belongs to this role. This is a predefined role provided by Exabeam and cannot be deleted.
Default permissions include:
Permission | Description |
|---|---|
Manage Users and Context Sources | Manage users and roles in the Exabeam Security Intelligence Platform, as well as the context sources used to enhanced the logs ingested (e.g. assets, peer groups, service accounts, executives). |
Manage context tables | Manage users, assets or other objects within Context Tables. |
Manage Content Packages | Users add/remove/configure content packages for automatic installation. |
View Metrics | View the IR Metrics page. |
Manage Data Ingest | Configure log sources and feeds and email-based ingest. |
Add IR comments | Add IR comments. |
Upload Custom Services | Upload custom actions or services. |
Create incidents | Create incidents. |
Delete incidents | Delete incidents. |
Manage Custom Services and Packages | User can manage custom services and related packages |
Manage Data Ingest | Configure log sources and feeds and email-based ingest. |
Manage ingest rules | Add, edit, or delete rules for how incidents are assigned, restricted, and prioritized on ingest. |
Manage Queues | Create, edit, delete, and assign membership to queues |
Manage Templates | Create, edit, or delete playbook templates. |
Manage Triggers | Create, update, or delete playbook triggers. |
Run Actions | Launch individual actions from the user interface. |
Manage Bi-directional Communication | Configure inbound and outbound settings for Bi-Directional Communications. |
Manage Incident Configuration | Users can manage the Incident Configurations including Incident Types, Fields, Layouts, and Checklists. |
Manage Playbooks | Create, update, or delete playbooks. |
Manage Services | Configure, edit, or delete services (3rd party integrations). |
Run Playbooks | Run a playbook manually from the workbench. |
Reset Incident Workbench | User can reset incident workbench |
All Admin Ops | Perform all Exabeam administrative operations such as configuring the appliance, connecting to the log repository and Active Directory, setting up log feeds, managing users and roles that access the Exabeam UI, and performing system health checks. |
View comments | View comments. |
View health | View health. |
View Raw Logs | View the raw logs that are used to built the events on AA timeline |
View Rules | View configured rules that determine how security events are handled |
View API | View API. |
View incidents | View incidents. |
View Metrics | View the IR Metrics page. |
Edit incidents | Edit an incident's fields, edit tasks, entities & artifacts. |
Manage Rules | Create/Edit/Reload rules that determine how security events are handled |
Bulk edit | Users can edit multiple incidents at the same time. |
Search Incidents | Can search keywords in IR via the search bar. |
Basic Search | Perform basic search on the Exabeam homepage. Basic search allows you to search for a specific user, asset, session, or a security alert. |
Users assigned to this role have only view privileges within the Exabeam UI. They can view all activities within the Exabeam UI, but cannot make any changes such as add comments or approve sessions. This is a predefined role provided by Exabeam.
Default permissions include:
Permission | Description |
|---|---|
View Comments | View comments |
View Activities | View all notable users, assets, sessions, and related risk reasons in the organization. |
View Global Insights | View the organizational models built by Exabeam. The histograms that show the normal behavior for all entities in the organization can be viewed. |
View Executive Info | View the risk reasons and the timeline of the executive users in the organization. You will be able to see the activities performed by executive users along with the associated anomalies. |
View Incidents | View incidents. |
View Infographics | View all the infographics built by Exabeam. You will be able to see the overall trends for the organization. |
View Insights | View the normal behaviors for specific entities within the organization. The histograms for specific users and assets can be viewed. |
Search Incidents | Can search keywords in Incident Responder via the search bar. |
Basic Search | Perform basic search on the Exabeam homepage. Basic search allows you to search for a specific user, asset, session, or a security alert. |
View Search Library | View the Search Library provided by Exabeam and the corresponding search results associated with the filters. |
Threat Hunting | Perform threat hunting on Exabeam. Threat hunting allows you to query the platform across a variety of dimension such as find all users whose sessions contain data exfiltration activities or a malware on their asset. |
Users assigned to this role are junior security analysts or incident desk responders who supports the day-to-day enterprise security operation and monitoring. This type of role will not be authorized to make any changes to Exabeam system except for making user, session and lockout comments. Users in this role cannot approve sessions or lockout activities. This is a predefined role provided by Exabeam.
Default permissions include:
Permission | Description |
|---|---|
Add Advanced Analytics Comments | Add comments for the various entities (users, assets and sessions) within Exabeam. |
Add Incident Responder Comments | Add Incident Responder comments. |
Create Incidents | Create incidents. |
Run Playbooks | Run a playbook manually from the workbench. |
Run Actions | Launch individual actions from the user interface. |
View comments | View comments. |
View Global Insights | View the organizational models built by Exabeam. The histograms that show the normal behavior for all entities in the organization can be viewed. |
View incidents | View incidents. |
View Infographics | View all the infographics built by Exabeam. You will be able to see the overall trends for the organization. |
View Activities | View all notable users, assets, sessions and related risk reasons in the organization. |
View Executive Info | View the risk reasons and the timeline of the executive users in the organization. You will be able to see the activities performed by executive users along with the associated anomalies. |
View Insights | View the normal behaviors for specific entities within the organization. The histograms for specific users and assets can be viewed. |
Users assigned to this role will be performing more complex investigations and remediation plans. They can review user sessions, account lockouts, add comments, approve activities and perform threat hunting. This is a predefined role provided by Exabeam and cannot be deleted.
Default permissions include:
Permission | Description |
|---|---|
Add Advanced Analytics Comments | Add comments for the various entities (users, assets and sessions) within Exabeam. |
Add Incident Responder Comments | Add Incident Responder comments. |
Upload Custom Services | Upload custom actions or services. |
Create incidents | Create incidents. |
Delete incidents | Delete incidents. |
Manage Playbooks | Create, update, or delete playbooks. |
Manage Queues | Create, edit, delete, and assign membership to queues |
Manage Services | Configure, edit, or delete services (3rd party integrations). |
Manage Triggers | Create, update, or delete playbook triggers. |
Run Actions | Launch individual actions from the user interface. |
Manage Bi-directional Communication | Configure inbound and outbound settings for Bi-Directional Communications. |
Manage Data Ingest | Configure log sources and feeds and email-based ingest. |
Manage ingest rules | Add, edit, or delete rules for how incidents are assigned, restricted, and prioritized on ingest. |
Manage Templates | Create, edit, or delete playbook templates. |
Run Playbooks | Run a playbook manually from the workbench. |
View Activities | View all notable users, assets, sessions and related risk reasons in the organization. |
View Comments | View comments. |
View Executive Info | View the risk reasons and the timeline of the executive users in the organization. You will be able to see the activities performed by executive users along with the associated anomalies. |
View Global Insights | View the organizational models built by Exabeam. The histograms that show the normal behavior for all entities in the organization can be viewed. |
View Infographics | View all the infographics built by Exabeam. You will be able to see the overall trends for the organization. |
View Rules | View configured rules that determine how security events are handled. |
View Insights | View the normal behaviors for specific entities within the organization. The histograms for specific users and assets can be viewed. |
Bulk Edit | Users can edit multiple incidents at the same time. |
Delete entities and artifacts | Users can delete entities and artifacts. |
Manage Rules | Create/Edit/Reload rules that determine how security events are handled |
Manage Watchlist | Add or remove users from the Watchlist. Users that have been added to the Watchlist are always listed on the Exabeam homepage, allowing them to be scrutinized closely. |
Approve Lockouts | Accept account lockout activities for users. Accepting lockouts indicates to Exabeam that the specific set of behaviors for that lockout activity sequence are whitelisted and are deemed normal for that user. |
Accept Sessions | Accept sessions for users. Accepting sessions indicates to Exabeam that the specific set of behaviors for that session are whitelisted and are deemed normal for that user. WarningThis permission should be given only sparingly, if at all. Accepting sessions is not recommended. The best practice for eliminating unwanted alerts is through tuning the rules and/or models. |
Edit incidents | Edit an incident's fields, edit entities & artifacts. |
Sending incidents to Incident Responder | Send incidents to Incident Responder. |
Basic Search | Perform basic search on the Exabeam homepage. Basic search allows you to search for a specific user, asset, session, or a security alert. |
Search Incidents | Can search keywords in IR via the search bar. |
Threat Hunting | Perform threat hunting on Exabeam. Threat hunting allows you to query the platform across a variety of dimensions such as find all users whose sessions contain data exfiltration activities or a malware on their asset. |
Manage Search Library | Create saved searches as well as edit them. |
View Search Library | View the Search Library provided by Exabeam and the corresponding search results associated with the filters. |
This role is needed only when the data masking feature is turned on within Exabeam. Users assigned to this role are the only users that can view personally identifiable information (PII) in an unmasked form. They can review user sessions, account lockouts, add comments, approve activities and perform threat hunting. This is a predefined role provided by Exabeam.
See the section in this document titled Mask Data Within the Advanced Analytics UI on the next page for more information on this feature.
Default permissions include:
Permission | Description |
|---|---|
Add Advanced Analytics Comments | Add comments for the various entities (users, assets and sessions) within Exabeam. |
View comments | View comments. |
View Global Insights | View the organizational models built by Exabeam. The histograms that show the normal behavior for all entities in the organization can be viewed. |
View incidents | View incidents. |
View Infographics | View all the infographics built by Exabeam. You will be able to see the overall trends for the organization. |
View Activities | View all notable users, assets, sessions and related risk reasons in the organization. |
View Executive Info | View the risk reasons and the timeline of the executive users in the organization. You will be able to see the activities performed by executive users along with the associated anomalies. |
View Insights | View the normal behaviors for specific entities within the organization. The histograms for specific users and assets can be viewed. |
Manage Watchlist | Add or remove users from the Watchlist. Users that have been added to the Watchlist are always listed on the Exabeam homepage, allowing them to be scrutinized closely. |
Sending incidents to Incident Responder | Sending incidents to Incident Responder. |
Accept Sessions | Accept sessions for users. Accepting sessions indicates to Exabeam that the specific set of behaviors for that session are whitelisted and are deemed normal for that user. |
Basic Search | Perform basic search on the Exabeam homepage. Basic search allows you to search for a specific user, asset, session, or a security alert. |
Threat Hunting | Perform threat hunting on Exabeam. Threat hunting allows you to query the platform across a variety of dimensions such as find all users whose sessions contain data exfiltration activities or a malware on their asset. |
Manage Search Library | Create saved searches as well as edit them |
View Search Library | View the Search Library provided by Exabeam and the corresponding search results associated with the filters. |
View Unmasked Data (PII) | Show all personally identifiable information (PII) in a clear text form. When data masking is enabled within Exabeam, this permission should be enabled only for select users that need to see PII in a clear text form. |
Mask Data Within the Advanced Analytics UI
Note
To enable or disable and configure data masking, contact your Exabeam technical representative.
Note
Data masking is not supported in Case Management or Incident Responder modules.
Data masking within the UI ensures that personal data cannot be read, copied, modified, or removed without authorization during processing or use. With data masking enabled, the only user able to see a user's personal information will be users assigned to the permission "View Clear Text Data". The default role "Data Privacy Officer" is assigned this permission out of the box. Data masking is a configurable setting and is turned off by default.
To enable data masking in the UI, open /
opt/exabeam/config/tequila/custom/application.conf, and setdataMaskingEnabledtotrue.If your
application.confis empty, copy the following text and paste it into the file:tequila { PII { # Globally enable/disable data masking on all the PII configured fields. Default value is false. dataMaskingEnabled = true } }
You're able to fully customize which PII data is masked or shown in your deployment. The following fields are available when configuring PII data masking:
Default: This is the standard list of PII values controlled by Exabeam. If data masking is enabled, all of these fields are encrypted.
Custom: Encrypt additional fields beyond the default list by adding them to this custom list. The default is empty.
Excluded: Do not encrypt these fields. Adds that are in the default list to expose their values in your deployment. The default is empty.
For example, if you want to mask all default fields other than "task name" and also want to mask the "address" field, then you would configure the lists as shown below:
PII {
    # Globally enable/disable data masking on all the PII configured fields. Default value is false.
    dataMaskingEnabled = true
    dataMaskingSuffix = ":M"
    encryptedFields = {
        #encrypt fields
        event {
            default = [
                #EventFieldName
                "user",
                "account",
                ...
                "task_name"
            ]
            custom=["address"]
            excluded=["task_name"]
        }
        ...
    }
}
Mask Data for Notifications
You can configure Advanced Analytics to mask specific fields when sending notable sessions and/or anomalous rules via email, Splunk, and QRadar. This prevents exposure of sensitive data when viewing alerts sent to external destinations.
Note
Advanced Analytics activity log data is not masked or obfuscated when sent via Syslog. It is your responsibility to upload the data to a dedicated index which is available only to users with appropriate privileges.
Before proceeding through the steps below, ensure your deployment has:
Enabled data masking (instructions below)
Configured a destination for Notable Sessions notifications sent from Advanced Analytics via Incident Notifications
By default, all fields in a notification are unmasked. To enable data masking for notifications, the Enabled field needs to be set to true. This is located in the application.conf file in the path /opt/exabeam/config/tequila/custom.
NotificationRouter {
    ...
    Masking {
        Enabled = true
        Types = []
        NotableSessionFields = []
        AnomaliesRulesFields = []
    }
}
Use the Types field to add the notification destinations (Syslog, Email, QRadar, and/or Splunk). Then, use the NotableSessionFields and AnomaliesRulesFields to mask specific fields included in a notification.
For example, if you want to mask the user, source host and IP, and destination host and IP for notifications sent via syslog and Splunk, then you would configure the lists as shown below:
NotificationRouter {
    ...
    Masking {
        Enabled  = true
        Types = [Syslog, Splunk]
        NotableSessionFields = ["user", "src_host", "src_ip", "dest_host", "dest_ip"]

    }
}
Set Up User Management
Users are the analysts that have access to the Exabeam UI to review and investigate activity. These analysts also have the ability to accept sessions. Exabeam supports local authentication or authentication against an LDAP server.
Roles
Exabeam supports role-based access control. Under Default Roles are the roles that Exabeam has created; these cannot be deleted or modified. Selecting a role displays the permissions associated with that role.
Users can also create custom roles by selecting Create a New Role. In this dialogue box you will be asked to name the role and select the permissions associated with it.
Add a User Role
Exabeam's default roles include Administrator, Auditor, and Tier (1 and 3) Analyst. If you do not want to use these default roles or edit their permissions, create ones that best suit your organization.
To add a new role:
Navigate to Settings > Exabeam User Management > Roles.
Click Create Role.
Fill the Create a new role fields and click SAVE. The search box allows you to search for specific permissions.
Your newly created role should appear in the Roles UI under Custom Roles and can be assigned to any analyst.
To start assigning users to the role, select the role and click Next, which will direct you to the Users UI to edit user settings. Edit the configuration for the users you wish to add the role to and click Next to apply the changes.
Supported Permissions
Administration
All Admin Ops: Perform all Exabeam administrative operations such as configuring the appliance, connecting to the log repository and Active Directory, setting up log feeds, managing users and roles that access the Exabeam UI, and performing system health checks.
Manage Users and Context Sources: Manage users and roles in the Exabeam Security Intelligence Platform, as well as the context sources used to enhanced the logs ingested (e.g. assets, peer groups, service accounts, executives)
Manage context tables: Manage users, assets or other objects within Context Tables.
Comments
Add Advanced Analytics Comments: Add comments for the various entities (users, assets and sessions) within Exabeam.
Add Incident Responder Comments
Create
Create incidents
Upload Custom Services: Upload custom actions or services.
Delete
Delete incidents
Manage
Manage Custom Services and Packages: User can manage custom services and related packages
Manage Data Ingest: Configure log sources and feeds and email-based ingest.
Manage ingest rules: Add, edit, or delete rules for how incidents are assigned, restricted, and prioritized on ingest.
Manage Queues: Create, edit, delete, and assign membership to queues
Manage Playbook Templates: Create, edit, or delete playbook templates.
Manage Triggers: Create, update, or delete playbook triggers.
Run Actions: Launch individual actions from the user interface.
Manage Bi-directional Communication: Configure inbound and outbound settings for Bi-Directional Communications.
Manage Incident Configuration: Users can manage the Incident Configurations including Incident Types, Fields, Layouts, Case Manager Notifications and Checklists.
Manage Playbooks: Create, update, or delete playbooks.
Manage Services: Configure, edit, or delete services (3rd party integrations).
Run Playbooks: Run a playbook manually from the workbench.
Reset Incident Workbench: User can reset incident workbench
View
Manage Incident Configs: Manage Incident Incident Responder Configs
View API
View Executive Info: View the risk reasons and the timeline of the executive users in the organization. You will be able to see the activities performed by executive users along with the associated anomalies.
View health
View Raw Logs: View the raw logs that are used to built the events on AA timeline.
View Infographics: View all the infographics built by Exabeam. You will be able to see the overall trends for the organization.
View Metrics: View the Incident Responder Metrics page.
View Activities: View all notable users, assets, sessions and related risk reasons in the organization.
View comments
View Global Insights: View the organizational models built by Exabeam. The histograms that show the normal behavior for all entities in the organization can be viewed.
View incidents
View Insights: View the normal behaviors for specific entities within the organization. The histograms for specific users and assets can be viewed.
View Rules: View configured rules that determine how security events are handled
Edit & Approve
Approve Lockouts: Accept account lockout activities for users. Accepting lockouts indicates to Exabeam that the specific set of behaviors for that lockout activity sequence are whitelisted and are deemed normal for that user.
Bulk Edit: Users can edit multiple incidents at the same time.
Edit incidents: Edit an incident's fields, edit entities & artifacts.
Manage Watchlist: Add or remove users from the Watchlist. Users that have been added to the Watchlist are always listed on the Exabeam homepage, allowing them to be scrutinized closely.
Accept Sessions: Accept sessions for users. Accepting sessions indicates to Exabeam that the specific set of behaviors for that session are whitelisted and are deemed normal for that user.
Delete entities and artifacts: Users can delete entities and artifacts.
Manage Rules: Create/Edit/Reload rules that determine how security events are handled
Sending incidents to Incident Responder
Search
Manage Search Library: Create saved searches as well as edit them.
Basic Search: Perform basic search on the Exabeam homepage. Basic search allows you to search for a specific user, asset, session, or a security alert.
Threat Hunting: Perform thread hunting on Exabeam. Query the platform across a variety of dimensions such as find all users whose sessions contain data exfiltration activities or a malware on their asset.
Manage Threat Hunting Public searches: Create, update, delete saved public searches
Search Incidents: Can search keywords in Incident Responder via the search bar.
View Search Library: View the Search Library provided by Exabeam and the corresponding search results associated with the filters.
Data Privacy
View Unmasked Data (PII): Show all personally identifiable information (PII) in a clear text form. When data masking is enabled within Exabeam, this permission should be enabled only for select users that need to see PII in a clear text form.
Manage Users
Understand the difference between Roles and Users. Configure the analysts that have access to the Exabeam User Interface, add the analyst's information, assign them roles, and set up user permissions and access based on your organization's needs.
Users
Users are the analysts that have access to the Exabeam UI to review and investigate activity. These analysts have specific roles, permissions, and can be assigned Exabeam objects within the platform. They also have the ability to accept sessions. Exabeam supports local authentication or authentication against an LDAP server.
Add an Exabeam User
Navigate to Settings > Exabeam User Management > Users.
Click Add User.
Fill the new user fields and select role(s), and then click SAVE.
Your newly created user should appear in the Users UI.
User Password Policies
Exabeam users must adhere to the following default password security requirements:
Passwords must:
Be between 8 to 32 characters
Contain at least one uppercase, lowercase, numeric, and special character
Contain no blank space
User must change password every 90 days
New passwords cannot match last 5 passwords
SHA256 hashing is applied to store passwords
Only administrators can reset passwords and unblock users who have been locked out due to too many consecutive failed logins
The management policies that are adjustable:
Strong password policy can be changed by editing the
webcommonblock in/opt/exabeam/config/common/web/custom/application.conf.webcommon { ... auth { defaultAdmin { username = "admin" password = "changeme" } ... passwordConstraints { minLength = 8 maxLength = 32 lowerCaseCount = 1 upperCaseCount = 1 numericCount = 1 specialCharCount = 1 spacesAllowed = false passwordHistoryCount = 5 # 0 to disable password history checking } failedLoginLockout = 0 # 0 to disable loginLockout passwordExpirationDays = 90 # 0 to disable password expiration passwordHashing = "sha256" # accept either sha256 or bcrypt as options } ... }Default idle session timeout is 4 hours. Edit the
silhouette.authenticator.cookieIdleTimeoutvalue (in seconds) in/opt/exabeam/config/common/web/custom/application.conf.silhouette.authenticator.cookieIdleTimeout = 14400
Set Up LDAP Server
If you are adding an LDAP server for the first time, then the ADD CONTEXT SOURCE page displays when you reach the CONTEXT MANAGEMENT settings page. Otherwise, a list of LDAP Server appears, click Add Context Source to add more.
Select a Source Type:
Microsoft Active Directory
NetIQ eDirectory
Microsoft Azure Active Directory
The add/edit CONTEXT MANAGEMENT page displays the fields necessary to query and pull context information from your LDAP server(s), depending on the source chosen.
For Microsoft Active Directory:
Primary IP Address or Hostname – Enter the LDAP IP address or hostname for the primary server of the given server type.
Note
For context retrieval in Microsoft Active Directory environments, we recommend pointing to a Global Catalog server. To list Global Catalog servers, enter the following command in a Windows command prompt window:
nslookup -querytype=srv gc.tcp.acme.local. Replaceacme.localwith your company's domain name.Secondary IP Address or Hostname – If the primary LDAP server is unavailable, Exabeam falls back to the secondary LDAP server if configured.
TCP Port – Enter the TCP port of the LDAP server. Optionally, select Enable SSL (LDAPS) and/or Global Catalog to auto-populate the TCP port information accordingly.
Bind DN – Enter the bind domain name, or leave blank for anonymous bind.
Bind Password – Enter the bind password, if applicable.
LDAP attributes for Account Name – This field auto-populated with the value
sAMAccountName. Please modify the value if your AD deployment uses a different value.
For NetIQ eDirectory:
Primary IP Address or Hostname – Enter the LDAP IP address or hostname for the primary server of the given server type.
Secondary IP Address or Hostname – If the primary LDAP server is unavailable, Exabeam falls back to the secondary LDAP server if configured.
TCP Port – Enter the TCP port of the LDAP server. Optionally, select Enable SSL (LDAPS) and/or Global Catalog to auto-populate the TCP port information accordingly.
Bind DN – Enter the bind domain name, or leave blank for anonymous bind.
Bind Password – Enter the bind password, if applicable.
Base DN – .
LDAP Attributes – The list of all attributes to be queried by the Exabeam Directory Service (EDS) component is required. When testing the connection to the eDirectory server, EDS will collect from the server a list of the available attributes and display that list as a drop down menu. Select the name of the attribute from that list or provide a name of your own. Only names for the LDAP attributes you want EDS to poll are required (i.e., not necessarily the full list). Additionally, EDS does not support other types of attributes, therefore you cannot add “new attributes” on the list below.
For Microsoft Azure Active Directory:
Application Client ID — In App Registration in Azure Active Directory, select the application and copy the Application ID in the Overview tab.
Application Client Secret — In App Registration in Azure Active Directory, select the application and click on Certificates & Secrets to view or create a new client secret.
Tenant ID — In App Registration in Azure Active Directory, select the application and copy the Tenant ID in the Overview tab.
Click Validate Connection to test the LDAP settings.
Note
If you selected Global Catalog for either Microsoft Active Directory or NetIQ eDirectory, this button displays as Connect & Get Domains.
Click Save to save your context source,
Set Up LDAP Authentication
In addition to local authentication Exabeam can authenticate users via an external LDAP server.
When you arrive at this page, by default the ‘Enable LDAP Authentication’ is selected and the LDAP attribute name is also populated. To change the LDAP attribute, enter the new account name and click Save. To add an LDAP group, select Add LDAP Group and enter the DN of the group you would like to add. Test Settings will tell you how many analysts Exabeam found in the group. From here you can select which role(s) to assign. It is important to note that these roles are assigned to the group and not to the individual analysts; if an analyst changes groups their role will automatically change to the role(s) associated with their new group.
Third-Party Identity Provider Configuration
Exabeam supports integration with SAML 2.0 compliant third-party identity providers (IdPs) for single sign-on (SSO), multi-factor authentication, and access control. Once an IdP is added to your product, you can make IdP authentication mandatory for users to log in to the product, or you can allow users to log in through either the IdP or local authentication.
Note
You can add multiple IdPs to your Exabeam product, but only one IdP can be enabled at a time.
Add Exabeam to Your SAML Identity Provider
This section provides instructions for adding Exabeam to your SAML 2.0 compliant identity provider (IdP). For detailed instructions, refer to your IdP's user guide.
The exact procedures for configuring IdPs to integrate with Exabeam vary between vendors, but the general tasks that need to be completed include the following (not necessarily in the same order):
Begin the procedure to add a new application in your IdP for Exabeam (if needed, refer to your IdP's user guide for instructions).
In the appropriate configuration fields, enter the Exabeam Entity ID and the Assertion Consumer Service (ACS) URL as shown in the following:
Entity ID:
https://<exabeam_primary_host>:8484/api/auth/saml2/<identity_provider>/login
ACS URL:
https://<exabeam_primary_host>:8484/api/auth/saml2/<identity_provider>/handle-assertion
Important
Make sure that you replace
<exabeam_primary_host>with the IP address or domain name of your primary host. The only acceptable values for <identity_provider> are the following:adfsgooglepingoktaothers
If you are using Microsoft AD FS, Google IdP, Ping Identity, or Okta, enter the corresponding value from the preceding list. For all other IdPs, enter
others. All of the values are case sensitive.In the attribute mapping section, enter descriptive values for the following IdP user attributes:
Email address
First name
Last name
Group
Username (this attribute is optional)
Note
The actual names of these user attributes may vary between the different IdPs, but each IdP should have the corresponding attributes.
For example, if Primary email is the user email attribute in your IdP, you could enter
EmailAddressas the descriptive value. The following is an example of a completed attribute map in Google IdP: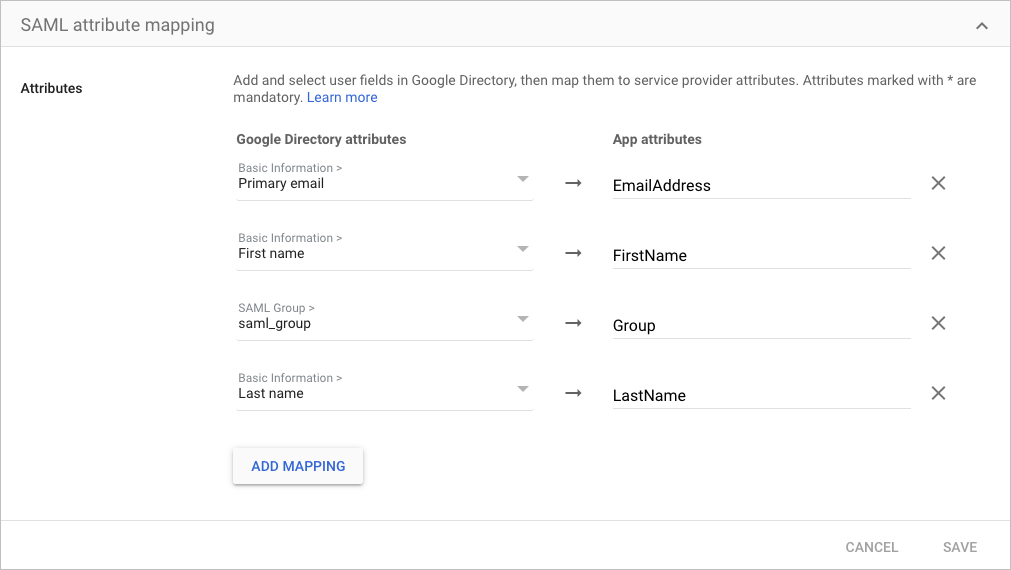
Important
When you Configure Exabeam for SAML Authentication, you need to use the same descriptive values to map the Exabeam query attributes with the corresponding IdP user attributes.
Complete any additional steps in your IdP that are necessary to finish the configuration. Refer to your IdP user guide for details.
Copy the IdP's connection details and download the IdP certificate or, if available, download the SAML metadata file.
Note
You need either the connection details and the IdP certificate or the SAML metadata file to complete the integration in Exabeam.
From the main menu on the left, select Apps and then click Web and mobile apps.
From the Add app drop-down menu, click Add custom SAML app.
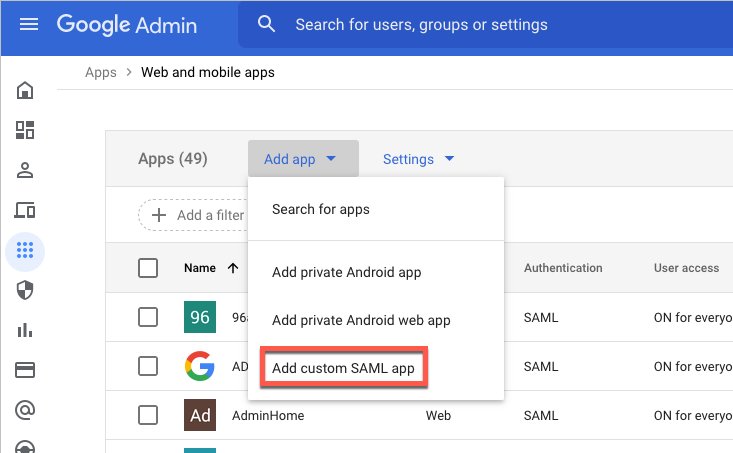
The App Details section opens.
In the App name field, enter a name.
Under App icon, click the blue circle, navigate to an image file that can be used as an icon and click to upload it.
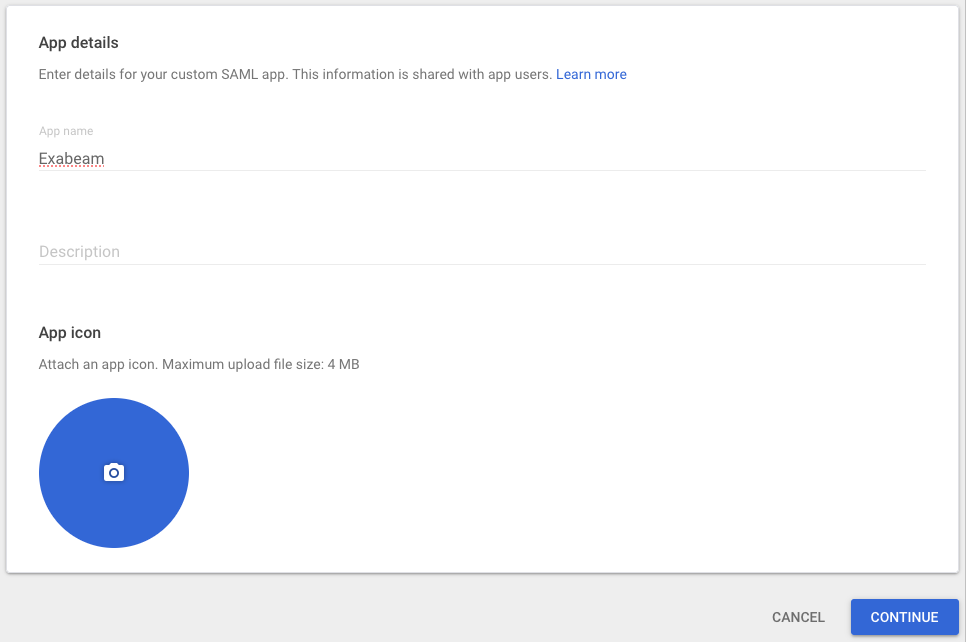
Click Continue.
The Google Identity Provider Details section opens.
Click Download IdP Metadata.
Note
The IdP metadata file needs to be uploaded to Exabeam when you Configure Exabeam for SAML Authentication.
Click Continue.
The Service Provider Details section opens.
Enter the ACS URL and Entity ID as shown in the following:
ACS URL:
https://<exabeam_primary_host>:8484/api/auth/saml2/google/handle-assertion
Entity ID:
https://<exabeam_primary_host>:8484/api/auth/saml2/google/login
Note
Make sure that you replace
<exabeam_primary_host>with the IP address or domain name of your primary host.Click Continue.
The Attribute Mapping section opens.
Click Add Mapping, and then from Select field drop-down menu, select Primary email.
Repeat the previous step for each of the following attributes:
Primary email
First name
Last name
Group
In the App attributes fields, enter descriptive values for the attributes.
For example, for the Primary email attribute, you could enter
EmailAddressfor the descriptive value. The following is an example of a completed attribute map:
Important
When you Configure Exabeam for SAML Authentication, you need to use the same descriptive values to map the Exabeam query attributes with the corresponding IdP user attributes.
Click Continue.
The details page opens for your Exabeam app.
In the User Access panel, click the Expand panel icon to begin assigning the appropriate organizational units and groups to your Exabeam app and manage its service status.
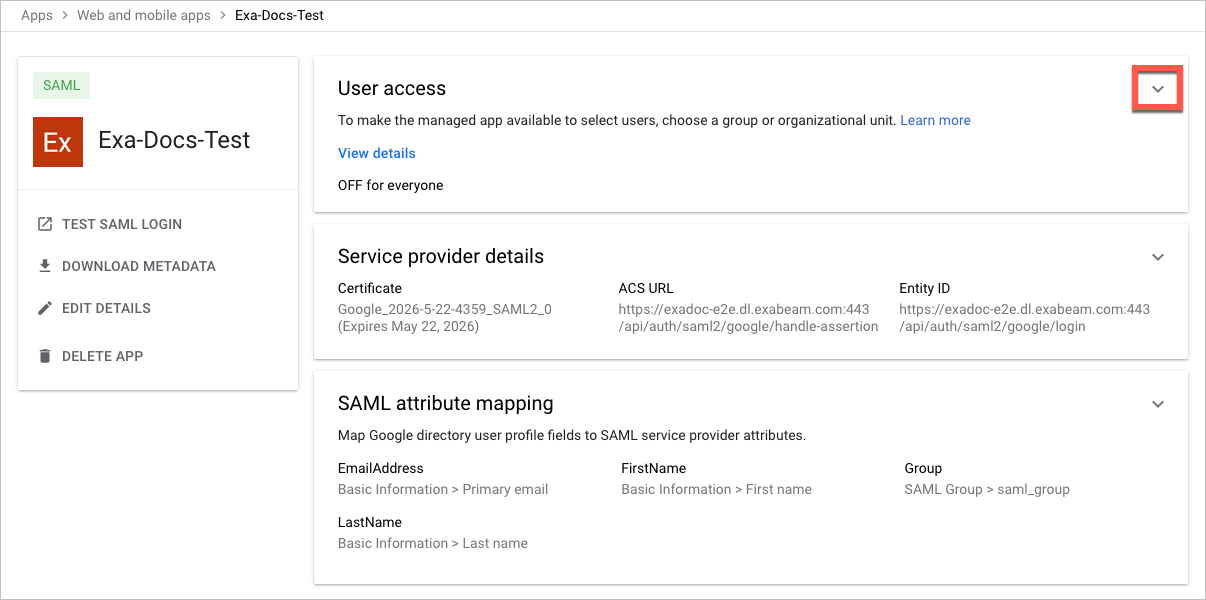
You are now ready to Configure Exabeam for SAML Authentication.
Note
The following instructions include procedural information for configuring both Azure AD and Exabeam to complete the IdP setup.
Log in to Microsoft Azure and navigate to Enterprise Applications.
Create an Exabeam enterprise application by doing the following:
Click New application, and then click Create your own application.
The Create your own application dialog box appears.
In the What's the name of your app field, type a name for the app (for example, "Exabeam-SAML").
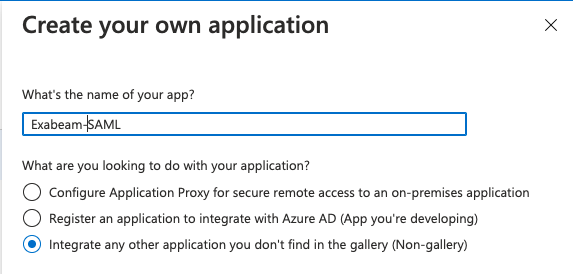
Select Integrate any other application you don't find in the gallery (Non-gallery).
Click Create.
On the Enterprise Application page, locate and click the application that you added in step 2.
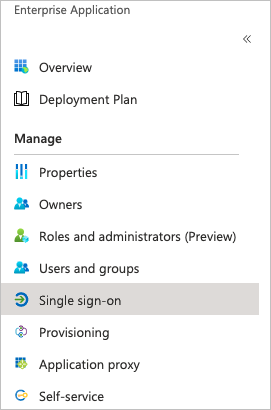
In the Manage section, click Single sign-on.
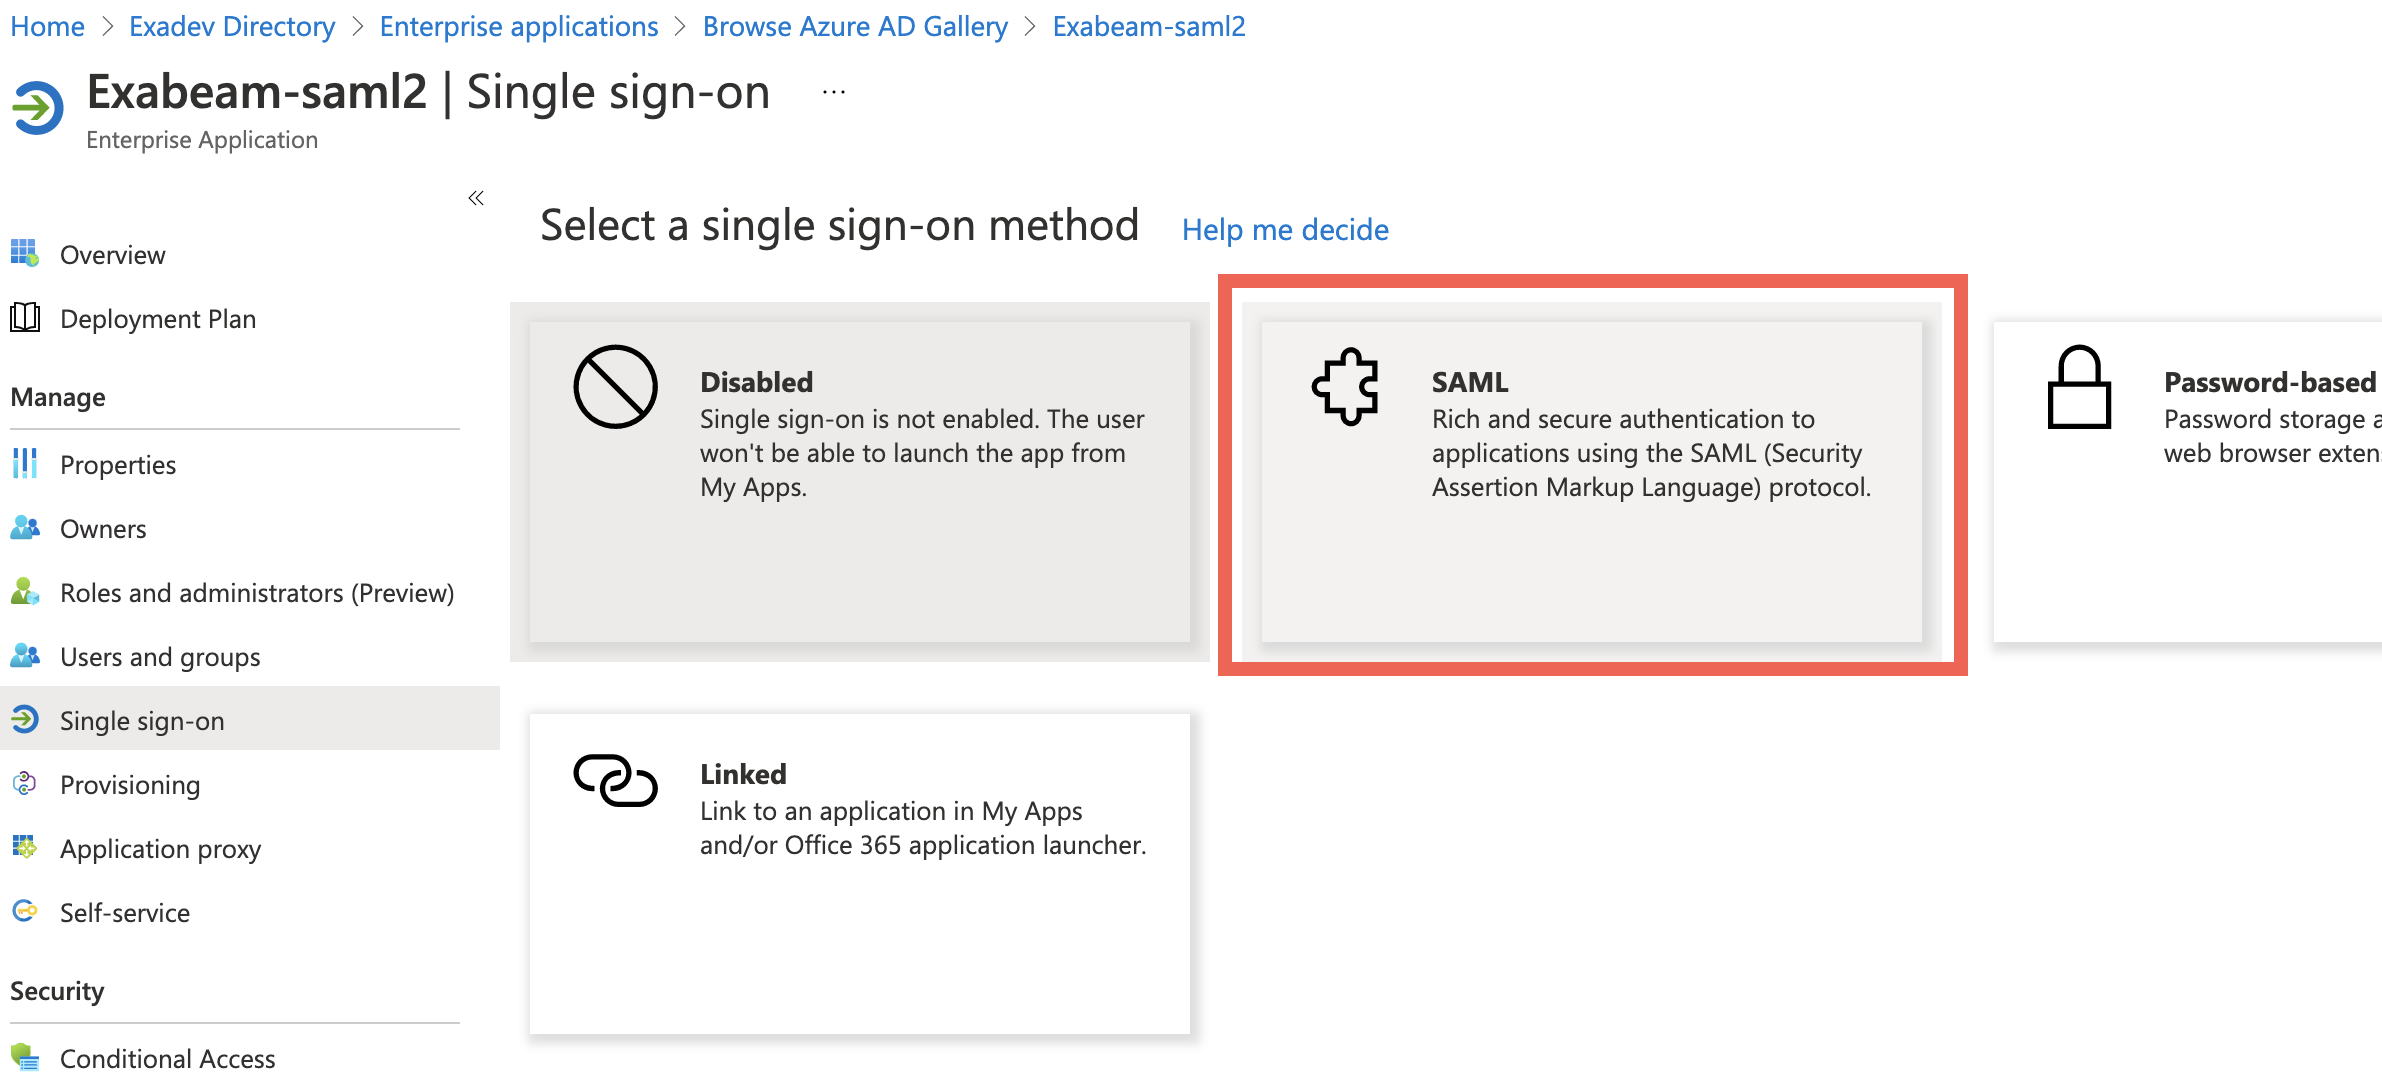
Click the SAML tile.
In the Basic SAML Configuration box (
 ), click Edit, and then do the following:
In the Identifier (Entity ID) field, enter the following: https://<exabeam_primary_host>:8484/api/auth/saml2/others/login
Note
Make sure that you replace
<exabeam_primary_host>with the IP address or domain name of your primary host.In the Reply URL (Assertion Consumer Service URL) field, enter the following: https://<exabeam_primary_host>:8484/api/auth/saml2/others/handle-assertion
Note
Make sure that you replace
<exabeam_primary_host>with the IP address or domain name of your primary host.Click Save.
In the User Attributes & Claims box (
 ), click Edit, and then map the Azure objects to your Exabeam field attributes.
Click the row for the user.mail claim.
The Manage claim dialog box appears.
In the Name field, type the name of the appropriate Exabeam field attribute.
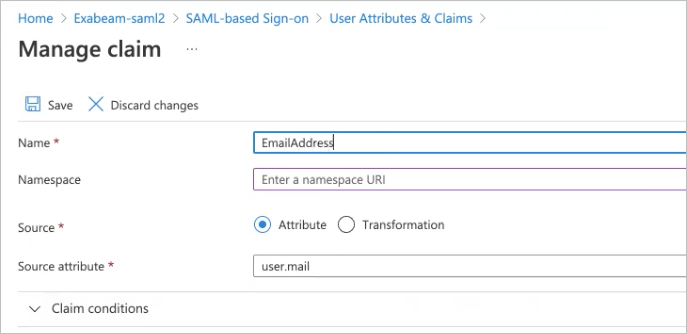
If needed, clear the value in the Namespace field to leave it empty.
Click Save.
Repeat steps a through d as needed for the following claims:
user.givenname
user.userprincipalname
user.surname
Click Add a group claim.
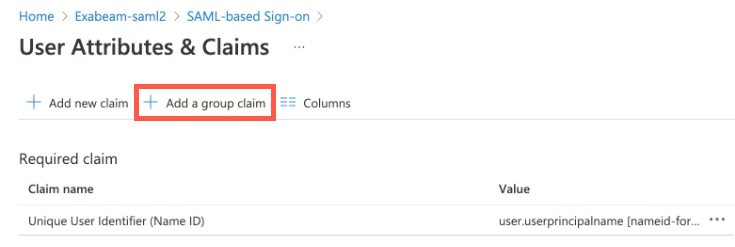
In the Group Claims dialog box, select Groups assigned to the application.
From the Source attribute drop-down list, select Group ID.
In the Advanced Options section, select the checkbox for Customize the name of the group claim.
In the Name (required) field, type Group.
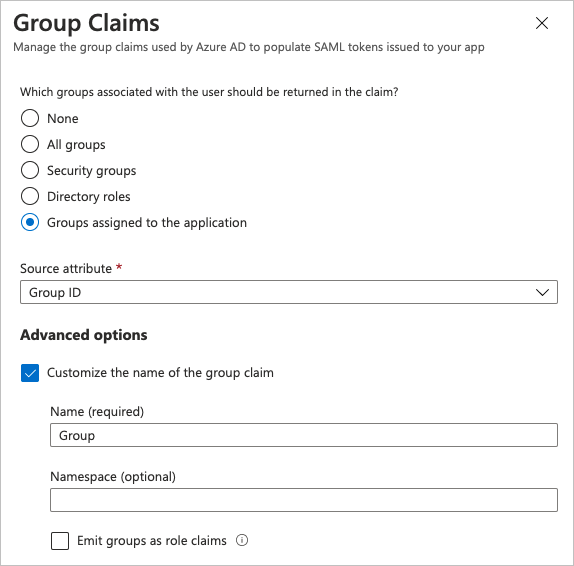
Click Save.
The Group claim is added to the User Attributes & Claims box.

In the SAML Signing Certificate box (
 ), download the Federation Metadata XML certificate to upload to Exabeam.
In Exabeam, navigate to Settings > User Management > Configure SAML, and then click Add Identity Provider.
The New Identity Provider dialog box appears.
From the SAML Provider drop-down list, select Custom/Generic IdP.
Under SSO Configuration, select Upload the XML metadata filed provided by your IdP, and then choose the Federation Metadata XML file that was downloaded in step 8.
In the Name of IdP field, type a name (for example, "Azure").
In the Upload IdP logo field, click Choose File, and then select a PNG file of the logo that you want to use.
Note
The PNG logo file size cannot exceed 1 MB.
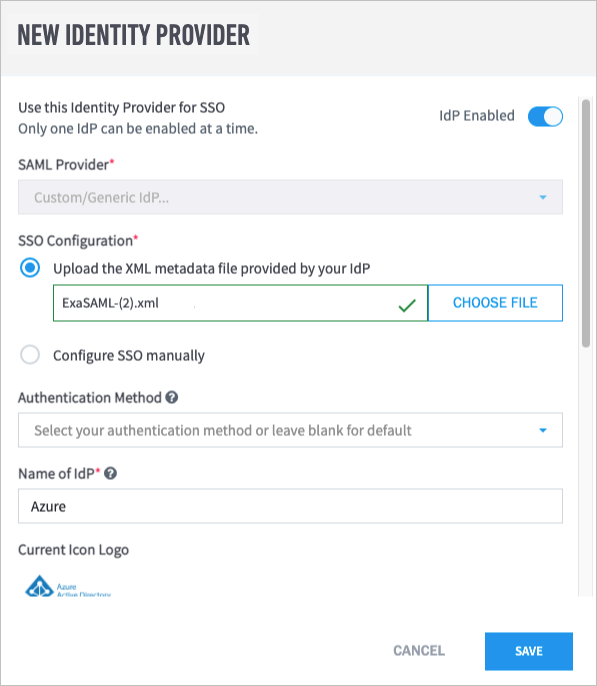
In the Query Attributes section, enter the appropriate IdP attribute values for each field that you defined in step 7.
Important
The IdP attribute values must match the values that you defined in step 7.
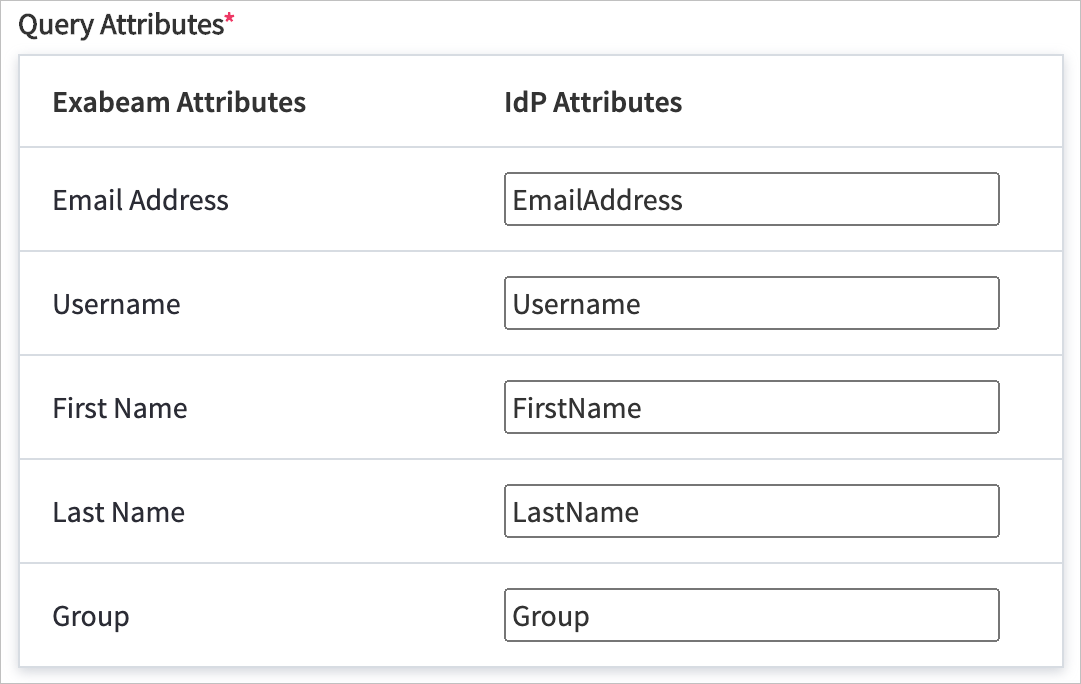
Click Save.
Azure now appears as an identity provider in the Configure SAML tab of the User Management page, and a Group Mappings section also appears.
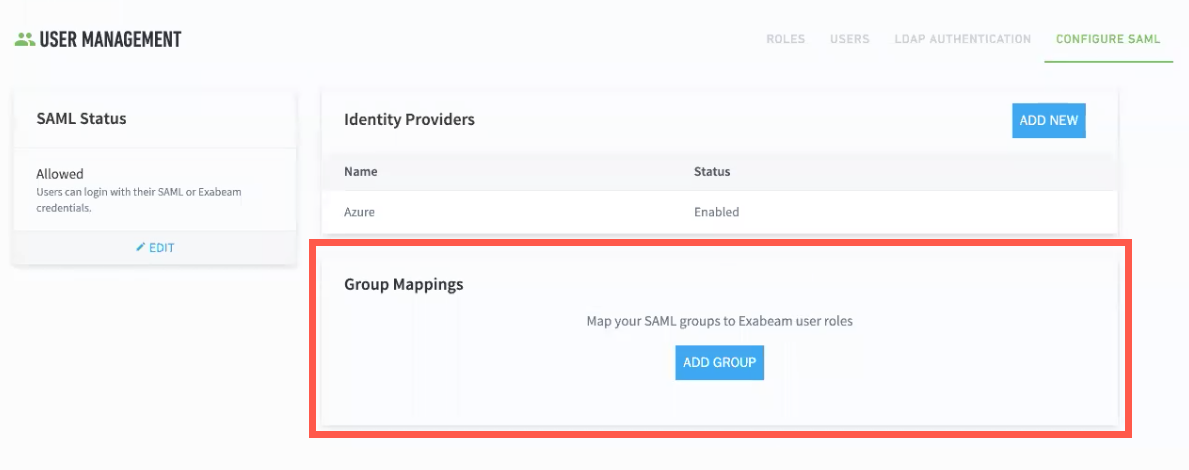
To map a SAML group to Exabeam user roles, do the following:
On the home page of Azure, click Groups.
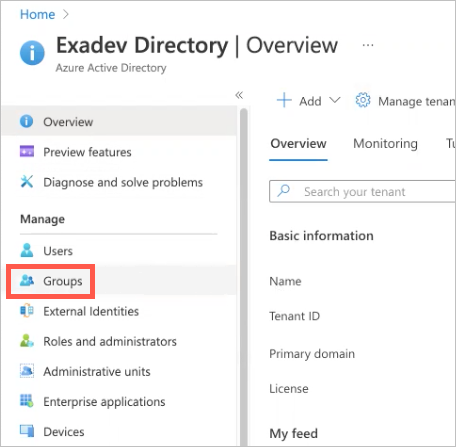
From the Object Id column, copy the ID for the Azure group that you want to map.

In Exabeam, on the Configure SAML tab of the User Management page, click Add Group.
The Edit Group Mapping dialog box appears.
From the Identity Provider drop-down menu, select Others.
In the Group Name field, paste the object ID that you copied in step b.
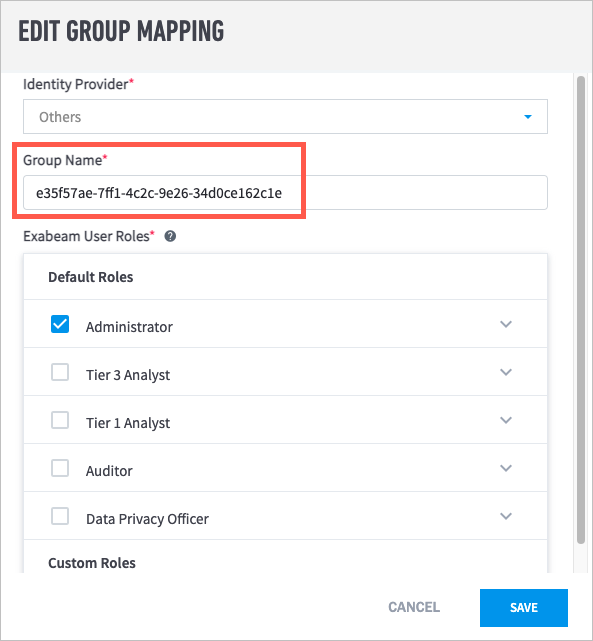
Select the Exabeam User Roles that you want to assign to the group.
Click Save.
Repeat steps a through g for each Azure group that you want mapped to user roles.
To verify that Azure has been successfully configured, log out of Exabeam and look for the Azure Active Directory option on the sign-on screen.
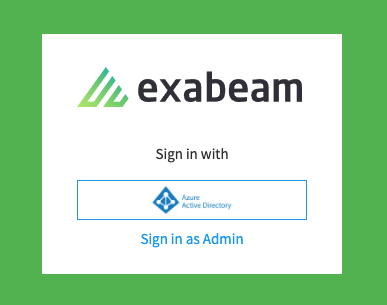
Configure Exabeam for SAML Authentication
Important
Before you begin this procedure, you need to Add Exabeam to Your SAML Identity Provider.
Log in to your Exabeam product.
Navigate to Settings
 > Core > User Management > Configure SAML.
Click Add Identity Provider.

From the SAML Provider drop-down menu, select your IdP.
Note
If your IdP is not listed, select Custom/Generic IdP.
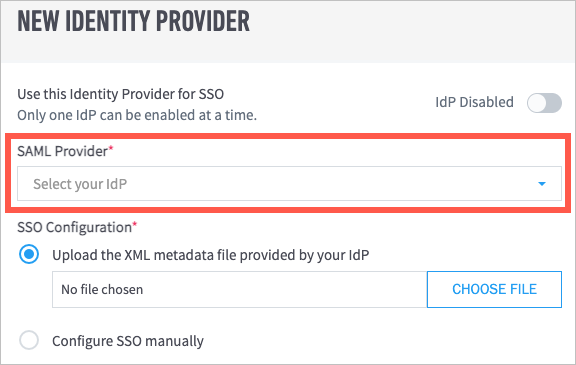
With the information that you collected in step 5 of Add Exabeam to Your SAML Identity Provider, do one of the following:
If you have an XML metadata file from your IdP, select Upload the XML metadata provided by your IdP, and then click Choose File to locate and upload the file from your computer.
If you do not have a metadata file, select Configure SSO manually and then do the following:
Click Choose File to locate and upload the IdP certificate from your computer.
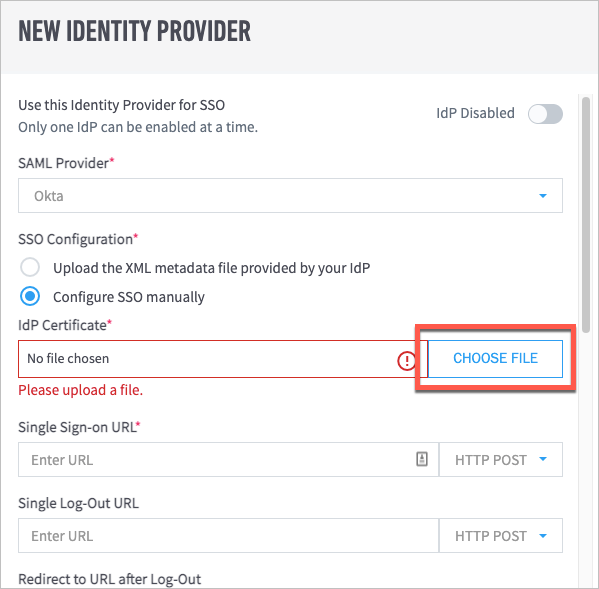
In the Single Sign-on URL field, enter the appropriate URL, and then select either HTTP POST or HTTP REDIRECT as needed from the drop-down menu.
(Optional) In the Single Log-Out URL and Redirect to URL after Log-Out fields, enter the appropriate URLs.
If you selected Custom/Generic IdP in the previous step, do the following:
In the Name of IdP field, enter a name.
Under Upload IdP Logo, click Choose File to locate and upload an IdP logo image in PNG format.
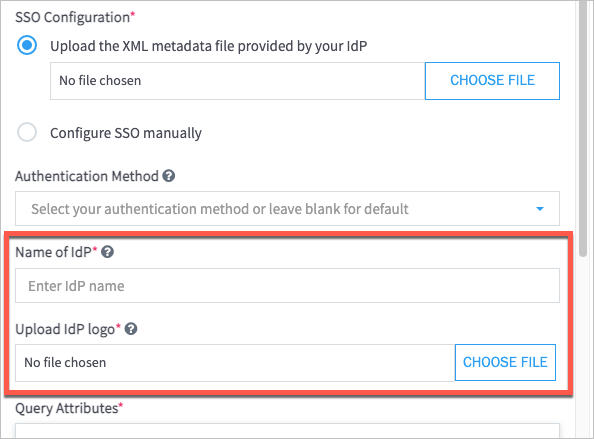
(Optional) From the Authentication Method drop-down menu, select an authentication method.
Note
Leave the field blank to accept the IdP's default method.
If you are using AD FS and want to enable encryption, click the Encryption Disabled toggle to enable it (the toggle turns blue when enabled), and then configure the following encryption options that apply to your environment:
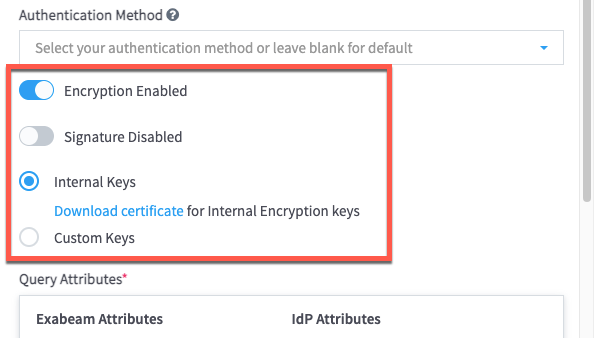
In the Query Attributes table, map the Exabeam query attributes to the corresponding IdP user attributes by entering the same descriptive values that you did in Add Exabeam to Your SAML Identity Provider, as demonstrated in the following example:

(Optional) If you are ready to enable the IdP, click the IdP Disabled toggle. When the IdP is enabled, the toggle turns blue.
Note
You can add multiple IdPs to your Exabeam product, but only one IdP can be enabled at a time.
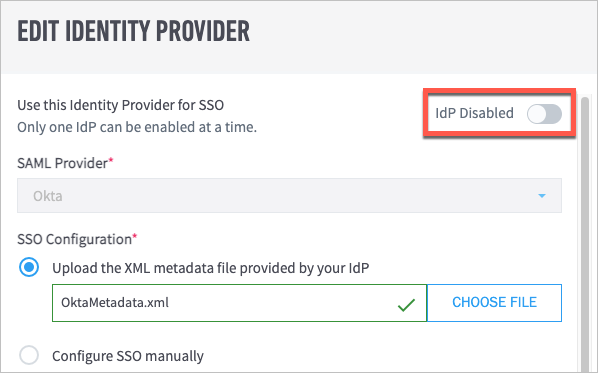
Click Save. Your identity provider now appears in the Identity Providers table.
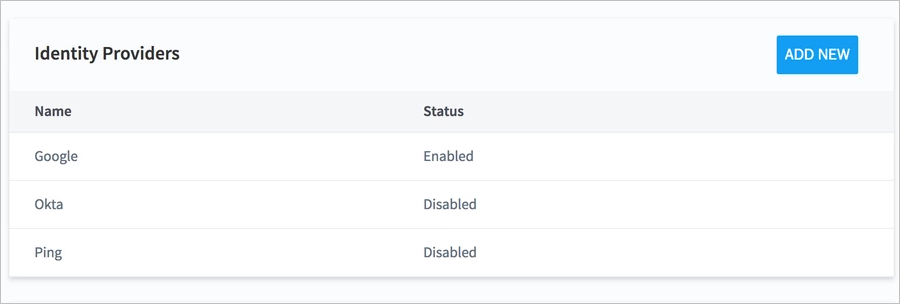
To complete the configuration, you need to map your SAML groups to Exabeam user roles. For instructions, see Map SAML Groups to Exabeam User Roles.
Map SAML Groups to Exabeam User Roles
After adding a third-party identity provider (IdP) to your Exabeam product, you need to map the IdP user groups to the appropriate user roles in Exabeam. For example, if in your IdP you have an "Advanced Analyst" user group that needs the permissions included in the Tier 3 Analyst (Advanced Analytics) role, you can map the group to that role. Each group can be mapped to one or more roles as needed.
Navigate to Settings
 >Core >User Management > Configure SAML.
In the Group Mappings section (which appears below the Identity Providers table), click Add Group.
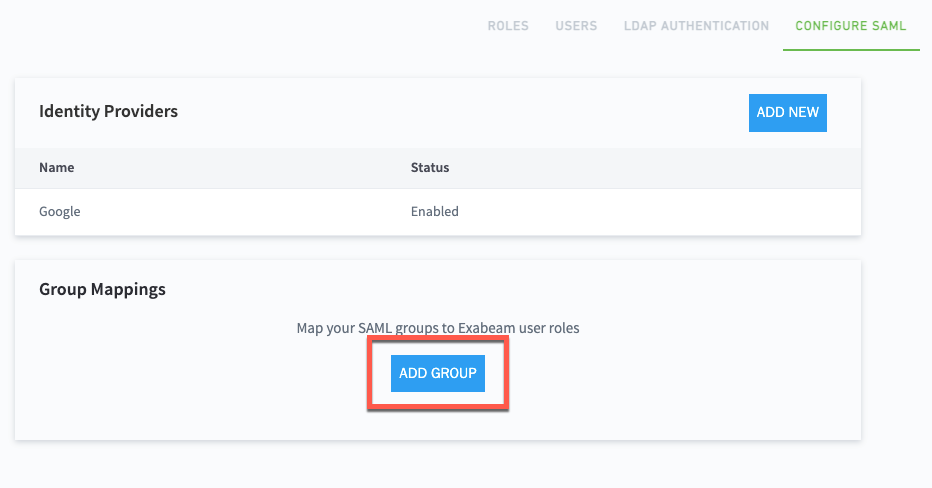
The New Group Mapping dialog box appears.
From the Identity Provider drop-down menu, select the IdP that you want to map.
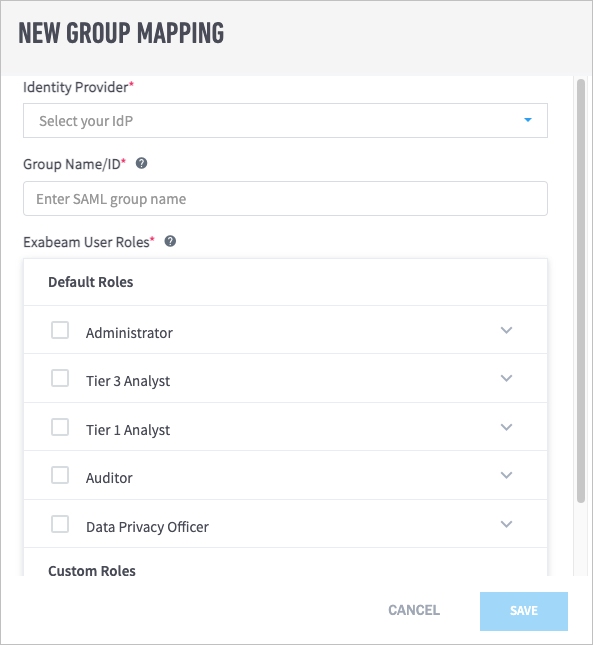
In the Group Name/ID field, enter the group name or ID as it is listed in the IdP.
Important
Group names are case sensitive.
In the Exabeam User Roles list, select the checkboxes for the role(s) that you want to assign to the group.
Click Save.
Manage SAML Login Status
You can make authentication through your selected identity provider (IdP) mandatory for users to log in, or you can allow users to log in through either the IdP or local authentication. You can also disable your selected IdP so that users can only log in through local authentication.
Navigate to Settings
 > > User Management > Configure SAML.
In the SAML Status box, select a login status for your IdP.
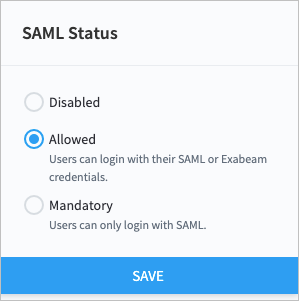
Click Save.
Enable or Disable Identity Providers
Note
You can add multiple identity providers (IdPs) to your Exabeam product, but only one IdP can be enabled at a time.
Navigate to Settings > > User Management > Configure SAML.
Move your pointer over the IdP that you want to enable or disable, and click the edit icon.
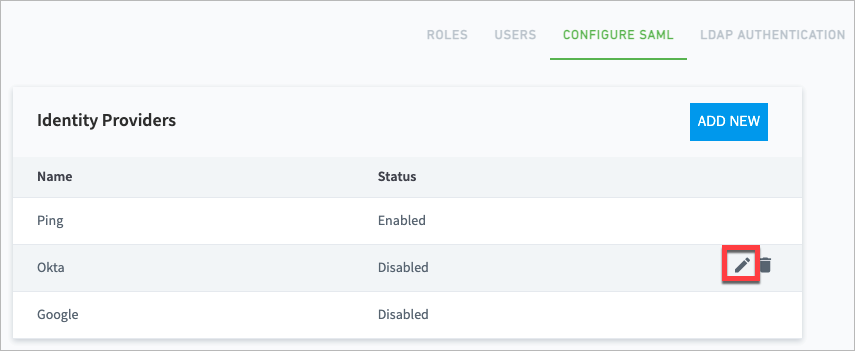
The Edit Identity Provider dialog box opens.
Click the IdP Enabled/Disabled toggle to enable or disable the IdP as needed.
The toggle is blue when the IdP is enabled and gray when it is disabled.
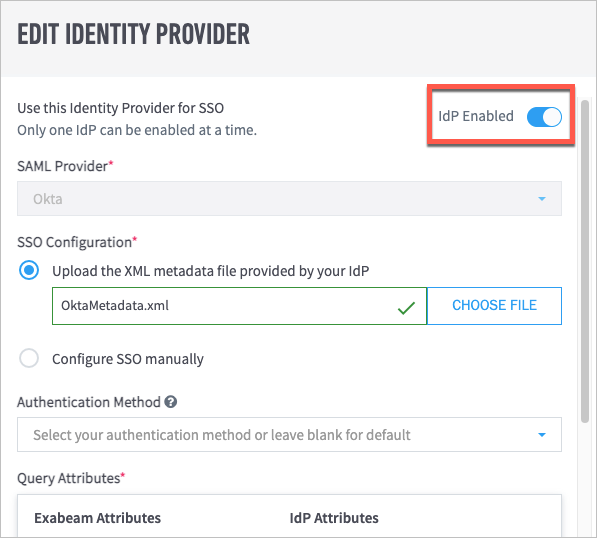
Azure AD Context Enrichment
Important
For the Azure AD context enrichment feature to function, your organization must have a hybrid Active Directory deployment that uses Azure AD and either Microsoft AD or Microsoft ADDS.
Organizations using Azure Active Directory (AD) can enrich their event logs by adding user context. This feature automatically pulls user attribute information from Azure AD on a daily basis and enriches logs in real time. Pulled attributes include the following:
ID
userType
userPrincipalName
mailNickname
onPremisesSamAccountName
displayName
mail
For descriptions of the attributes, see Azure Active Directory Context Tables.
Note
While context information from Azure AD is pulled daily, you can also perform manual pulls from Azure AD to immediately update information after changes to user accounts.
The following table lists the events that can be enriched with context from Azure AD:
Office 365 | Azure | Windows Defender | Windows |
|---|---|---|---|
Failed Sign in Alert Failed App Login App Login Sign in Alert Account Unlocked Account Password Changed Account Disabled Security Alert 1 Security Alert 3 Member Added Member Removed PowerBI Activity Hub Network Connection App Activity | App Activity App Login Core Directory | EventHubs Login PIM Activity Security Alert | Auth Events App Login Activity |
Set Up Azure AD Context Enrichment
Navigate to Settings > Core > Context Management > Add Context Source.
The Context Management page opens.
Click + Add Context Source.
From the Source Type drop-down menu, select Microsoft Azure Active Directory.
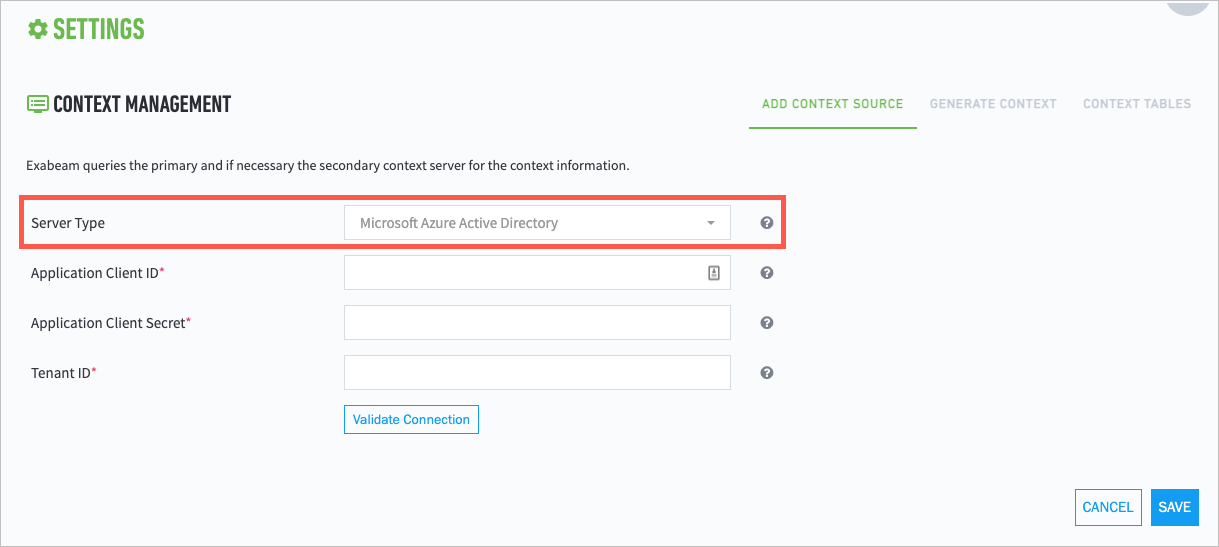
Provide the appropriate values for the following fields:
Application Client ID
Application Client Secret
Tenant ID
To generate the appropriate values for these fields, do the following:
Log in to Microsoft Azure.
Under Azure services, click App registrations.
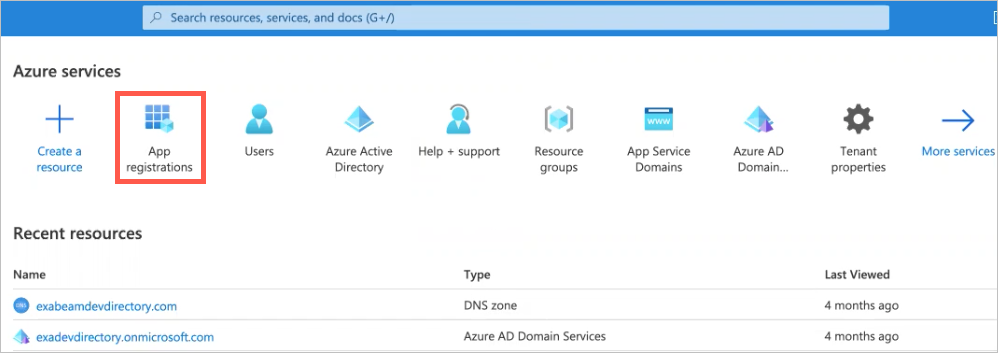
Click New registrations.
In the Name field, type a name for the app.
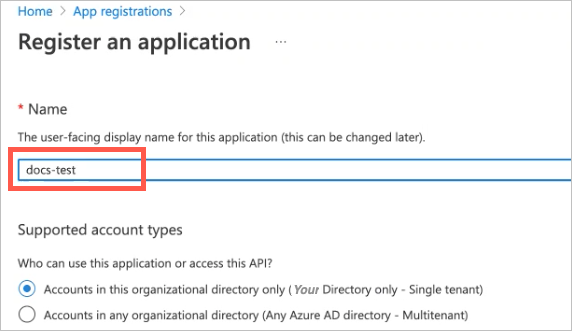
Under supported account types, ensure that the following setting is selected: Accounts in this organizational directory only (Your Directory only - Single tenant).
At the bottom of the page, click Register.
The Overview page for your new app appears.
Copy the Application (client) ID and paste it into the Application Client ID field in Exabeam; copy the Directory (tenant) ID and paste it into the Tenant ID field.
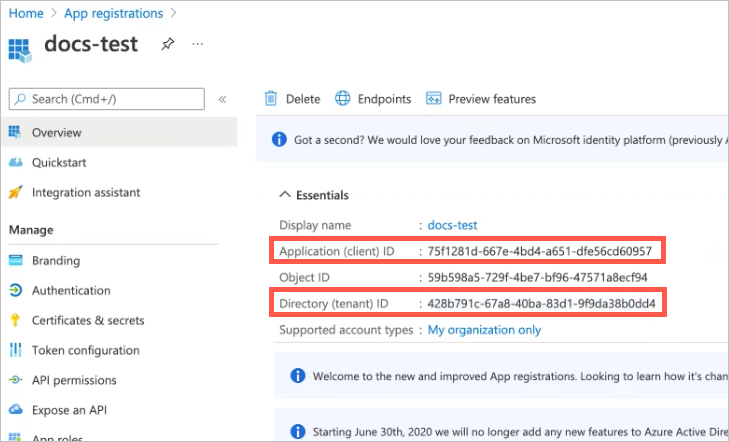
In the Manage menu, click API permissions.
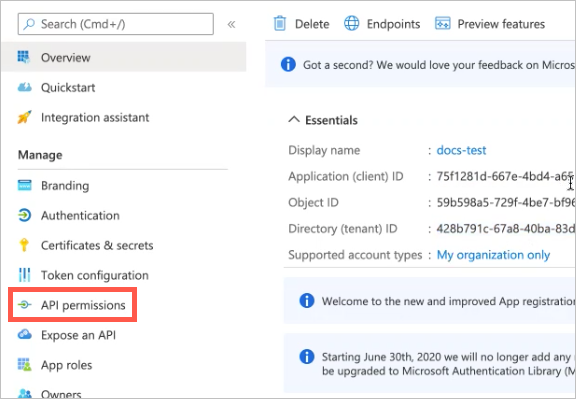
The API permissions page opens.
Click Add a permission.
The Request API permissions panel opens on the right.
Click the Microsoft Graph box.
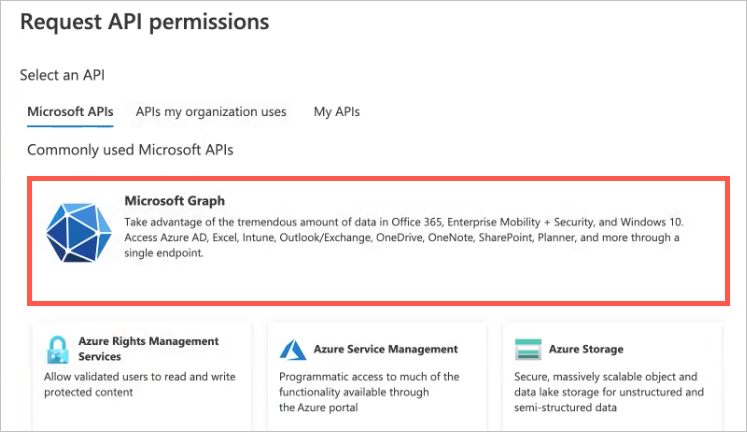
Click the Application permissions box.
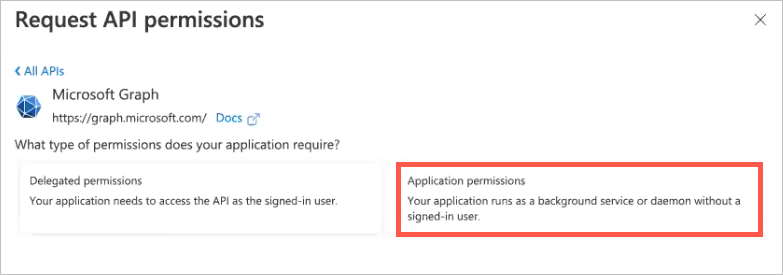
In the Select permissions text filter, type
directory.Click the Directory drop-down arrow, and then select Directory.Read.All.
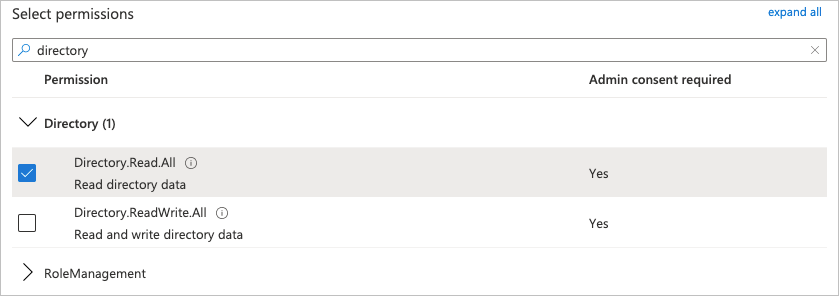
At the bottom of the panel, click Add permissions.
The panel closes and the added permission appears under Configured permissions.
Click Grant admin consent for Exadev Directory, and then click Grant admin consent confirmation.

In the Manage menu on the left, click Certificates & secrets.
The Certificates & secrets page opens.
Click New client secret.
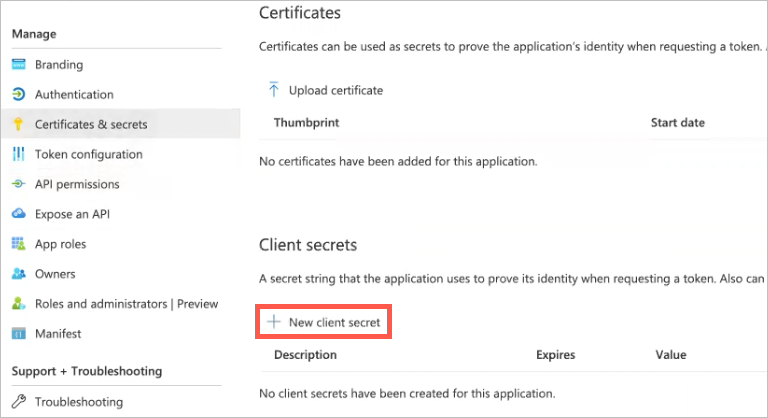
The Add a client secret panel opens on the right.
In the Description field, provide a description of the secret (such as what the secret is being used for).
From the Expires drop-down menu, select a time frame for when you want the secret to expire.
At the bottom of the panel, click Add.
The panel closes and the added secret appears in the Client secrets list.
Click the copy-to-clipboard icon for the secret Value, and then paste the value into the Application Client Secret field in Exabeam.

To test the connection with Azure AD, click Validate Connection.
A message displays to indicate whether the connection is successful.
If the connection is successful, click Save to complete the setup.
Azure AD is added to the list of data sources on the Context Management page.
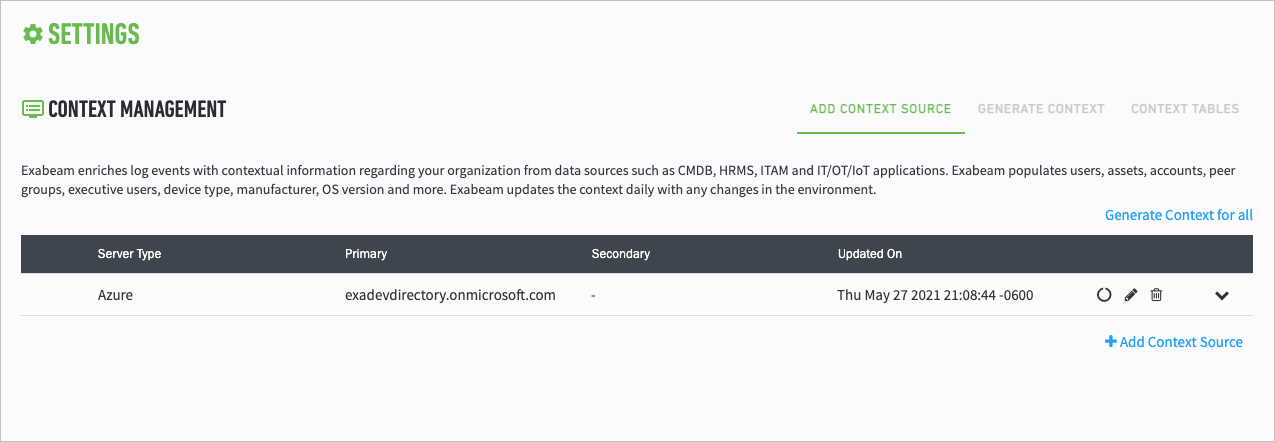
Set Up Context Management
Logs tell Exabeam what the users and entities are doing while context tells us who the users and entities are. These are data sources that typically come from identity services such as Active Directory. They enrich the logs to help with the anomaly detection process or are used directly by the risk engine layer for fact-based rules. Regardless of where these external feeds are used, they all go through the anomaly detection layer as part of an event. Examples of context information potentially used by the anomaly detection layer are the location for a given IP address, ISP name for an IP address, and department for a user.
Administrators are able to view and edit Exabeam's out-of-the-box context tables as well as create their own custom tables. They can select a specific table, such as Executive Users, Service Accounts, etc. and see the details of the table and all of the objects within the table. Edits can be performed on objects individually or through CSV uploads.
Out-of-the-Box Context Tables
Context Table | Source | Available Actions |
|---|---|---|
email_user | LDAP | This table is automatically populated when administrators integrate their LDAP system with Exabeam. Administrators cannot add, edit, or delete the entries in this context table. |
fullname_user | LDAP | This table is automatically populated when administrators integrate their LDAP system with Exabeam. Administrators cannot add, edit, or delete the entries in this context table. |
user_account | LDAP | This table is automatically populated when administrators integrate their LDAP system with Exabeam and add regular expression through the Advanced Analytics tab. Administrators can add entries manually via CSV or AD filters. Where Administrators have manually added users, they can also edit or delete entries. |
user_department | LDAP | This table is automatically populated when administrators integrate their LDAP system with Exabeam and add regular expression through the Advanced Analytics tab. Administrators can add entries manually via CSV or Active Directory filters. Where Administrators have manually added users, they can also edit or delete entries. |
user_division | LDAP | This table is automatically populated when administrators integrate their LDAP system with Exabeam and add regular expression through the Advanced Analytics tab. Administrators can add entries manually via CSV or Active Directory filters. Where Administrators have manually added users, they can also edit or delete entries. |
user_manager | LDAP | This table is automatically populated when administrators integrate their LDAP system with Exabeam and add regular expression through the Advanced Analytics tab. Administrators can add entries manually via CSV or Advanced Directoryfilters. Where Administrators have manually added users, they can also edit or delete entries. |
user_department_number | LDAP | This table is automatically populated when administrators integrate their LDAP system with Exabeam and add regular expression through the Advanced Analytics tab. Administrators can add entries manually via CSV or Active Directory filters. Where Administrators have manually added users, they can also edit or delete entries. |
user_country | LDAP | This table is automatically populated when administrators integrate their LDAP system with Exabeam and add regular expression through the Advanced Analytics tab. Administrators can add entries manually via CSV or Active Directory filters. Where Administrators have manually added users, they can also edit or delete entries. |
user_location | LDAP | This table is automatically populated when administrators integrate their LDAP system with Exabeam and add regular expression through the Advanced Analytics tab. Administrators can add entries manually via CSV or Active Directory filters. Where Administrators have manually added users, they can also edit or delete entries. |
user_title | LDAP | This table is automatically populated when administrators integrate their LDAP system with Exabeam and add regular expression through the Advanced Analytics tab. Administrators can add entries manually via CSV or Active Directory filters. Where Administrators have manually added users, they can also edit or delete entries. |
user_fullname | LDAP | This table is automatically populated when administrators integrate their LDAP system with Exabeam. Administrators cannot add, edit, or delete the entries in this context table. |
user_phone_cell | LDAP | This table is automatically populated when administrators integrate their LDAP system with Exabeam and add regular expression through the Advanced Analytics tab. Administrators can add entries manually via CSV or Active Directory filters. Where Administrators have manually added users, they can also edit or delete entries. |
user_phone_office | LDAP | This table is automatically populated when administrators integrate their LDAP system with Exabeam and add regular expression through the Advanced Analytics tab. Administrators can add entries manually via CSV or Active Directory filters. Where Administrators have manually added users, they can also edit or delete entries. |
user_is_privileged | Administrators | Administrators can add entries manually, via CSV, or Active Directory. Entries can also be edited or deleted. |
Azure Active Directory Context Tables
Context Table | Decsription |
|---|---|
ID | User's globally unique identifier (GUID). |
userType | Indicates whether the user is a member or guest. |
userPrincipalName | User principal name (UPN) of the user. |
mailNickname | Mail alias for the user. |
onPremisesSamAccountName | User's samAccountName in the on-prem LDAP, which is synced to Azure AD. |
displayName | Display name for the user. |
User's email address from the Azure user profile. |
Threat Intelligence Service Context Tables
The table below shows the description of each available threat intelligence feed to a context table in Advanced Analytics:
Context Table | Description |
|---|---|
is_ip_threat | IP addresses identified as a threat. |
is_ransomware_ip | IP addresses associated with ransomware traffic. |
is_tor_ip | Known Tor IP addresses. |
reputation_domains | Domains associated with malware traffic |
web_phishing | Domains associated with phishing attacks. |
For more information on Exabeam threat intelligence service, please see the section Threat Intelligence Service Overview.
Custom Context Tables
Exabeam provides several filters and lookups to get your security deployment running immediately. However, there may be assets and users within your organization that need particular attention and cannot be fully addressed out of the box. Custom context tables allow you the flexibility to create watchlists or reference lists for assets, threat intelligence indicators, and users/groups that do not fit in the typical deployment categories. Custom context tables let you put parts of your organization under extra monitoring or special scrutiny, such as financial servers, privileged insiders, and high-level departed employees.
Within Advanced Analytics, you can create watchlists using context tables. When creating the table, the Label attribute allows you to attach tags to records that match entries in your context table. This provides quick access to query your results and/or focus your tracking using a global characteristic.
You can also build rules based on entries in your context tables. Set up alerts, actions, or playbooks to trigger when conditions match records, such as access to devices in a special asset group.
Context Data
Prepare Context Data
You can upload data as CSV files with either key and value columns or key-only column. All context tables include a Label to tag matching records into groups during parsing and filtering.
Key-value CSV –Two-field data file with a header row. This lookup lists correlations between the two fields, such as:
Key Fieldname | Value Fieldname |
|---|---|
AC1Group | Accounts Receivable |
AC2Group | Accounts Payable |
Key-only CSV – Single-field data file with no header row. Items on this list are compared to as being present or not during data filtering. For example, a watchlist context table, SpecialGroup, consists of user groups of special interest:
“Accounts Receivable”
“Accounts Payable”
“Accounting Database Admin”
You can create a correlation rule that sends an alert when the monitoring data contains a user having the group name that matches any in the Special Group table.
Label – The named tag associated with a record. This allows you to filter groups of records during parsing or filtering. You can also use labels to assemble watchlists based on groupings rather than by individual asset or user record.
Note
You can opt not to use labels by selecting No Label during table creation. Otherwise, labels are associated with tables and its records. For key-value context tables, the Label is drawn from the value field of the matching context table entry. For key-only context tables, the Label is the table attribute you enter in the Manual Assignment field during table creation and is used to tag all matching records.
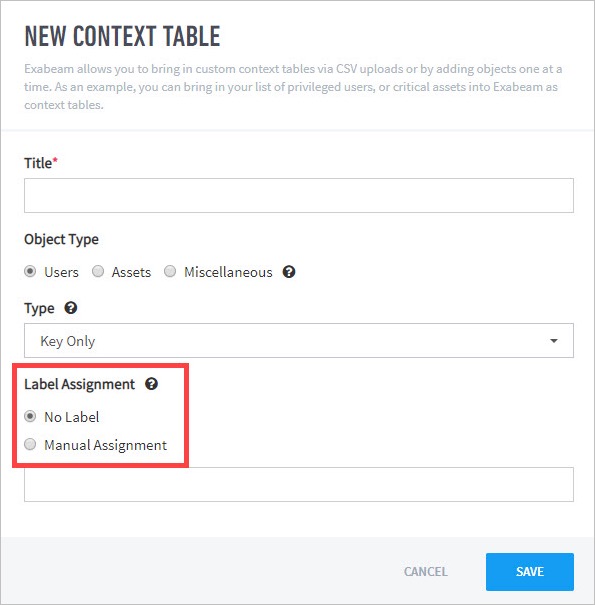 |
Create Custom Lookups
You must first create a table object to add contextual data to. Create the table with key-only or key-value field and whether labels will used based on the needs of your organization. Use the various methods to add content into your table depending on your data source.
Create a Context Table
To introduce context data into your environment, create a table object to contain your data and reference it in queries and lookups.
Navigate to Settings > Accounts & Groups > Context Tables.
At the top right of the UI, click the blue + to open the New Context Table dialogue box.

Fill in the details of the type of context table that this will be.
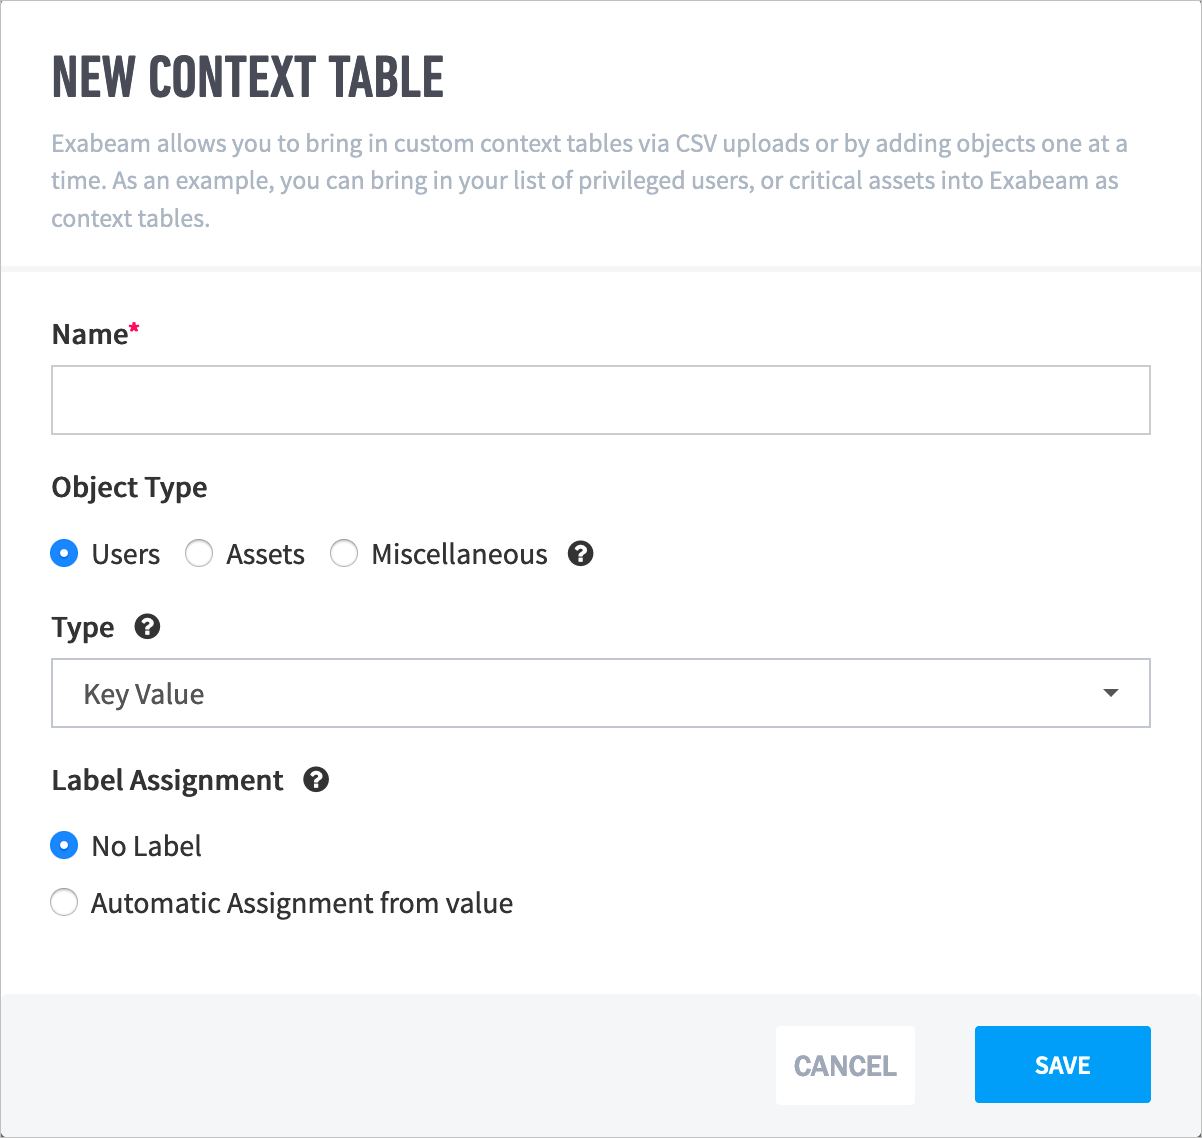
Fill in table attribute fields:
Name – A unique name identifying the table in queries and in the context of your organization.
Object Type – The type gives the table additional tagging (with information on the potential data source, such as LDAP for users or user groups).
Users – This object type is associated with users and user group context tables. LDAP data sources can be used to fill its content.
Assets – These are itemizable objects of value to your organization. These can be devices, files, or workstations/servers.
Miscellaneous – These are reference objects of interest, such as tags for groups of objects within a department or network zones.
Type – Select the field structure in the table as
Key ValueorKey Only. See Prepare Context Data for more information. If you are creating a correlation context table, useKey Only.Label Assignment – Click the text source for creating the label or use no label. See Prepare Context Data for more information.
Click Save to advance to the table details UI for the newly created context table.
Your table is ready to store data. The following sections describe ways to add data to your table. Each method is dependent on the data source and intended use of the table.
Import Data into a Context Table Using CSV
This is the most flexible method to create unconventional context tables as the CSV file can contain any category or type of data that you wish to monitor.
Select your desired context table.
Select the Upload Table icon.
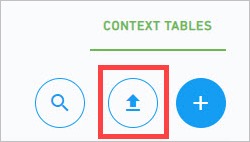
Click Upload CSV. From your file system, select the CSV file you wish to import, then select Next.
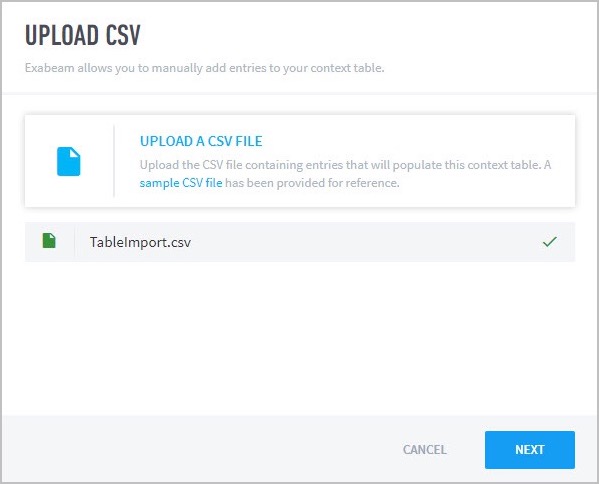
Note
Key and value (2 fields) tables require a header first row. Do not include a header for keys-only CSV files (1 field). Table names may be alpha-numeric with no blank spaces. (Underscore is acceptable.)
Inspect the contents that will be added to your table. Select Apply Changes, when you are done.
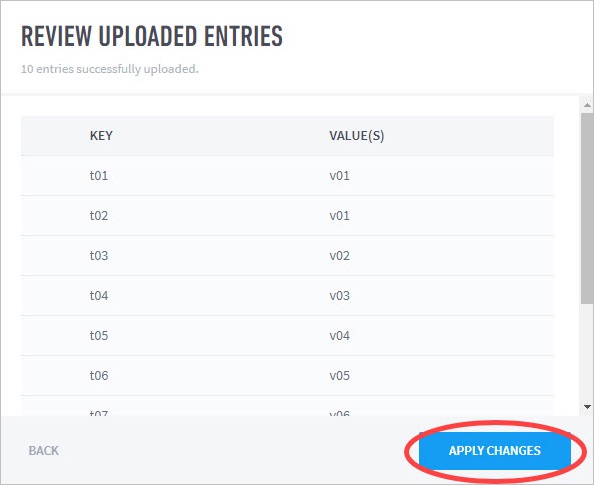
Once context has been integrated, it is displayed in the table. You can use the lookup tables in rules as required.
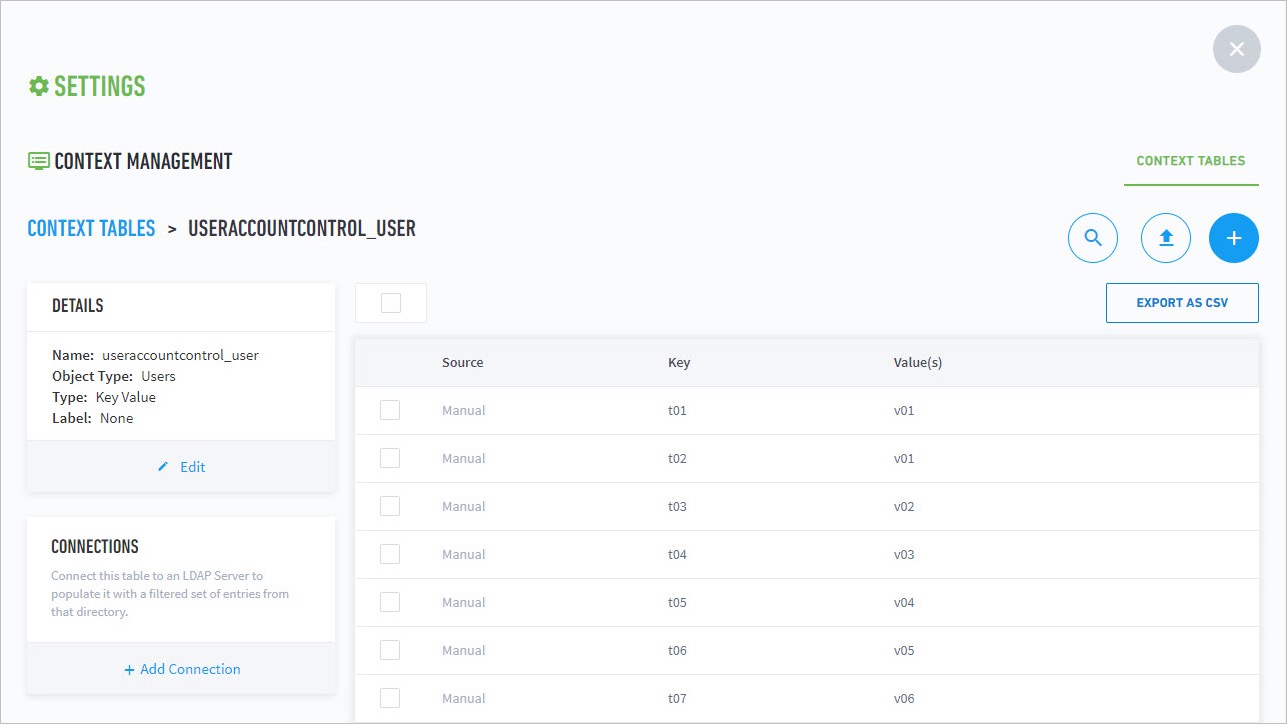
For assistance in creating custom context tables, contact Exabeam Customer Success by opening a case at the Exabeam Community.
Import Data into a Context Table Using an LDAP Connection
This section details the steps required to create context tables to customize your lookups. In this example, we are creating a lookup table with two fields: the userAccountControl field and the User ID field. This allows the event enricher to map one to the other. For example, let's say you have a log that does not include the username, but instead included the userAccountControl field. This would map the two together. A similar use case would be badge logs: you could create a lookup table that maps the badge ID to the actual username, assuming the badge ID is contained in LDAP.
Navigate to the Settings > Accounts & Groups > Context Tables.
Click the ‘+’ icon to add a new table.
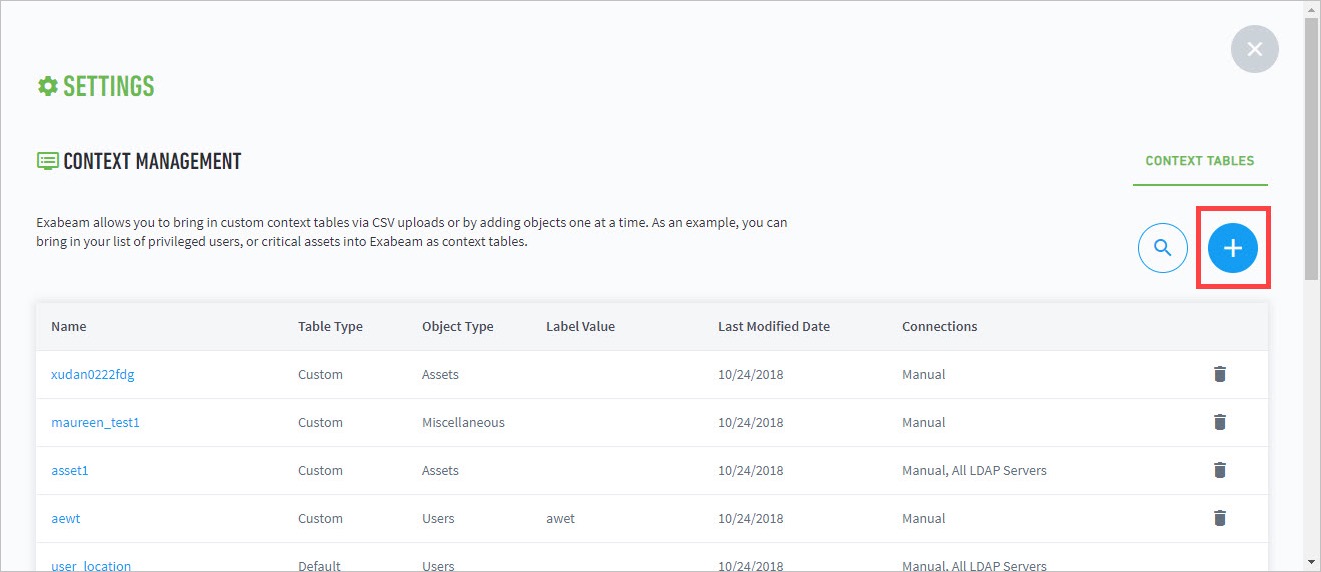
In this example, we use these settings:
Name –
useraccountcontrol_userObject Type –
UsersType –
Key ValueLabel Assignment –
Automatic Assignment from value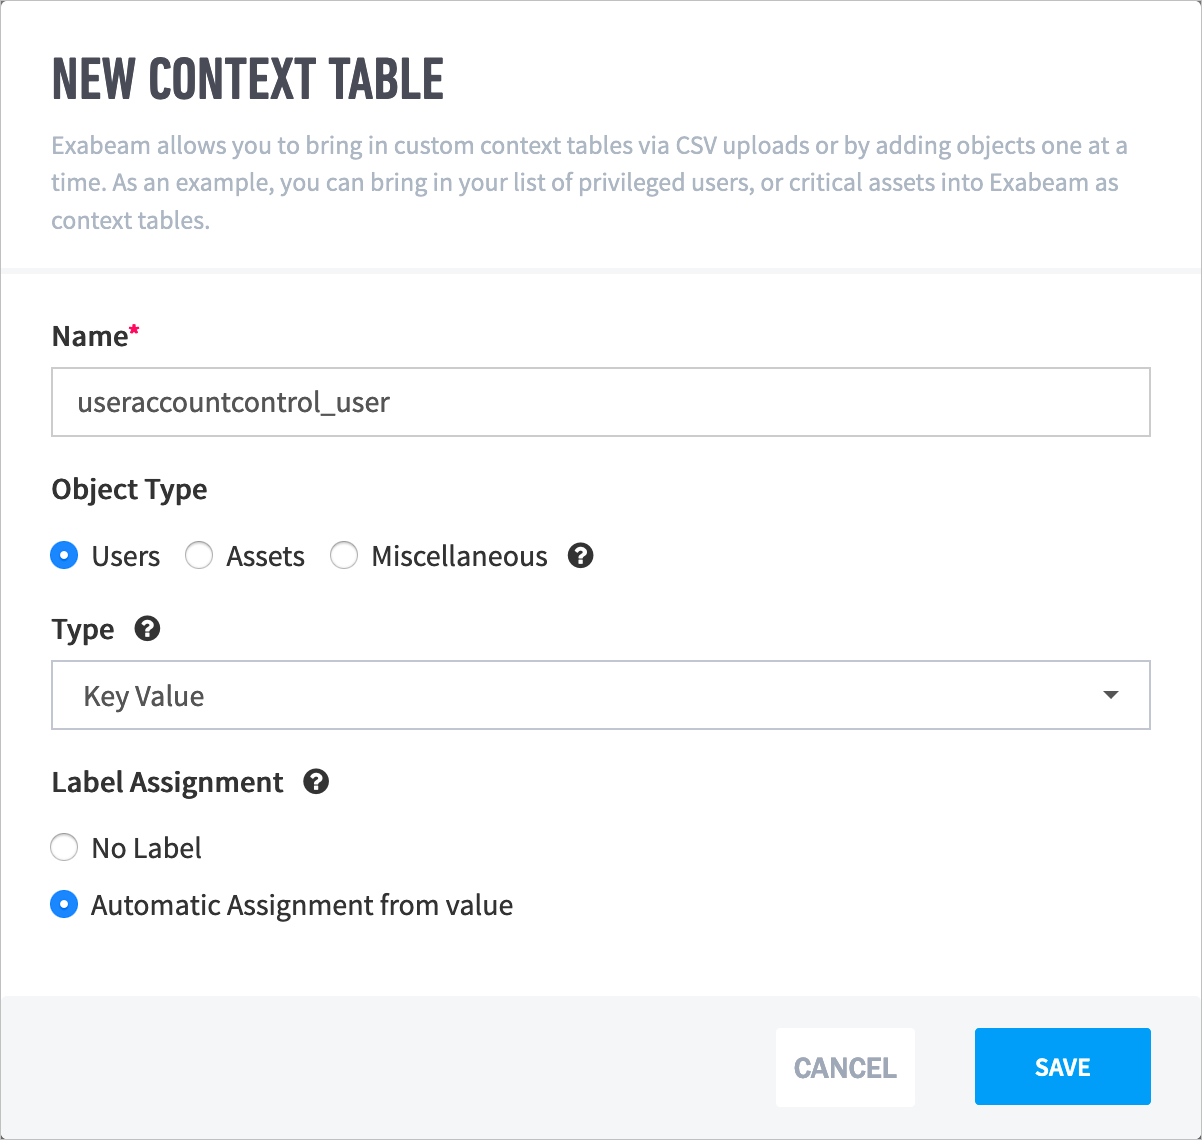
Click Save.
Click No Label if you do not want to add a label to matching records during parsing or filtering.
The context table now appears in the Context Management tables list.
Select the name of the context table you created in Step 4 to configure it with values.

After clicking on
useraccountcontrol_useryou will be presented with the setup page for theuseraccountcontrol_usercontext table.Click + Add Connection to connect the context table to an LDAP domain server.
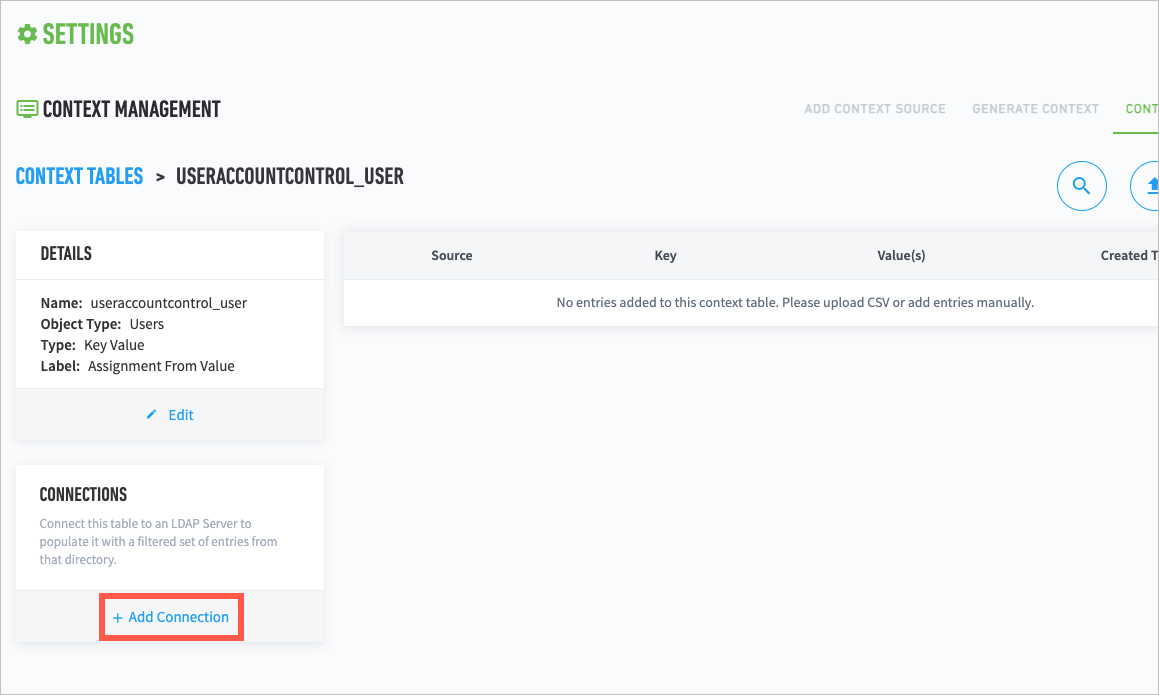
Select the LDAP Server(s), Key, and Value to populate the context table. Optionally, filter the attribute source with conditions by clicking ADD CONDITION.
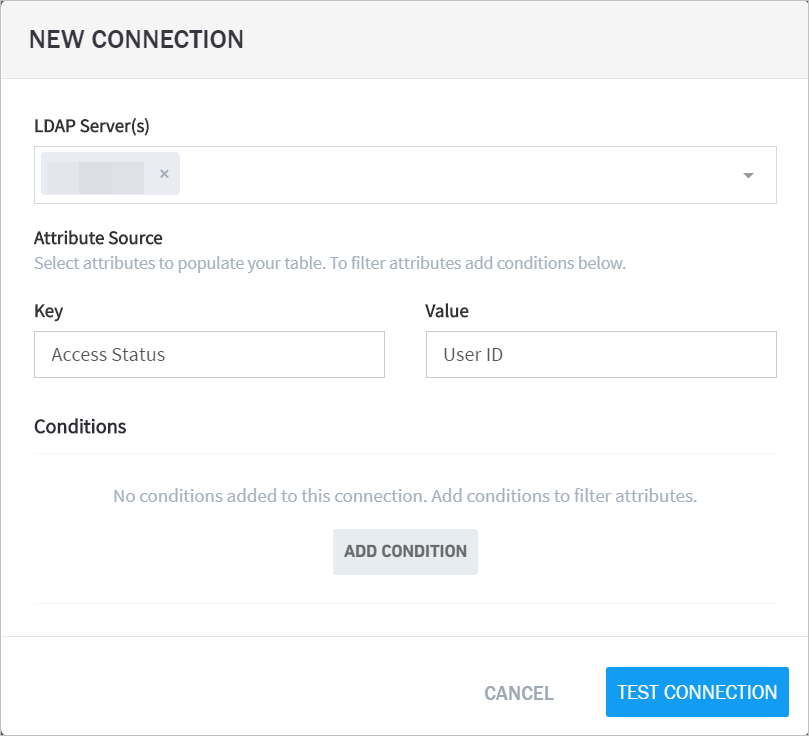
Click TEST CONNECTION to view and validate the test results, and then click SAVE.
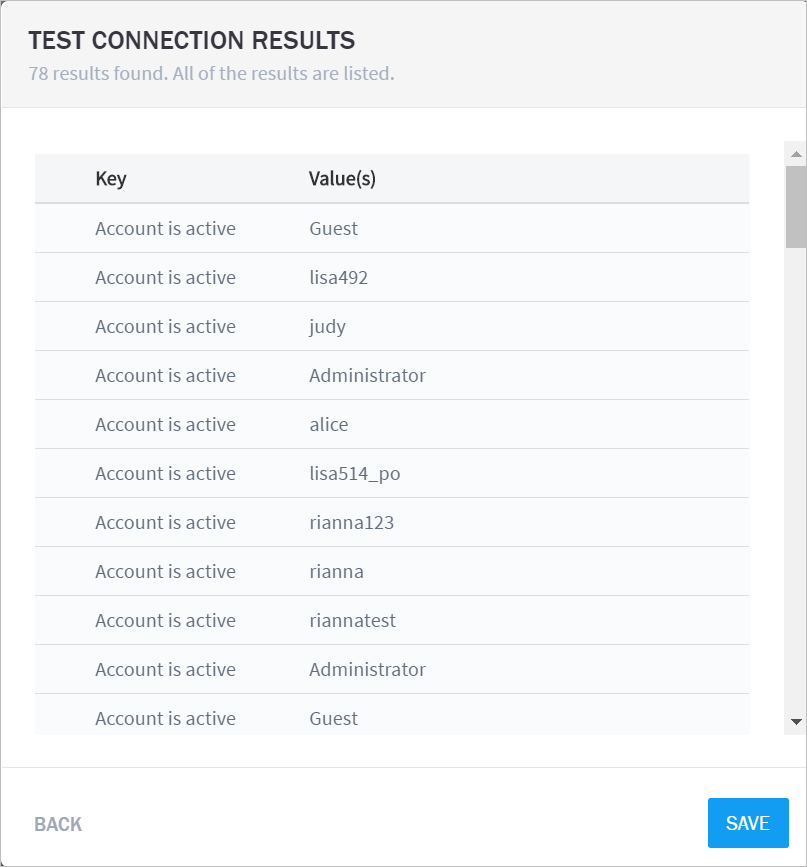
Once context has been integrated, it is displayed in the table. You can use the lookup table in rules as required.
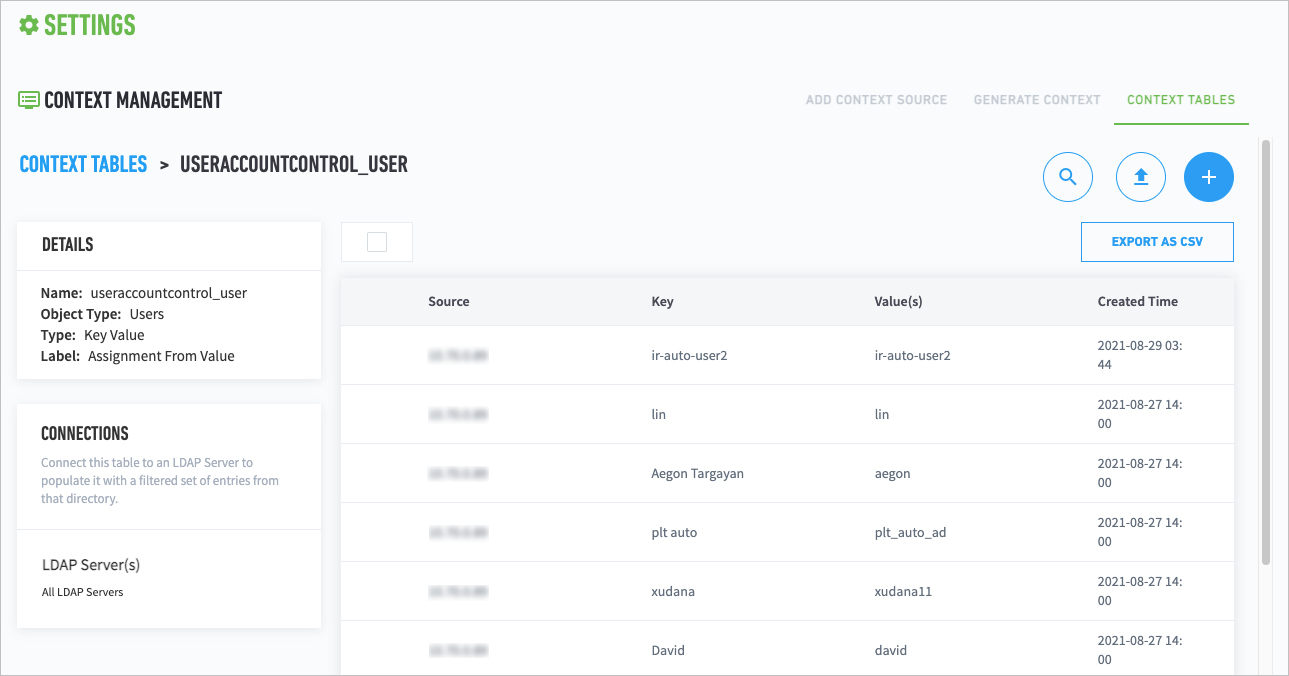
For assistance in creating custom context tables, contact Exabeam Customer Success by opening a case at Exabeam Community
How Audit Logging Works
Specific activities related to Exabeam product administrators and users are logged, including activities within the UI as well as configuration and server changes. This is especially useful for reviewing activities of departed employees as well as for audits (for example, GDPR).
The following events are logged:
|
|
These audit logs are stored in MongoDB. You can find them at exabeam_audit_db inside the audit_events collection. The collection stores the entire auditing history. You cannot purge audit logs or set retention limits.
Audit Log Retention
Hardware and Virtual Deployments Only
The Exabeam audit logs are activity logs for user and asset activity in your organization. The logs are held for 90 days by default and retention can be extended up to 365 days.
Retention time is found in /opt/exabeam/config/common/web/custom/application.conf, where webcommon.audit.retentionPeriod determines the number of days logs are held. The range may be 1 to 365 days.
Send Advanced Analytics Activity Log Data via Syslog
Note
The information in this section applies to Advanced Analytics versions i60–i62.
Access activity data via Syslog. Audit logs of administrative and analyst actions can be forwarded to an existing SIEM or Data Lake via Syslog. Exabeam sends the Advanced Analytics activity data every five minutes.
Note
Advanced Analytics activity log data is not masked or obfuscated when sent via Syslog. It is your responsibility to upload the data to a dedicated index which is available only to users with appropriate privileges.
To access activity data via Syslog:
Navigate to Settings > Log Management > Incident Notification.
Edit an existing Syslog destination, or create a new Syslog destination.
Configure any applicable Syslog settings.
After completing the applicable fields, click TEST CONNECTION.
If the test fails, validate the configured fields and re-test connectivity until successful.
If the test succeeds, continue to the next step.
Click the AA/CM/OAR Audit checkbox.
Click Add Notification.
Starting the Analytics Engine
Once the setup is complete, the administrator can start the Exabeam Analytics Engine. The engine will start fetching the logs from the SIEM, parsing, and then analyzing them. On the Settings page, go to Admin Operations then Exabeam Engine to access controls.
Actions can be restarted from a specific point in time - Exabeam will re-fetch and reprocess all the logs going forward from that time. Note that date and time is given in UTC and starts at epoch (i.e. 00:00:00 hour).
When Ingest Log Feeds (and logs are selected) or Restart Processing is selected, a settings menu is presented.
Restart the engine – Select this option if this is the first time the engine is run.
Restart from the initial training period – Restart engine using data initially collected.
Restart from a date – Reprocess based on specific date (UTC).
Additional Configurations
Configure Static Mappings of Hosts to/from IP Addresses
Hardware and Virtual Deployments Only
Note
To configure this feature, please contact your Technical Account Manager.
You can configure static mappings from hosts to IP addresses, and vice versa. This is especially useful for mapping domain controllers (DCs). Since DCs do not often change IPs, you can tie the DC hostname to a specific IP address. Additionally, if there is user activity that isn't tied to a hostname but is tied to an IP address, then you can map the user to their specific, static IP address. This helps maintain and enrich information in events that may be lost or unknown since the system cannot tie events to dynamic IP addresses.
Map IP addresses to hosts
Add them to the file: /opt/exabeam/data/context/dynamic_objects/static_ip_host_mapping.csv
CSV Format: [ip], [host]
Map hosts to IP addresses
Add them to the file: /opt/exabeam/data/context/dynamic_objects/static_host_ip_mapping.csv
CSV Format: [host], [ip]
Associate Machine Oriented Log Events to User Sessions
Hardware and Virtual Deployments Only
Proxy and other generic sequence events (such as, web, database, file activity, endpoint) as well as some security and DLP alerts may generate logs that contain only machine names or IP addresses without the user names. In Advanced Analytics , you can automatically associate these events with users by IP/host-to-user mapping.
Note
This feature is currently only available for sequence events in multi-node deployments.
User-Host/IP Association
Exabeam will create an IP/host-to-user association based on specific configurable events. (See example below.) The logic to associate users and hosts is flexible and is configurable by using the UserPresentOnHostIf parameter. For example, you can choose to associate a user and host in Kerberos logon events only if the IP is in a specific network zone.
The configuration also allows you to associate the user with any field based on event type. For example, you can associate the user in a Kerberos logon event with dest_host (destination host) and dest_ip (destination IP), and the user in a remote-access event with src_host (source host) and src_ip (source IP). The user of a remote logon event can be associated with both src_host and dest_host because the events indicates they are present on both.
User-Host Example
The example configuration below shows an association between user and IP event. Edits are made to /opt/exabeam/config/custom/custom_exabeam_config.conf:
UserPresentOnHostIf {
 kerberos-logon = {
  Condition = "not (EndsWith(user, '$') OR InList(user, 'system', 'local service', 'network service','anonymous logon'))"
  UserPresentOn = ["dest_host", "dest_ip"]
 }
 remote-logon = {
  Condition = "not (EndsWith(user, '$') OR InList(user, 'system', 'local service', 'network service','anonymous logon'))"
  UserPresentOn = ["dest_host", "src_host", "dest_ip", "src_ip"]
 }
 remote-access = {
  Condition = "InList(ticket_options, '0x40800000', '0x60810010') && not (EndsWith(user, '$') OR InList(user, 'system', 'local service', 'network service',
'anonymous logon'))"
  UserPresentOn = ["src_host", "src_ip"]
 }
}
After editing the configuration file, restart services to apply changes:
exabeam-analytics-stop
exabeam-analytics-start
User-Event Association
Based on the host/IP-to-user association described above, Exabeam can associate an event with a host/IP to a user. This is done via the HostToUserMerger parameter. This configuration enables you to determine which events will utilize the created associations as well as which fields should be used to make it.
A user will be resolved from the host/IP only if one user is associated with this host/IP. If more than one user is associated, no user will be resolved.
User-event example
The example configuration below defines which events should be considered for resolving the user. The events web-activity-allowed and web-activity-denied are event types that will be associated with the user.
HostToUserMerger {
 Enabled = true
 EventTypes = [
  {
   EventType = "web-activity-allowed"
   MergeFields = ["src_host", “src_ip”]
  },
  {
   EventType = "web-activity-denied"
   MergeFields = ["src_host"]
  }
 ]
}
After editing the configuration file, restart services to apply changes:
exabeam-analytics-stop
exabeam-analytics-start
Alert-User Association
The host/IP-to-user association will also be used to resolve the user in security and DLP alerts that do not have one. If one user is on the host during the alert trigger, then the user is associated with a host/IP when resolving a user in security. If there is more than one user on the host, no DLP alerts are associated.
Display a Custom Login Message
You can create and display a custom login message for your users. The message is displayed to all users before they can proceed to login.
To display a custom login message:
On a web browser, log in to your Exabeam web console using an account with administrator privileges.
Navigate to Settings > Admin Operations > Additional Settings.
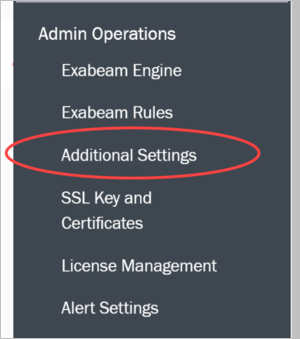
Under Admin Operations, click Login Message.
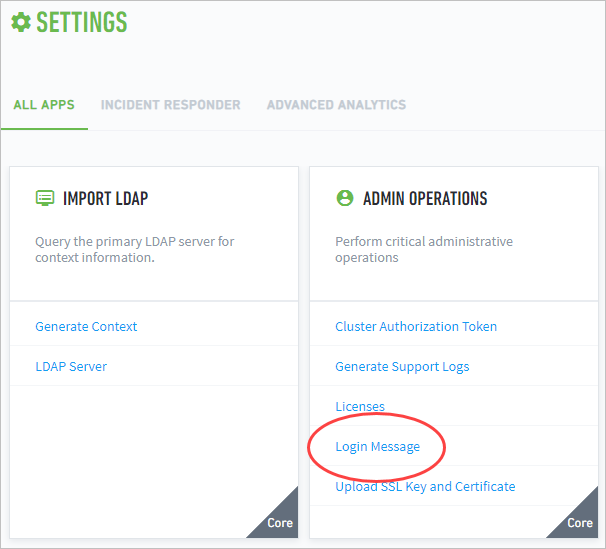
Click EDIT.
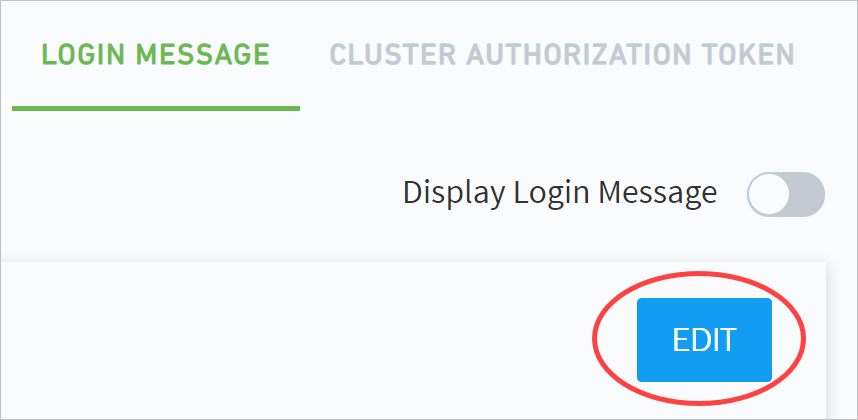
Enter a login message in Message Content.
Note
The message content has no character limit and must follow UTF-8 format. It supports empty lines between text. However, it does not support special print types, links, or images.
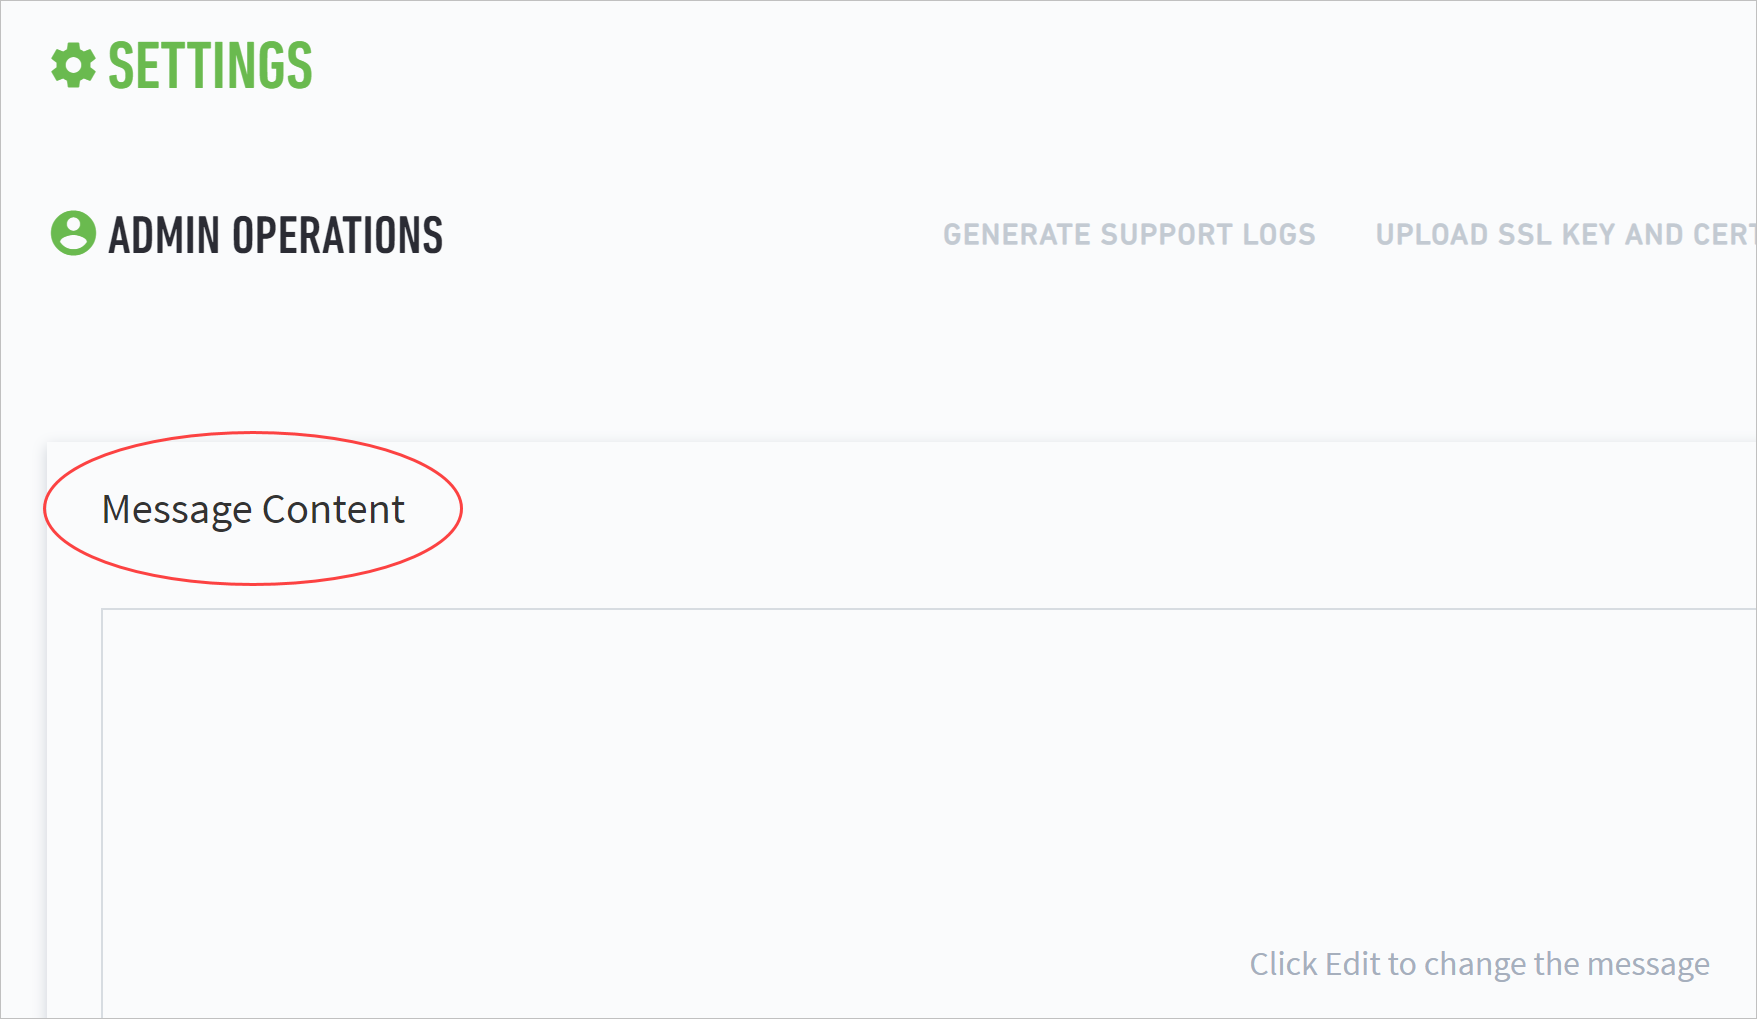
A common type of message is a warning message. The following example is a sample message:
Usage Warning
This computer system is for authorized use only. Users have no explicit or implicit expectation of privacy.
Any or all uses of this system and all files on this system may be intercepted, monitored, recorded, copied, audited, inspected, and disclosed to an authorized site. By using this system, the user consents to such interception, monitoring, recording, copying, auditing, inspection, and disclosure at the discretion of the authorized site.
Unauthorized or improper use of this system may result in administrative disciplinary action and civil and criminal penalties. By continuing to use this system you indicate your awareness of and consent to these terms and conditions of use. LOG OFF IMMEDIATELY if you do not agree to the conditions stated in this warning.
Note
This sample warning message is intended to be used only as an example. Do not use this message in your deployment.
Click SAVE.
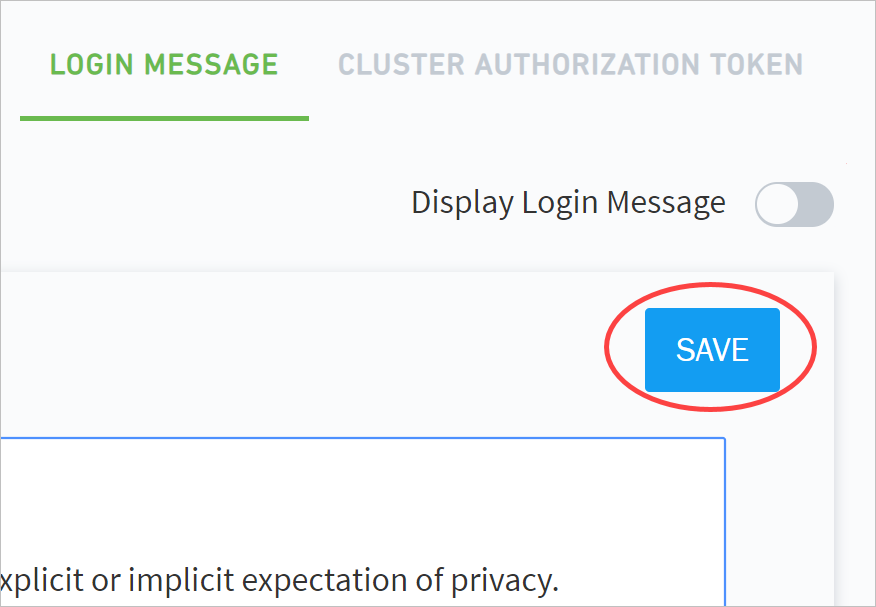
Click the Display Login Message toggle to enable the message.
Note
You can hide your message at any time without deleting it by disabling the message content.
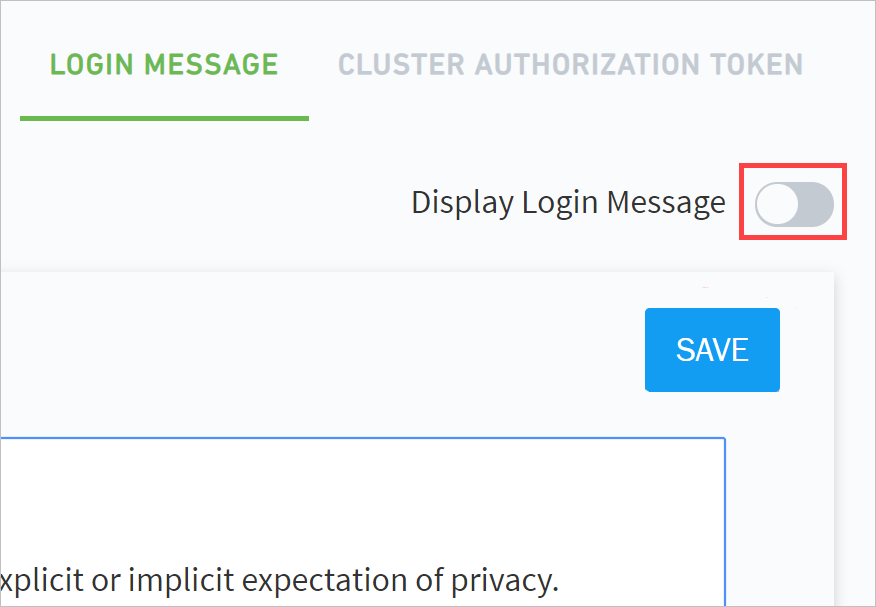
Your custom login message is now shared with all users before they proceed to the login screen.
 |
Configure Threat Hunter Maximum Search Result Limit
Hardware and Virtual Deployments Only
You can configure the maximum search result limit when using Threat Hunter’s search capabilities. By default, the result limit is set to 10,000 sessions.
Note
To configure this feature, please contact your Technical Account Manager.
The default result limit is located in the application_default.conf file at /opt/exabeam/config/tequila/default/application_default.conf.
All changes should be made to
/opt/exabeam/config/tequila/custom/application.conf.
To configure the default result limit, enter an acceptable value in place of 10000 at tequila.data.criteria:
finalQueryResultLimit = 10000
There is no restriction on the limit value, however, for very large intermediate results you should input at least 30,000 sessions.
Change Date and Time Formats
Hardware and Virtual Deployments Only
Change the way dates and times are displayed in Advanced Analytics, Case Manager, and Incident Responder.
Note
To configure this feature, please contact your Technical Account Manager.
Dates and times may appear slightly different between Advanced Analytics, Case Manager, and Incident Responder.
Navigate to
/opt/exabeam/config/tequila/custom/, then open theapplication.conffile.Enter a supported format value:
To configure how dates are formatted, enter a supported value after
tequila.data.criteria.dateFormat =, in quotation marks:tequila.data.criteria.dateFormat = "[value]"
To configure how times are formatted, enter a supported value after
tequila.data.criteria.timeFormat =, in quotation marks:tequila.data.criteria.timeFormat = "[value]"
Save the
application.conffile.Restart Advanced Analytics Restful Web Services:
web-stop;
web-start
Supported Date and Time Formats
View all the ways you can format dates and times displayed in Advanced Analytics, Case Manager, and Incident Responder.
Date Formats
By default, dates are displayed in the "default" format, DD Month Year; for example, 27 September 2012.
Depending on the format, some areas of the product, like watchlists and user or asset profiles, may display a shortened or year-less version.
Value | Format | Example | Shortened Example | Year-less Example |
|---|---|---|---|---|
"default" | DD Month YYYY | 27 September 2012 | 27 Sep 2012 | 27 Sep |
"default-short" | DD Mo YYYY | 27 Sep 2012 | n/a | 27 Sep |
"default-num" | DD-MM-YYYY | 27-09-2012 | n/a | 27-09 |
"default-num-short" | DD-MM-YY | 27-09-12 | n/a | 27-09 |
"us" | Month DD YYYY | September 27 2012 | Sep 27 2012 | Sep 27 |
"us-short" | Mo DD YYYY | Sep 27 2012 | n/a | Sep 27 |
"us-num" | MM-DD-YYYY | 09-27-2012 | n/a | 09-27 |
"us-num-short" | MM-DD-YY | 09-27-12 | n/a | 09-27 |
"ISO" | YYYY-MM-DD (ISO 8601) | 2012-09-27 | n/a | 09-27 |
"ISO-slash" | YYYY/MM/DD | 2012/09/27 | n/a | 09/27 |
Time Formats
By default, times are displayed in 24hr format.
Value | Format | Notes |
|---|---|---|
"24hr" | 13:45 | This is the default value in the configuration file. For chart labels, the time appears as 13 instead of 1pm. Minutes aren't displayed. |
"12hr" | 1:45pm | Leading zeros aren't displayed. For example, the time appears as 1:45pm instead of 01:45pm. Some areas of the product use a and p to indicate am and pm. |
Set Up Machine Learning Algorithms (Beta)
Hardware and Virtual Deployments Only
Machine Learning (ML) algorithms require a different infrastructure than regular deployments. This infrastructure is necessary to run data science algorithms. ML infrastructure will install two new docker-powered services: Hadoop YARN and Advanced Analytics API.
Note
These machine learning algorithms are currently available as beta features.
Installation is only supported on EX4000 powered single- or multi-node deployments running Advanced Analytics i35 or later due to the high system resources needed for these jobs. ML infrastructure is a requirement for algorithms that drive the Personal Email Detection, Daily Activity Change Detection, and Windows Privileged Command Monitoring features.
Install and Deploy Machine Learning
Installation is done through the unified installer by specifying the ml product after Advanced Analytics has already been deployed. The build version needs to be identical to the version used for Advanced Analytics.
When asked for the docker tag of the image to be used for ML, make sure to use the same tag which was used for Advanced Analytics.
Optionally, run this process in screen:
screen -LS [yourname]_[todaysdate]Run the following script:
/opt/exabeam_installer/init/exabeam-multinode-deployment.shSelect your inputs based on the following prompts:
Add Product(s)
Which product(s) do you wish to add? ['ml', 'lms', 'ir']: ml
What is the docker tag for new ml images? <AA version_build>
Would you like to override the default docker_gwbridge IP/CIDR? n
Do you want to setup disaster recovery? n
Stop the Log Ingestion Engine and the Analytics Engine at the shell, make configuration changes, and then restart services.
exa-lime-stop; exa-martini-stopEdit
EventStoreparameters in/opt/exabeam/config/custom/custom_exabeam_config.conf:EventStore.Enabled = true EventStore.UseHDFS = true
Navigate to
/opt/exabeam/config/custom/custom_exabeam_config.confand make sure that Event Store is disabled:EventStore.Enabled = false
Restart the DS server, and then start the Log Ingestion Engine and the Analytics Engine:
ds-server-stop; ds-server-start exa-lime-start; exa-martini-start
Check the state of the DS server by inspecting the log
/opt/exabeam/data/logs/ds-server.log.Check the DS server logs to ensure the algorithms have been enabled.
grep enabled /opt/exabeam/data/logs/ds-server.log
You should be able to see a list of all algorithms, along with their statuses and configurations.
Note
Navigate to
/opt/exabeam/ds-server/config/custom/algorithms.confand setEnabled = trueon the DS algorithms you want to implement. If the customalgorithms.confdoes not contain the DS algorithm you want to implement, copy over the corresponding algorithm block from/opt/exabeam/ds-server/config/default/algorithms_default.conf.Navigate to
/opt/exabeam/data/logsand enableEventStore:} EventStore { UserHDFS = true Enabled = true }Restart the Log Ingestion Engine and the Analytics Engine to apply any updates:
exa-lime-stop exa-lime-start exa-martini-stop exa-martini-start
Continue to each module to complete your configurations
Configure Machine Learning
All Machine Learning algorithms use EventStore and expect the data to be stored on HDFS, which must be manually activated by adding this line to /opt/exabeam/config/custom/custom_exabeam_config.conf:
EventStore.Enabled = true
EventStore.UseHDFS = true
All other algorithm-specific configurations should be done in /opt/exabeam/ds-server/config/custom/algorithms.conf.
The defaults for each algorithm can be found in /opt/exabeam/ds-server/config/default/algorithms_default.conf. As with other configuration changes, only the options which are changed should be overwritten in the custom algorithms.conf file.
LogFetcher.LogDir in /opt/exabeam/config/custom/custom_exabeam_config.conf is the path for Martini to find events. DS algorithms use this path as well. Therefore, make sure that you have SDK.EventStoreHDFSPathTemplates in /opt/exabeam/ds-server/config/default/script.conf, which corresponds to LogFetcher.LogDir.
For example:
/opt/exabeam/ds-server/config/default/script.confEventStoreHDFSPathTemplates = [
"hdfs://hadoop-master:9000/opt/exabeam/data/input/(YYYY-MM-dd)/(HH).*.evt.gz"
]
/opt/exabeam/config/custom/custom_exabeam_config.conf
LogFetcher {
UseHDFS = true
LogDir = "/opt/exabeam/data/input"
# this values by default, you don’t have to override it in this config
HDFSHost = "hadoop-master"
HDFSPort = 9000
}
Note
You can free up space by removing data in hdfs://hadoop-master:9000/opt/exabeam/data/output, which is not required for DS deployments.
Upgrade Machine Learning Deployment
ML deployments have to be updated together with the underlying Advanced Analytics version. If Machine Learning is installed, the upgrade tool will ask both for a tag for Advanced Analytics and a tag for ML. Make sure to use the same tag for Advanced Analytics and ML. The format for the tag is <version>_<build #>.
Upgrading ML Custom Configurations
In i50.6 we have changed the source of processing events. Now, EventStore is no longer needed and should not be enabled to run DS algorithms. Instead, all ML algorithms read events from LogDir. Therefore, if you are upgrading from a version pre-i50.6, make sure EventStore.Type has been removed from these files:
ds-server/config/default/algorithms_default.conf
ds-server/config/custom/algorithms.conf
ds-server/config/default/script.conf
If you have custom settings, you must also make sure that you edit them correctly in order to preserve them. Custom configurations are not automatically updated.
See details on the required edits below:
In script.conf
Make sure that you remove EventStore.Type, and change EventStoreHDFSPathTemplates accordingly. Instead of an output generated by Martini, you should connect it to the Lime output.
Previous version of script.conf:
{
EventStoreHDFSPathTemplates = [
"hdfs://hadoop-master:9000/opt/exabeam/data/output/(YYYY-MM-dd)/(HH).[type]-events-{m,s?}.evt.gz",
"hdfs://hadoop-master:9000/opt/exabeam/data/output/(YYYY-MM-dd)/(HH).[type]-events-{m,s?}.[category].evt.gz"
]
EventStore {
#Event type. Can be Raw, Container or Any
Type = "Container"
#Event category. All available categories are in event_categories.conf
Categories = ["all"]
}
New version of script.conf:
{
EventStoreHDFSPathTemplates = [
"hdfs://hadoop-master:9000/opt/exabeam/data/input/(YYYY-MM-dd)/(HH).*.[category].evt.gz"
]
EventStore {
#Event category. All available categories are in event_categories.conf
Categories = ["all"]
}
To check that everything runs correctly, check custom_exabeam_config.confLogFetcher.LogDir for a path to events folder: /opt/exabeam/config/custom/custom_exabeam_config.conf
LogFetcher {
UseHDFS = true
# this path to events folder in HDFS should be the same as in
# script.conf EventStoreHDFSPathTemplates, main difference
LogDir = "/opt/exabeam/data/input"
# this values by default, you don’t have to override it in this config
HDFSHost = "hadoop-master"
HDFSPort = 9000
}
This path should be the same as in script.conf EventStoreHDFSPathTemplates:
EventStoreHDFSPathTemplates = [
"hdfs://hadoop-master:9000/opt/exabeam/data/input/(YYYY-MM-dd)/(HH).*.[category].evt.gz"
]
LogDir = "/opt/exabeam/data/input"
In algorithms.conf
If you customized EventStore.EventType for the personal-email-identification algorithm, daily-activity-change algorithm, or wincli-command-centric algorithm, then you must ensure that you remove parameter EventStore.EventType from the configuration:
Previous version of algorithms.conf:
personal-email-identification {
...
EventStore {
Type = “Container”
Categories = ["alerts"]
}
...
}
New version of algorithms.conf:
personal-email-identification {
...
EventStore {
Categories = ["alerts"]
}
...
}
To check that everything runs correctly, check the log files after launching exabeam-analytics. AA-API: /opt/exabeam/data/logs/aa-api.log DS server: /opt/exabeam/data/logs/ds-server.log # spark log files for all algorithms are located in the folder: /opt/exabeam/data/logs/ds-server Exabeam: /opt/exabeam/data/logs/exabeam.log Also, you can check Processed events: tail -f -n 300 /opt/exabeam/data/logs/exabeam.log | grep Processed You should not see “0 events” for Processed events. If “0 events” persists, then that means that the paths to event files are configured improperly. If you run into this issue, check: /opt/exabeam/config/custom/custom_exabeam_config.conf LogFetcher.LogDir. You should have the same specifications in the HDFS folder as in LogFetcher.LogDir. Also, the folder should contain folders with date and files, such as 00.*.evt.gz - 23.*.evt.gz.
Checking ML Status
You can check the status of DS algorithms in the mongo data_science_db. There is a separate collection with the states for each algorithm. You can also check the progress in the Martini logs: tail -f /opt/exabeam/data/logs/exabeam.log
Deactivate ML
To deactivate all ML components, shut down the respective services:
ds-server-stop
aa-api-stop
hadoop-yarn-stop
Detect Daily Activity Change
Daily activity change detection identifies significant changes in a user's overall behavior across both sessions (eg: Windows, VPN) and sequence events (eg: web activity, endpoint activity).
In addition to examining individual activities, Advanced Analytics also looks at anomalies in the overall patterns of the daily activities of a user. For example, taken individually it might not be anomalous for a user to access a server remotely that has been accessed before or download files from Salesforce, but a combination of activities could be anomalous based on the user's daily activity behavior.
The daily activity change will generate an event. If today's behavior is significantly different from past behavior, then that event will also generate a triggered rule (DAILY-ACTIVITY-CHANGE) for the event. The risk score from daily activity change is transferred to the user's session just like any other web or endpoint sequence.
Daily activity change detection is available as a beta capability and by default the feature is turned off.
Configuration Prerequisites
Ensure that you have the Machine Learning infrastructure (beta) installed. If you do not, follow the instructions in the section Machine Learning Algorithms (Beta). Then return to these configuration instructions.
Configuration
Machine Learning Algorithms (Beta) must be deployed in order for the feature to work. Installation is done through the unified installer by specifying the ml product. The build version needs to be identical to the version used for Advanced Analytics.
To enable Daily Activity Change add the following line to
/opt/exabeam/ds-server/config/custom/algorithms.conf:Algorithms.daily-activity-change.Enabled = true
To enable Daily Activity Change, in
/opt/exabeam/ds-server/config/custom/algorithms.confset:daily-activity-change { ... Enabled = trueEventStore must be disabled:
Make sure that in
/opt/exabeam/config/custom/custom_exabeam_config.conf:EventStore.Enabled = falseEventStore must also be active for the feature to work:
Add the following lines to
/opt/exabeam/config/custom/custom_exabeam_config.conf:EventStore.Enabled = true EventStore.UseHDFS = true
Daily Activity Change Parameters
You can customize configuration parameters for the algorithm under daily-activity-change within algorithms.conf (/opt/exabeam/ds-server/config/custom/algorithms.conf). Refer to algorithms_default.conf (/opt/exabeam/ds-server/config/default/algorihtms_default.conf) for default settings.
VarianceThreshold = 0.95– variance threshold used by PCAResidueThreshold = 1– above this threshold is considered anomalousMinTrainingPeriod = 30– a minimum period of historic data required to detect daily activity changeTrainingPeriod = 90– data from eventTime - trainingPeriod to eventTime will be taken to train the algorithmRetentionPeriod = 180– keep historic data for this periodRuleId = "DAILY-ACTIVITY-CHANGE"– in mongo triggered_rule_db triggered_rule_collection all triggered rules by this algorithm will be saved with rule_id = “DAILY-ACTIVITY-CHANGE”RuleEventType = "daily-activity"– in mongo triggered_rule_db.triggered_rule_collection all triggered rules by this algorithm will be saved with rule_event_type = “daily-activity”DistinctCountIntervalMs = 600000– time in events from EventStore will be rounded down to 600000 Ms = 10 minutes.For example:1406877142000 = Friday, August 1, 2014 7:12:22 AM
Becomes:1406877000000 = Friday, August 1, 2014 7:10:00 AM
Verify Intermediate Results
This algorithm saves results in the Mongo database. You can check database ds_dac_db. It should have two collections: event_weight and user_activity. They should not be empty while processing.
You can also check triggered_rule_db in collection triggered_rule_collection. There should be some events with rule_id = DAILY-ACTIVITY-CHANGE if there are suspicious users.
Enable Daily Activity Change
Ensure that you have the installed. If you do not, follow the instructions in the section Machine Learning Infrastructure. Then return to these configuration instructions.
Machine Learning Infrastructure must be deployed in order for the feature to work. Installation is done through the unified installer by specifying the
mlproduct. The build version needs to be identical to the version used for Advanced Analytics.Add the following line to
/opt/exabeam/ds-server/config/custom/algorithms.conf:Algorithms.daily-activity-change.Enabled = true
EventStore must also be active for the feature to work.
Add the following lines to
/opt/exabeam/config/custom/custom_exabeam_config.conf:EventStore.Enabled = true EventStore.UseHDFS = true
Monitor Windows Privileged Commands
Note
To configure this feature, please contact your Technical Account Manager.
Advanced Analytics now identifies anomalous behaviors around Windows privileged commands performed via command line by privilege users. Attackers move through a network using native Windows commands in order to collect information, perform reconnaissance, spread malware, etc. The pattern of the Windows command usage by attackers is statistically and behaviorally different from that of legitimate users and therefore it is possible to detect anomalous behaviors involving command execution. Exabeam performs an offline machine learning algorithm to detect anomalous Windows command execution and assigns risk scores to users performing them.
Associated Rules:
ID | Name | Description |
|---|---|---|
EPA-F-CLI | Suspicious Windows process executed | A native Windows command has been executed which is suspicious for this type of user. For example, a non-technical user is executing complicated powershell commands. Check with the user if they are aware of this and who/what is behind it. |
Configuration Prerequisites
Ensure that you have the Machine Learning infrastructure (beta) installed. If you do not, follow the instructions in the section Machine Learning Algorithms. Then return to these configuration instructions.
Configuration
Configuration changes should be made in /opt/exabeam/config/custom/exabeam_custom.config. To enable CLI detection set Enabled = true.
Field Descriptions:
Enabled– Set to true to enable detection; set to false to disable.CmdFlagsRegex– Regular expressions used for flag extraction.CasheSize– Number of process IDs to be stored.CacheExpirationTime– The number of days after whichCacheSizeis reset.Commands– List of the CLI commands that the algorithm will monitor.
Machine Learning Algorithms (Beta) must be deployed in order for the feature to work. Installation is done through the unified installer by specifying the
mlproduct. The build version needs to be identical to the version used for Advanced Analytics.To enable Windows Command Line Algorithm, in
/opt/exabeam/ds-server/config/custom/algorithms.confset:wincli-command-centric { ... Enabled = trueCommandsandCmdFlagsRegexshould be the same as in thecustom_exabeam_config.conf.EventStore must be disabled:
Make sure that in
/opt/exabeam/config/custom/custom_exabeam_config.conf:EventStore.Enabled = false
Windows Privileged Command Monitoring Parameters
You can customize configuration parameters for the algorithm under wincli-command-centric within algorithms.conf (/opt/exabeam/ds-server/config/custom/algorithms.conf). Refer to algorithms_default.conf (/opt/exabeam/ds-server/config/default/algorihtms_default.conf) for default settings.
TrainingPeriod = 40– data fromtrainingPeriodtoeventTimewill be taken to train the algorithmBinThresholds– bins with size above the threshold are ignored. By default:BinThresholds { flag = 100 directory = 100 parent = 100 }Commands = ["at.exe", "bcdedit.exe", "cscript.exe", "csvde.exe"...]– list of the CLI commands that the algorithm will monitorCmdFlagsRegex = "\\s(--|-|/)[a-zA-Z0-9-]+"– regular expressions used to extract flags from the commandHistoricStatsCollection = "command_centric_historic_stats"– collection inds_wincli_dbwhich will retain statistics for Martini rule behaviour
Verify Intermediate Results
To verify the intermediate results, you can look for data in ds_wincli_db collections: command_centric_historic_stats
command_centric_daily_stats
Support Information
This feature is supported in single and multi-node environments on the EX4000 but not on the EX2000 single-node environment.
Detect Phishing
Hardware and Virtual Deployments
Note
To configure this feature, please contact your Technical Account Manager.
Advanced Analytics now detects users who visit suspected phishing websites. Phishing often starts with a domain name string that has the look-and-feel of a legitimate domain, but is not. Phishers target the Internet's most recognizable domain names (google.com, yahoo.com, etc.) and make slight changes on these domain names in order to fool unassuming eyes. Phishing detection uses lexical analysis to identify whether a domain is a variant of popular domain names. In addition, it also checks URLs against a white-list of popular legitimate domains and a blacklist of identified suspicious domains. It also uses substring searches to identify domains that contain the domain name of a popular site as a substring within the suspect domain. For example, www.gmail.com-hack.net contains the recognizable "gmail.com" within the top level domain.
Associated Rules:
ID | Name | Description |
|---|---|---|
WA-Phishing | Web activity to a phishing domain | Web activity to a suspected phishing domain has been detected. The domain is suspected as Phishing based on Exabeam data science algorithms. |
Configuration
Configuration should be made in /opt/exabeam/config/custom/custom_exabeam_config.conf.
To enable Phishing Detection, set PhishingDetector.Enabled = true.
Support Information
Supported in single and multi-node environments with EX2000 and EX4000.
Restart the Analytics Engine
Administrators typically need to restart the Analytics Engine when configuration changes are made to the system such as adding new log feeds to be analyzed by Exabeam or changing risk scores to an existing rule.
Exabeam will store time-based records in the database for recovery and granular reprocessing. The histograms and the processing state of the Exabeam Analytics Engine are time-stamped by week and stored in the database. This allows the Exabeam Analytics Engine to be able to go back to any week in the past and continue processing.
To illustrate, let's say that the Exabeam Analytics Engine started processing logs from January 1, 2016, and is currently processing today, April 15, 2016. The administrator would like to ingest new Cloud application log feeds into Exabeam and start reprocessing from a time in the past, say March 30, 2016. The administrator would stop the Exabeam Analytics Engine and then restart processing from March 30, 2016. The system will go back to find the weekly boundary where the state of the nodes and the models are consistent - which might mean a few days before March 30, 2016 - and start processing all the configured log feeds from that point in time.
Navigate to Settings > Admin Operations > Exabeam Engine.
Upon clicking Restart Processing, the Processing Feeds page appears. You can choose to:
Restart the engine from where it left off.
Restart and reprocess all the configured log feeds from the initial training period
Restart from a specific date. The Analytics Engine will choose the nearest snapshot available for the date chosen and reprocess from this date.
Note
Reprocessing can take a considerable amount of time depending on the volume of data that needs to be reprocessed.
Caution
Upon clicking Process, a success page loads. If you are reconfiguring a secondary appliance, DO NOT click Start Exabeam Engine on the success page. Rather, please contact your administrator.
Note
If a Log Ingestion Engine restart is required when you attempt to restart the Analytics Engine, you will be prompted with a dialog box to also restart the Log Ingestion Engine. Advanced Analytics will intelligently handle the coordination between the two Engines. The Log Ingestion Engine will restart from the same time period as the Analytics Engine. You can choose to cancel the restart if you would like the Log Ingestion Engine to finish its current process, but this will also cancel the Analytics Engine restart procedure.
If you have made configuration changes then the system will check for any inadvertent errors in the configuration files before performing the restart. If the custom configuration validation does identify errors in the config files then it will list the errors and not perform the restart. Otherwise, it will restart the analytics engine as usual.
Restart Log Ingestion and Messaging Engine (LIME)
Restart LIME when you change how you ingest data, like when you add new log sources or feeds.
In the navigation bar, click the menu
 , select Settings, then select Analytics.
Under Admin Operations, select Exabeam Engine.
Under Exabeam Log Ingestion, click Ingest Log Feeds, then click Next.
Select Restart the engine, click Next.
Click Ingest feeds, then click Confirm.
Custom Configuration Validation
Hardware and Virtual Deployments Only
Any edits you make to your Exabeam custom configuration files are validated before you are able to restart the analytics engine to apply them to your system. This helps prevent Advanced Analytics system failures due to inadvertent errors introduced to the config files.
The system validates Human-Optimized Configuration Object Notation (HOCON) syntax, for example, missing a quotes or wrong caps ("SCOREMANAGER" instead of "ScoreManager"). The validation also checks for dependencies such as extended rules in custom config files that are missing dependencies within default config files. Some additional supported validation examples are:
Value validity and ranges
Operators
Brackets
Date formats
Rule expressions
Model dependencies
If found, errors are listed by file name during the analytics engine restart attempt.
From here you can fix the configuration errors, Cancel the modal, and retry the restart.
Only the config files related to Advanced Analytics are validated:
custom_exabeam_config.conf(includes default config)cluster.confcustom_lime_config.confevent_builder.confmodels.confparsers.conf(includes both default and custom)rule_labels.jsonrules.confcustom_event_categories.conf
In addition to helping you troubleshoot your custom config edits, Advanced Analytics also saves the last known working config files. Every time the system successfully restarts, a backup is made and stored for you.
The backups are collected and zipped in /opt/exabeam/config/backup under custom_configuration_backups_martini. All zipped files are named as follows custom_config_backup_<date>_<time> with time in UTC server time. The last ten backups are stored, and the oldest copy is deleted to make room for a new backup.
You may choose to Roll Back to the latest backup if you run into configuration errors that you are unable to fix. If you do so the latest backup is restored and the analytics engine is not restarted.
Advanced Analytics Transaction Log and Configuration Backup and Restore
Hardware and Virtual Deployments Only
For Advanced Analytics clusters with more than one node, the configuration settings of the primary node are by default backed up daily. If the primary node fails, the backups simplify its restoration. The default backups are performed every day at a random time between 07:00 UTC and 10:00 UTC, at which time the primary node's settings are saved to a worker node. For information on changing the backup schedule, see Modify the Primary Node Configuration Backup Schedule.
Rebuilding a failed worker node host (from a failed disk for on on-premise appliance) or shifting a worker node host to new resources takes significant planning. One of the more complex steps and most prone to error is migrating the configurations. Exabeam provides a backup mechanism for layered data format (LDF) transaction log and configuration files to minimize the risk of error. To use the configuration backup and restore feature, you must have:
An active Advanced Analytics worker node
Cluster with two or more worker nodes
Read and write permission for the credentials you will configure to access the base path at the storage destination
A scheduled task in Advanced Analytics to run backup to the storage destination
Note
To rebuild after a cluster failure, it is recommended that a cloud-based backups be used. To rebuild nodes from disk failures, back up files to a worker node or cloud-based destination.
If you want to save the generate backup files to your first worker node, then no further configuration is needed to configure an external storage destination. A worker node destination addresses possible disk failure at the primary node appliance. This is not recommended as the sole method for disaster recovery.
Go to Settings > Additional Settings > Admin Operations > External Storage.
Click Add.
Fill all field and then click TEST CONNECTION to verify connection credentials.
Once a working connection is confirmed Successful, click SAVE.
Go to Settings > Core > Backup & Restore > Backups.
Click the Edit icon to open the Edit Backup dialog box.
Click the Time drop-down list and select a value.
Warning
Time is given in UTC.
Modify any additional fields if needed.
When you are finished, click Save.
A successful backup will place a backup.exa file at /opt/exabeam/data/backup at the worker node. In the case that the scheduled backup fails to write files to the destination, confirm there is enough space at the destination to hold the files and that the exabeam-web-common service is running. (If exabeam-web-common is not running, review its application.log for hints as to the possible cause.)
In order to restore a node host using files store off-node, you must have:
administrator privileges to run tasks a the host
SSH access to the host
free space at the restoration partition at the primary node host that is greater than 10 times the size of
backup.exabackup file
Copy the backup file,
backup.exa, from the backup location to the restoration partition. This should be a temporary work directory (<restore_path>) at the primary node.Run the following to unpack the EXA file and repopulate files.
sudo /opt/exabeam/bin/tools/exa-restore <restore_path>/backup.exa
exa-restorewill stop all services, restore files, and then start all services. Monitor the console output for error messages. See Troubleshooting a Restoration ifexa-restoreis unable to run to completion.Remove
backup.exaand the temporary work directory when restoration is completed.
If restoration does not succeed, the try following below solutions. If the scenarios listed do not match your situation,
Not Enough Disk Space
Select a different partition to restore the configuration files to and try to restore again. Otherwise, review files stored in to target destination and offload files to create more space.
Restore Script Cannot Stop All Services
Use the following to manually stop all services:
source /opt/exabeam/bin/shell-environment.bash && everything-stop
Restore Script Cannot Start All Services
Use the following to manually start all services:
source /opt/exabeam/bin/shell-environment.bash && everything-start
Restore Script Could Not Restore a Particular File
Use tar to manually restore the file:
# Determine the task ID and base directory (<base_dir>) for the file restoration that failed.
# Go to the <base_id>/<task_id> directory and apply following command:
sudo tar -xzpvf backup.tar backup.tgz -C <baseDir>

# Manually start all services.
source /opt/exabeam/bin/shell-environment.bash && everything-start
Reprocess Jobs
Note
The information in this section applies to Advanced Analytics versions i60–i62.
Access the Reprocessing Jobs tab to view the status of jobs (for example, completed, in-progress, pending, and canceled), view specific changes and other details regarding a job, and cancel a pending or in-progress job.
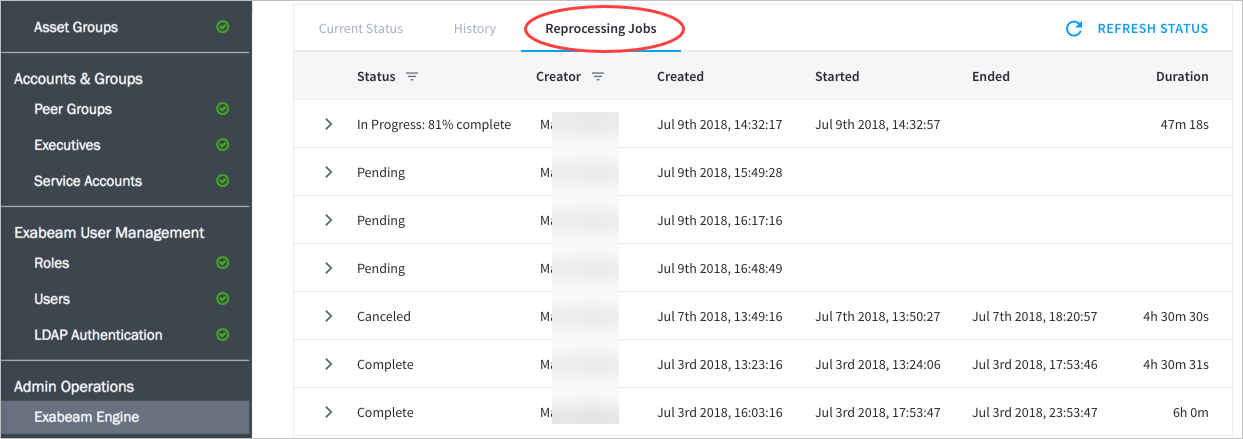
If you wish to cancel a reprocessing job for any reason, select the job in the Reprocessing Jobs table and then click Cancel Job.
Configure Notifications About Reprocessing Job Status Changes
You can configure email and Syslog notifications for certain reprocessing job status changes, including start, end, and failure.
To configure notifications for reprocessing job status changes:
Navigate to Settings > Log Management > Incident Notification.
Select an existing notification or create a new notification. You can choose either Syslog or email.
Select the reprocessing jobs notifications according to your business needs (Job status changes and/or Job failures).
Save your changes.
Re-Assign to a New IP (Appliance Only)
Hardware Deployments Only
Note
These instructions apply to Exabeam appliances only. For instructions on re-assigning IPs in virtual deployments, please contact Exabeam Customer Success by opening a case at Exabeam Community.
Set up a named session to connect to the host. This will allow the process to continue in the event you lose connection to the host.
screen -LS [session_name]
Enter the cluster configuration menu.
source /opt/exabeam_installer/init/exabeam-multinode-deployment.sh
From the list of options, choose
Change network settings.Choose
Change IP of cluster hosts.Choose
Change IP(s) of the cluster - Part I (Before changing IP).You will go through a clean up of any previous Exabeam installations.
Do you want to continue with uninstalling the product? [y/n] yAcknowledge the Exabeam requisites.
**********************************************************************
Part I completed. Nuke successful. Product has been uninstalled.
***Important***
Before running Part II, please perform these next steps below (Not optional!):
- Step 1 (Manual): Update the IPs (using nmtui or tool of choice)
- Step 2 (Manual): Restart network (e.g., systemctl restart network)
**********************************************************************
Please enter 'y' if you have read and understood the next steps: [y/n] y
Open the
nmtuito change IP addresses of each host in the cluster where the IP address will be changed.sudo nmtui
Go to Edit Connection and then select the network interface.
The example below shows the menu for the network hardware device
eno1. Go to ETHERNET > IPv4 CONFIGURATION.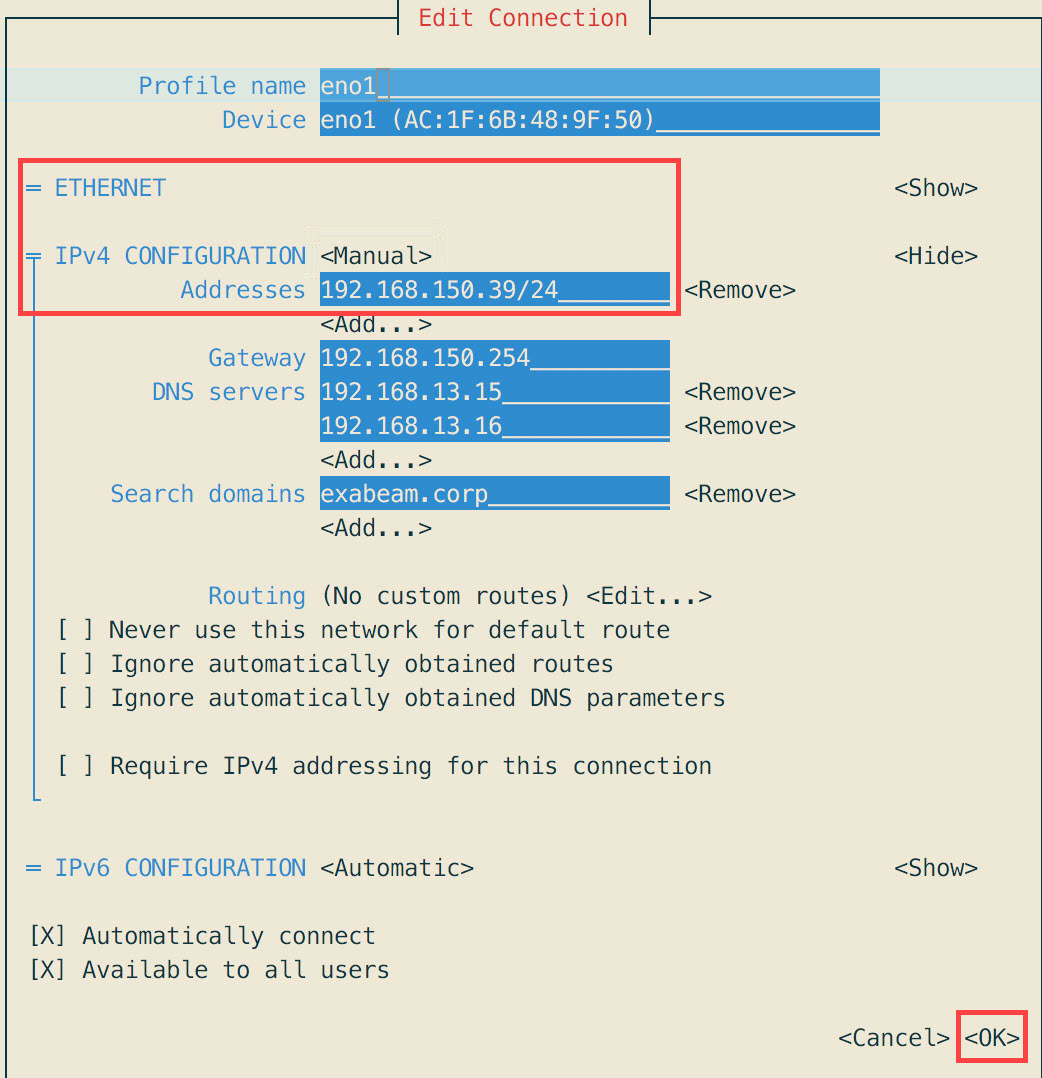
Warning
Please apply the correct subnet CIDR block when entering
[ip]/[subnet]. Otherwise, network routing will fail or produce unforeseen circumstances.Set the configuration to MANUAL, and then modify the IP address in Addresses.
Click OK to save changes and exit the menu.
Restart the network services.
sudo systemctl restart network
Enter the cluster configuration menu again.
/opt/exabeam_installer/init/exabeam-multinode-deployment.sh
Choose
Change network settings.Choose
Change IP of cluster hosts.Choose
Change IP(s) of the cluster - Part II (Before changing IP)Acknowledge the Exabeam requisites.
**********************************************************************
Please make sure you have completed all the items listed below:
- Complete Part I successfully (nuke/uninstall product)
- (Manual) Update the IPs (using nmtui or tool of choice)
- (Manual) Restart network (e.g., systemctl restart network)
**********************************************************************
Do you want to continue with Part II? [y/n] y
Provide the new IP of the host.
What is the new IP address of [hostname]? (Previous address was 10.70.0.14)[new_host_ip]Update your DNS and NTP server information, if they have changed. Otherwise, answer
n.Do you want to update your DNS server(s)? [y/n] n Do you want to update your NTP server? [y/n] n
Hadoop Distributed File System (HDFS) Namenode Storage Redundancy
There is a safeguard in place for the HDFS NameNode (master node), storage to prevent data loss in the case of data corruption. Redundancy is automatically set up for you when you install or upgrade Advanced Analytics and include at least three nodes.
Note
Deployments may take longer if redundancy is enabled.
These nodes can include the common LIME and master node in the EX2003 appliance (excluding single-node deployments), or the standalone/dedicated LIME and Master Node in the EX4003. The Incident Responder node does not factor into the node count.
Redundancy requires two NameNodes that are both operating at all times. The second NameNode is always on the next available Advanced Analytics host, which in most cases is the first worker node. It constantly replicates the primary NameNode.
With this feature enabled in the case of the Master NameNode failing the system can still move forward without data loss. In such cases, you can use this redundancy to fix the state of Hadoop (such as installing a new SSD if there was an SSD failure) and successfully restart it.
Note
Disaster recovery deployments mirror the NameNode duplicated environment.
User Engagement Analytics Policy
Exabeam uses user engagement analytics to provide in-app walkthroughs and anonymously analyze user behavior, such as page views and clicks in the UI. This data informs user research and improves the overall user experience of the Exabeam Security Management Platform (SMP). Our user engagement analytics sends usage data from the web browser of the user to a cloud-based service called Pendo.
There are three types of data that our user engagement analytics receives from the web browser of the user. This data is sent to a cloud-based service called Pendo:
Metadata – User and account information that is explicitly provided when a user logs in to the Exabeam SMP, such as:
User ID or user email
Account name
IP address
Browser name and version
Page Load Data – Information on pages as users navigate to various parts of the Exabeam SMP, such as root paths of URLs and page titles.
UI Interactions Data – Information on how users interact with the Exabeam SMP, such as:
Clicking the Search button
Clicking inside a text box
Tabbing into a text box
Opt Out of User Engagement Analytics
Note
For customers with federal or public sector licensees, we disable user engagement analytics by default.
To prevent Exabeam SMP from sending your data to our user analytics:
Access the config file at
/opt/exabeam/config/common/web/custom/application.conf
Add the following code snippet to the file:
webcommon {
    app.tracker {
      appTrackerEnabled = false
      apiKey = ""
    }
}
Run the following command to restart Web Common and apply the changes:
. /opt/exabeam/bin/shell-environment.bash web-common-restart
Configure Settings to Search for Data Lake Logs in Advanced Analytics
Hardware and Virtual Deployments Only
Before you can search for a log from a Smart Timelines™ event, you must configure Advanced Analytics settings.
First, add Data Lake as a log source. Then, to point Advanced Analytics to the correct Data Lake URL, edit the custom application configuration file.
1. Add Data Lake as a Log Source
In the navigation bar, click the menu
 , select Settings, then navigate to Log Management > Log Ingestion Settings.
Click ADD.
Under Source Type, select Exabeam Data Lake, then fill in the fields:
IP address or hostname – Enter the IP address or hostname of the Data Lake server.
(Optional) Description – Describe the source type.
TCP Port – Enter the TCP port of the Data Lake server.
Username – Enter your Exabeam username.
Password – Enter your Exabeam password.
Click SAVE.
2. Edit the Custom Application Configuration File
In
/opt/exabeam/config/common/web/custom/application.conf, add to the end of the file:webcommon.auth.exabeam.exabeamWebSearchUrl = "https://dl.ip.address:8484/data/app/dataui#/discover?"
Do not insert between stanzas.
To apply the change, restart web-common:
$ sos; web-common-stop; sleep 2; web-common-start
Enable Settings to Detect Email Sent to Personal Accounts
Hardware and Virtual Deployments Only
To start monitoring when someone sends company email to a personal email account, enable it in the algorithms.conf custom configuration file.
Don't change the other parameters in the custom configuration file; they affect the machine learning algorithm behind this capability. If you have questions about these parameters, contact Exabeam Customer Success.
Source the shell environment:
. /opt/exabeam/bin/shell-environment.bash
Navigate to
/opt/exabeam/ds-server/config/custom/algorithms.conf.In the
algorithms.conffile underpersonal-email-identification, change the value ofEnabledtotrue:personal-email-identification { Enabled = trueAdd your company domain as a string to
CompanyDomain:personal-email-identification { Enabled = true Parameters = { CompanyDomain = "company.com"To add multiple company domains, insert them in a list:
personal-email-identification { Enabled = true Parameters = { CompanyDomain = ["company.com", "company1.com", "comapny2.com"] }Save the
algorithms.conffile.Restart the Data Science (DS) server:
ds-server-stop
ds-server-start
Configure Smart Timeline™ to Display More Accurate Times for When Rules Triggered
Hardware and Virtual Deployments Only
Configure your environment so the Smart Timeline displays the day of the week and 24-hour time notation when a raw log triggered a time-related rule. With this information, you can build a better picture of when your users are doing something anomalous.
Time-related rules, like DC23 (Abnormal session start time) or PA-UTi-A (Badge access at abnormal time), use a TimeOf* function, like TimeOfWeek(), TimeOfDay(), and TimeOfMonth(). By default, these functions use the event.time parameter, which represents when the event builder created an event from the raw log. In some cases, event.time may not accurately represent when a rule triggered. For example, if your SIEM lags when sending logs to Advanced Analytics, there may be a delay between when the raw log was created and when it's processed to create an event.
To more accurately display when time-based rules trigger, update time-related rules and their associated models so the TimeOf* function uses the rawlog_time parameter. rawlog_time represents when the raw log was created, which is usually when the anomalous behavior happened.
If you have a multi-node deployment, you must make the same changes to your rules and models across all nodes.
1. Update the Rule Configuration
Update the FactFeatureName attribute so the parameter of "TimeOfWeek()", "TimeOfDay()", or "TimeOfMonth()" is rawlog_time. Then, update ReasonTemplate and AggregateReasonTemplate, replacing featureValue with event.rawlog_time.
Source the shell environment:
source /opt/exabeam/bin/shell-environment.bash
Navigate to
/opt/exabeam/config/default/, then among the.confrule files, identify the time-based rules you want to update. For these rules, the value ofFactFeatureNamemust be"TimeOfWeek()","TimeOfDay()", or"TimeOfMonth()". Possible rules include:WTC-HT-TOW-A – Scheduled task created at an unusual time for this host
WSC-HT-TOW-A – Service created at an unusual time for this host
PR-UT-TOW – Abnormal print activity time for user
AS-PV-UT-A – Abnormal user Password retrieval activity time
SEQ-UH-09 – Abnormal time of the week for a failed logon for user
AM-UT-TOW-A – Abnormal day for user to perform account management activity
DC23 – Abnormal session start time
DC24 – Abnormal day of week
VPN14b – Abnormal VPN session start time
FA-UTi – Abnormal user file activity time
PA-UTi-A – Badge access at abnormal time
FPA-UTi-A – Failed badge access at abnormal time
WEB-UT-TOW-A – Abnormal day for this user to access the web via the organization
Copy the configuration of the rules to
/opt/exabeam/config/custom/rules.conf.For the
FactFeatureNameattribute, set the parameter of"TimeOfWeek()","TimeOfDay()", or"TimeOfMonth()"torawlog_time; for example:FactFeatureName = "TimeOfWeek(rawlog_time)"FactFeatureName = "TimeOfDay(rawlog_time)"FactFeatureName = "TimeOfMonth(rawlog_time)"
For that rule, update
ReasonTemplateto replacefeatureValuewithevent.rawlog_time. For example, let's take theReasonTemplateattribute for rule DC23:ReasonTemplate = "Abnormal session start time {time.time_of_week|featureValue|histogram}"Replace
featureValuewithevent.rawlog_time:ReasonTemplate = "Abnormal session start time {time.time_of_week|event.rawlog_time|histogram}"For that rule, update
AggregateReasonTemplateto replacefeatureValuewithevent.rawlog_time.Save the file.
2. Update the Model Configuration
For the associated model, ensure the value of Feature uses the parameter rawlog_time.
The value of Feature in the model must be the same as FactFeatureName in the associated rule. If not, the Smart Timeline event may display the wrong data.
Navigate to
/opt/exabeam/config/default/, then among the.confmodel files, identify the models associated with the rules you updated. Possible models include:PA-UTi – Models badge access entry times
WTS-HT-TOW – Models the times of day that a user logged on to this host
PR-UT-TOW – Models the times of day that this user performs print activity
AS-PV-UT-TOW – Models the times of day that this user retrieves password
AM-UT-TOW – Models the time of day that this user manages accounts
VPN14b – Models the time that this user logs on via VPN
FA-UTi – Models the times of day that this user had performed file activity
WEB-UT-TOW – Models the times of day that this user access the web
Copy the configuration of the models to
/opt/exabeam/config/custom/models.conf.For the
Featureattribute, set the parameter of"TimeOfWeek()","TimeOfDay()", or"TimeOfMonth()"torawlog_time; for example:Feature = "TimeOfWeek(rawlog_time)"Feature = "TimeOfDay(rawlog_time)"Feature = "TimeOfMonth(rawlog_time)"
Save the file.
3. Repeat changes for all nodes
If you have a multi-node deployment, ensure you make the same changes to the rule and model configuration across all nodes.
4. Restart the Analytics Engine
To apply these changes to your environment, run:
exabeam-analytics-stop; exabeam-analytics-start
Configure Rules
Create and modify rules in Advanced Analytics settings.
In the navigation bar, click the menu  , select Settings, select Analytics, then navigate to Admin Operations > Exabeam Rules.
From Exabeam Rules settings:
View all rules configured in your system.
Edit an existing rule and overwrite the original out-of-the-box rule of the same name.
Revert to default settings and clear all changes you previously made.
Create a fact-based rule.
Clone and make a copy of a rule. You can save the copy under a new name and edit the new rule in the Advanced Editor.
Disable a rule so it doesn't trigger.
Enable a rule you previously disabled.
Reload all rules. You must reload rules when you create new rules or modify an existing rule. New or modified rules that must be reloaded are highlighted with an orange triangle.
What Is an Exabeam Rule?
So what exactly is a rule anyway? There are two types of Exabeam rules:
Model-based
Fact-based
Model-based rules rely on a model to determine if the rule should be applied to an event in a session, while fact based rules do not.
For example, a Fireye malware alert is fact based and does not require a model in order to be triggered. On the other hand, a rule such as an abnormal volume of data moved to USB is a Model-based rule.
Model-based rules rely on the information modeled in a histogram to determine anomalous activities. A rule is triggered if an event is concluded to be anomalous, and points are allocated towards the user session in which the event occurred. Each individual rule determines the criticality of the event and allocates the relevant number of points to the session associated with that event.
Taken together, the sum of scores from the applied rules is the score for the session. An example of a high-scoring event is the first login to a critical system by a specific user – which allocates a score of 40 to a user’s session. Confidence in the model must be above a certain percentage for the information to be used by a rule. This percentage is set in each rule, though most use 80%. When there is enough reliable information for the confidence to be 80% or higher, this is called convergence. If convergence is not reached, the rule cannot be triggered for the event.
How Exabeam Models Work
Since anomaly-based rules depend on models, it is helpful to have a basic understanding of how Exabeam's models work.
Our anomaly detection relies on statistical profiling of network entity behavior. Our statistical profiling is not only about user-level data. In fact, Exabeam profiles all network entities, including hosts and machines, and this extends to applications or processes, as data permits. The statistical profiling is histogram frequency based. To perform the histogram-based profiling, which requires discrete input, we incorporate a variety of methods to transform and to condition the data. Probability distributions are modeled using histograms, which are graphical representations of data. There are three different model types – categorical, numerical clustered, and numerical time-of-week.
Categorical is the most common. It models a string with significance: number, host name, username, etc. Where numbers fall into specific categories which cannot be quantified. When you model which host a user logs into, it is a categorical model.
Numerical Clustered involves numbers that have meaning – it builds clusters around a user’s common activities so you can easily see when the user deviates from this norm. For example, you can model how many hosts a user normally accesses in a session.
Numerical Time-of-Week models when users log into their machines in a 24-hour period. It models time as a cycle so that the beginning and end of the period are close together, rather than far apart. For example, if a user logs into a machine Sunday at 11:00 pm, it is closely modeled to Monday at 12:00am.
Model Aging
Over time, models built in your deployment naturally become outdated. For example, if an employee moves to a different department or accepts a promotion and they do not adhere to the same routines, access points, or other historical regularities.
We automatically clean up and rebuild all models on a regular basis (default is every 16 weeks) to ensure your models are as accurate and up-to-date as possible. This process also enhances system performance by cleaning out unused or underutilized models.
View Rules in Advanced Analytics
View all rules configured in your system in Advanced Analytics settings.
View all rules configured in your system by category. To view all rules in a category, expand the category.
Under the ALL RULES tab, view all existing rules.
Under the EXABEAM RULES tab, view all prepackaged Exabeam rules.
Under the CUSTOM RULES tab, view all rules you created, cloned, edited, and saved.
Under the DISABLED RULES tab, view all the rules that are disabled and won't trigger.
At a glance, you can see:
Whether the rule was edited
 .
.The TRIGGER FREQUENCY, how often the rule triggers during user sessions.
The RISK LEVEL, the risk score assigned to a user session when the rule triggers.
Rule Naming Convention
Exabeam has an internal Rule ID naming convention that is outlined below. This system is used for Exabeam created rules and models only. When a rule is created or cloned by a customer, the system will automatically create a Rule ID for the new rule that consists of customer-created, followed by a random hash. For example, a new rule could be called, customer-created-4Ef3DDYQsQ {.
The Exabeam convention for model and rule names is: ET-SF-A/F-Z
ET: The event types that the model or rule addresses. For example,
RA = remote-access
NKL = NTLM/Kerberos-logon
RL = remote-logon
SF: Scope and Feature of the model. For example,
HU = Scope=Host, Feature=User
OZ = Scope=Organization, Feature=Zone
A/F: For rules only
A = Abnormal
F = First
Z : Additional Information (Optional). For example,
DC: Domain Controller models/rules
CS: Critical Systems
Reprocess Rules
When adding new or managing existing Exabeam rule on the Exabeam Rules page, you can choose to reload individual or all rules. You can choose to reload and apply rule changes from the current point in time, or and reprocess historic data. When applying and reprocessing rule changes to historic data, the reprocess is done in parallel with active, live processing. It does not impede or stop any real-time analysis.
You can view the status of pending, in-progress, completed, canceled, and failed jobs at any time by navigating to Settings > Admin Operations > Exabeam Engine > Reprocessing Jobs. For more information on reprocessing, please see the section Reprocess Jobs.
Create a Fact Based Rule
Create a fact based rule in Advanced Analytics settings.
In the navigation bar, click the menu
 , select Settings, select Analytics, then navigate to Admin Operations > Exabeam Rules.
Click Create Rule
 .
.Enter specific information:
Rule Category – From the list, select which category the rule falls under.
Name – Name the rule. When the rule triggers, the name is displayed in Advanced Analytics. It's best to be descriptive and indicate the nature of the risky behavior; for example, Data Exfiltration by a Flight Risk User.
Description – Describe the rule and provide additional details that may help your team investigate. To help your team better interpret what happens during a user session, describe why you created the rule and what it detects.
Events – Select the event types that the rule depends on. For example, if your rule evaluates user logins, select all event types that reflect the login events you want analyzed.
Risk Level – Select the risk level, or risk score, that is added to a user session when the rule triggers: Low, Medium, Critical, Severe, Alarming.
Create a Boolean expression the Analytics Engine uses to determine if the rule triggers. Your rule triggers only if the expression is true.
Under RULE EXPRESSION, click CREATE EXPRESSION.
Under Select Field, select the event field the Boolean expression evaluates.
Under Select Property, select the property of the event field the Boolean expression evaluates. This differs based on event field.
Under Select Function, select an operator.
Under Select Category, select whether you're evaluating the event field property against another Field or a Value.
If you selected Field, under Select Field, select the event field the rule evaluates the first event field against. Under Select Property, select the property of the event field.
If you selected Value, in Enter Value, enter a string value.
To add additional conditions, select a boolean operator: AND or OR.
To save the boolean expression, click DONE.
(Optional) Define what other rules must or must not trigger for your rule to trigger:
Under DEPENDENCY, click CREATE DEPENDENCY.
To define a rule that must not trigger for your to rule trigger, toggle NOT to the right
 . To define a rule that must trigger for your rule to trigger, toggle NOT to the left
  .
.Under Search for other rules., start typing, then select a rule from the list.
To add additional rules, select a boolean operator: AND or OR.
To save the dependency expression, click DONE.
Under How many times should the rule be triggered?, select how frequently the rule triggers: Once per session, Always, or Once per value.
Save the rule:
To save your progress without applying the changes, click SAVE. Your system validates the rule logic.
To save the rule and apply the changes, click SAVE & RELOAD ALL. Your system validates the rule logic and reloads the rule file.
Example of Creating a Fact Based Rule
You're creating a fact-based rule that adds 15 to a user session's risk score every time users human resources considers flight risks start a session. You have a context file titled Flight Risk containing the IDs of those users.
Enter specific information:
Name – Enter Flight Risks.
Description – Enter Users that HR considers flight risks.
Event Types – Select remote-access, remote-logon, local-logon, kerberos-logon, ntlm-logon, account-switch, app-logon, app-activity, and privileged-object-access.
Risk Level – Select Critical.
Create a boolean expression:
Under Select Field, select User.
Under Select Property, select User Label.
Under Select Function, select Equals.
Under Select Category, select Value.
In Enter Value, enter Flight Risk. This is the label in the Flight context table.
Click DONE.
Under How many times should the rule be triggered?, select Always.
Click SAVE & RELOAD.
Edit Rules Using the Advanced Editor
The Advanced Editor is a JSON style editor and is what an administrator would use if they wanted to edit one of Exabeam's existing rules, or edit a cloned rule. All of Exabeam's out-of-the-box rules can be edited only via the Advanced Editor.
Note
Be careful here, these settings are for very advanced users only. Changes you make here can have a significant impact on the Exabeam Analytics Engine. The Advanced Editor allows administrators and advanced analysts to make changes to Exabeam rules in a JSON style configuration format. This should be used by administrators that have the expertise to create or tweak a machine learning rule and understand the syntax language for expressing a rule. In case of questions, reach out to Exabeam Customer Success for guidance.
This editor shows the entire rule as it exists in the configuration file. The Rule ID is the only field that cannot be changed. See the Rule Naming Convention section in this document for more information about Exabeam's naming convention. When an administrator makes any changes to a rule, the rule is validated during the save operation. If the rule has incorrect syntax, the administrator is prompted with the error and the details of the error. Once a rule is edited and saved using the Advanced Editor, the rule cannot be viewed via the Simple Editor.
Fields in the Advanced Editor
Glossary
ClassifyIfThis expression is similar to the
TrainIffield in the model template. It evaluates to true if classification needs to be performed for a given event. In other words, how many times this rule should trigger.DependencyExpressionThis field defines a Boolean expression of other rule IDs. When rule A depends on expression E, A will only trigger if its parameters satisfy the RuleExpression, and E is evaluated to true after the rule IDs are substituted with their rule evaluation result.When an administrator makes any changes to a rule, the rule is validated during the save operation. If the rule is not syntactically well formed, the administrator is prompted with the error and the details of the error.
DisabledThis field will read either True or False. Set to True to deactivate the rule and all associated modelling.
FactFeatureNameThis field defines the name of the designated feature in a fact-based rules. In model-based rules, the
FactFeatureNamefield is a variable that gets defined by the associated model.ModelThe name of the model that this rule references. If this rule is fact-based, the model name is FACT.
PercentileThresholdThis value indicates which observations are considered anomalous based on the histogram. For example, a value of 0.1 indicates a percentile threshold of 10%. This goes back to the histogram and means that for the purposes of this rule we only consider events that appear below the 10th percentile to be abnormal. Note that many rules distinguish between the first time an event occurs and when that event has happened before, but is still abnormal. These two occurrences often appear as two separate rules because we want to assign two different scores to them.
ReasonTemplateThis appears in the UI and is to facilitate cross examination by users. The items between braces represent type and value for an element to be displayed. The type helps define what happens when the user clicks on the hyperlink in the UI.
RuleDescriptionThis is used in the UI to describe the reason why a particular rule triggered.
RuleEventTypesThis collection defines what events we are considering in this rule. It can be the same events that the model considers, but does not have to be. Sometimes you may want to model on one parameter but trigger on another.
RuleExpressionThis is the Boolean expression that the rule engine uses to determine if a particular rule will trigger. Your rule will only trigger if all of the conditions described in the Rule Expression are met. You can use probability or number of observations (
num_observations)to determine how many times this event has been seen before. When either is set to zero it is a way to see when something happens that has not happened before. Theconfidence_factorrefers to a concept called convergence. In order for the rule to use the information gathered by the model, we must be confident in that information. A percentage is set in each Confidence in the model must be above a certain percentage for the information to be used by a rule. This percentage is set in each rule, though most use 80%. When there is enough reliable information for the confidence to be 80% or higher, this is called convergence. If convergence is not reached, the rule cannot be triggered for the event.Rule IDUnique identifier for this rule. The name in our example is NKL-UH-F. Exabeam has a naming convention for both models and rules that is outlined in the section titled Naming Convention. When editing or cloning an existing rule you cannot change the Rule ID.
RuleNameDescriptive name for the rule. Used for documentation purposes.
RuleTypeThis appears in the UI and is to facilitate cross-examination by users. The items between braces represent type and value for an element to be displayed. The type helps define what happens when the user clicks on the hyperlink in the UI.
ScoreThis is the score that will be assigned to a session when this rule triggers. Higher scores mean a higher level of risk from the security perspective.
Exabeam Threat Intelligence Service
The Exabeam Threat Intelligence Service delivers up-to-date threat indicators, on a daily basis, to Advanced Analytics deployments. Threat indicator data is stored in context tables that are associated with each feed. These threat indicators provide enhanced data based on curated threat intelligence.
The table below lists the categories of threat indicators provided by each threat intelligence feed and the rules that leverage each feed.
Note
All of the threat intelligence feeds, except the TOR network category, provide curated threat intelligence from ZeroFox. The TOR network feed is an open source data feed.
IoC Category | Rules |
|---|---|
Ransomeware IP IP addresses associated with ransomware attacks |
|
Threat IP IP addresses associated with ransomware or malware attacks |
|
Reputation Domain Domain names and URLs associated with sites that often contain malware, drive-by compromises, and more |
|
Web Phishing Domain names associated with phishing or ransomware | WEB-UD-Phishing |
TOR IP IP addresses associated with the TOR network |
|
Cloud-delivered deployments of Advanced Analytics and Data Lake connect to the Threat Intelligence Service (TIS) through an Exabeam Data Service (EDS) cloud connector, as shown in the image below. The cloud connector service provides authentication and establishes a secure connection to the Threat Intelligence Service. The cloud connector service collects updated threat indicators from the Threat Intelligence Service and makes them available within Advanced Analytics and Data Lake on a daily basis.
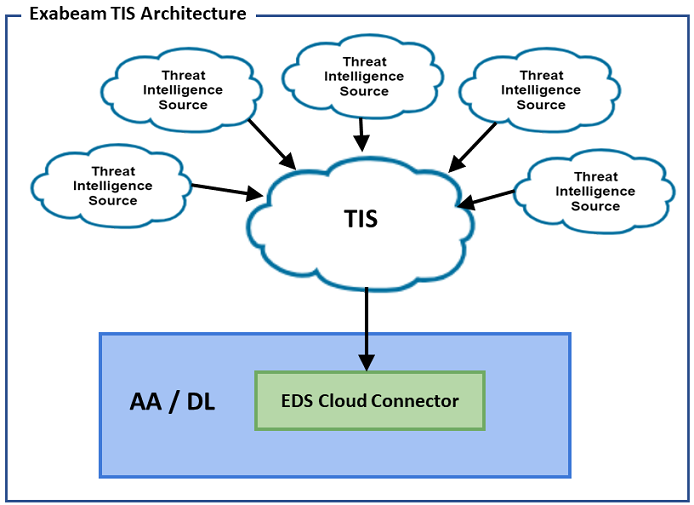 |
The Threat Intelligence Service does not require a separate license. It is bundled with Advanced Analytics deployments. Additional installation is not required.
For on-premise deployments of Advanced Analytics and Data Lake, threat indicators are downloaded directly from the Threat Intelligence Service on a daily basis.
For more information about the Threat Intelligence Service, contact your technical account manager.
Threat Intelligence Service Prerequisites
Before configuring Threat Intelligence Service, ensure your deployment meets the following prerequisites:
Advanced Analytics i46 or later Data Lake i24 or later with a valid license
At least 5 Mbps Internet connection
Access to https://api.cloud.exabeam.com over HTTPS port 443
DNS resolution for Internet hostnames (this will only be used to resolve to https://api.cloud.exabeam.com)
Note
Ensure dynamic access is enabled as the IP address may change. Also, for this reason, firewall rules for static IP and port addresses are not supported.
Connect to Threat Intelligence Service through a Proxy
Hardware and Virtual Deployments Only
The communication between Threat Intelligence Service and Advanced Analytics occurs over a secure HTTPS connection.
If connections from your organization do not make use of a web proxy server, you may skip this section. Threat Intelligence Service is available automatically and does not require additional configuration.
If connections from your organization are required to go through a web proxy server to access the Internet, follow the steps below to provide the necessary configuration.
Note
Configuration is required for each of your Advanced Analytics deployments.
Warning
If your proxy performs SSL Interception, it will replace the SSL certificate from the Exabeam Threat Intel Service (ETIS) with an unknown certificate during the SSL negotiation, which will cause the connection to ETIS to fail. If possible, disable SSL Interception for the IP address of your Exabeam products. If SSL cannot be disabled, contact Exabeam Customer Success for further assistance.
Before configuring Threat Intelligence Service, ensure your deployment meets the following prerequisites:
At least 5 Mbps Internet connection
Access to https://api.cloud.exabeam.com over HTTPS port 443
DNS resolution for Internet hostnames (this will only be used to resolve to https://api.cloud.exabeam.com)
Note
Ensure dynamic access is enabled as the IP address may change. Also, for this reason, firewall rules for static IP and port addresses are not supported.
Establish a CLI session with the master node of your Exabeam deployment.
Open the custom file
/opt/exabeam/config/common/cloud-connection-service/custom/application.conf
Add the following section to the custom file and configure the parameters
proxyHost,proxyPort,proxyUsername, andproxyPassword.Note
Be sure to choose the appropriate settings based on whether the proxy uses http or https. Additionally, always use quoted strings for
proxyHost,proxyProtocol,proxyUsername, andproxyPassword.HTTP:

HTTPS:

Stop and then restart the cloud connector service in your product:
source /opt/exabeam/bin/shell-environment.bashcloud-connection-service-stopcloud-connection-service-start
Restart Exabeam Directory Service (EDS):
eds-stop
eds-start
Note
Important Note: The username and password values are hashed in Data Lake i24 and later. After Cloud Connection Service (CCS) is restarted (step 4), the username and password are hashed using a 128 bit AES key, and these hashed values are stored in the local secrets store. In the config file, the username and password values are replaced by the hashed values.
If you subsequently want to change the values, replace the hashed values with new plain text values and restart the CCS service.
As soon as the deployment can successfully connect to Threat Intelligence Service, threat intelligence feed data is pulled and saved in context tables. Threat intelligence feeds and context table are viewable from the Advanced Analytics Settings page. For more information see the following:
View Threat Intelligence Feeds
To view threat intelligence feeds in Advanced Analytics, open the Settings page. Navigate to the Cloud Config tile and select Threat Intelligence Feeds.
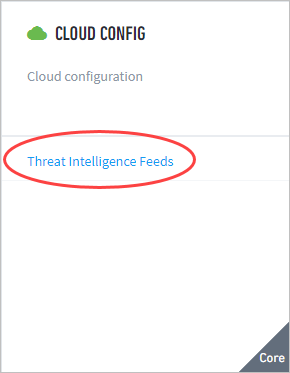 |
The Threat Intelligence Feeds page displays a list of the feeds provided by the cloud-based Exabeam Threat Intelligence service. The list includes the following information about each feed:
Type: The type of feed (for example, domain list, IP list, etc.)
Name: The name of the feed (given by the cloud-based service)
Description: A short description of the feed
Context Tables: The context tables associated with the feed
Status: Indicates the availability of the feed in the cloud-based service
Updated: The date and time the feed was last updated from the cloud service
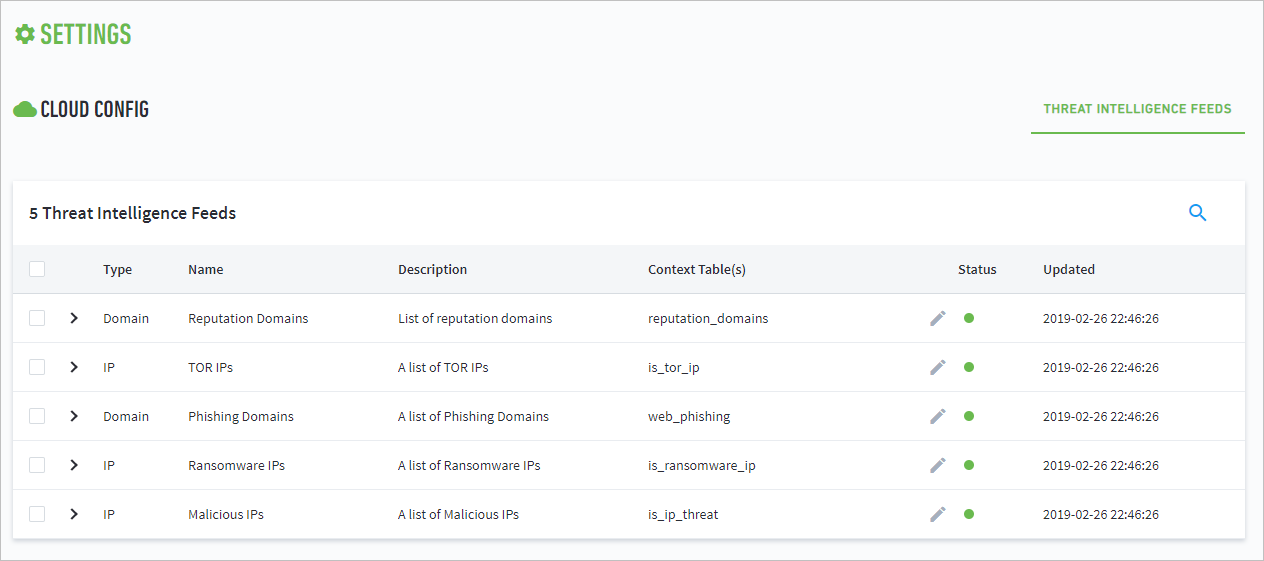 |
To view additional detailed information about a specific feed, click the arrow to the left of the feed. An additional view expands with more information, including ID, Source URL, Indicator in Context Tables, Retrieved from Source, and Feed Indicator Sample.
 |
For information about context tables and how they are related to threat intelligence feeds, see Threat Intelligence Context Tables.
Threat Intelligence Context Tables
Data provided by threat intelligence feeds is stored in context tables associated with each feed. By default, feeds are initially associated with existing context tables. As a result, when your Advanced Analytics deployment is connected to the Threat Intelligence Service, it immediately begins collecting threat intelligence data.
In Advanced Analytics, the data in context tables can be leveraged by creating rules that match log events to indicators stored in a threat intelligence context table. If the RuleExpression logic finds a match, an event can be identified as malicious without further analysis.
In Data Lake, the data in context tables can help to enrich log event data.
For more information about working with context tables, see the following:
Note
To view a sample list of Threat Intelligence Service indicator sources see the Exabeam Community.
View Threat Intelligence Context Tables
To view the current context tables provided by the Threat Intelligence Service, log into your instance of Advanced Analytics and open the Settings page. Navigate to the Context Management tile and select Context Tables.
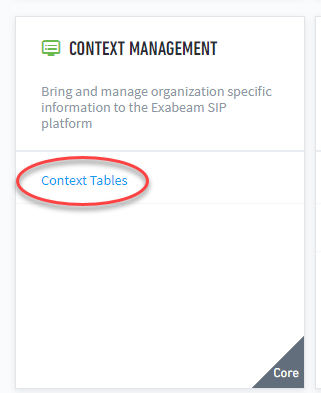 |
The Context Tables page displays a list of all the context tables currently provided by the Exabeam Threat Intelligence service. To locate a specific context table, scroll through the list or use the search feature  .
.
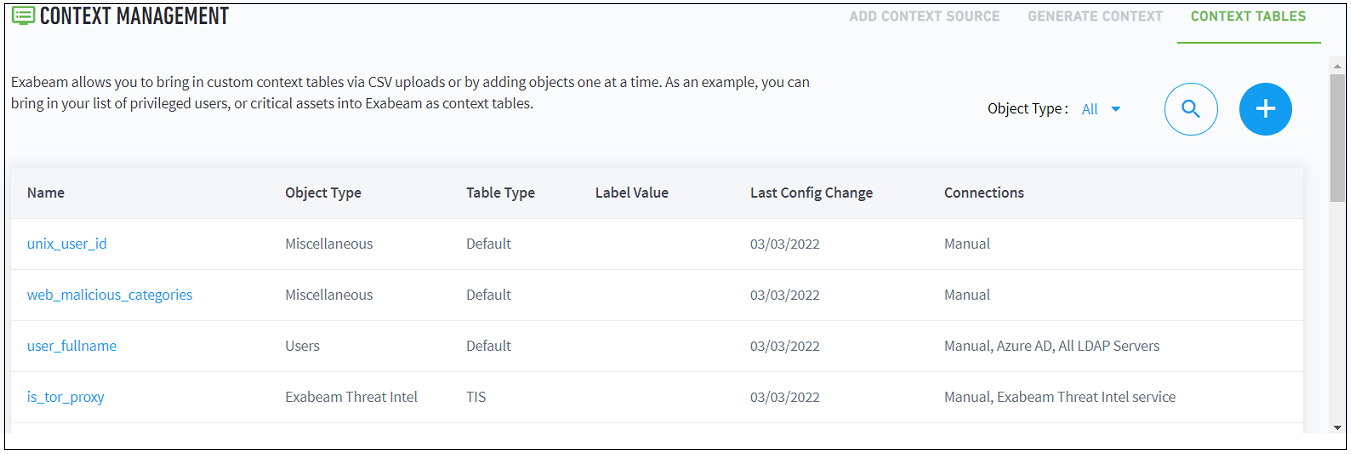 |
To view information about keys and values associated with a specific context table, click the table name. A new expanded view of the table is displayed.
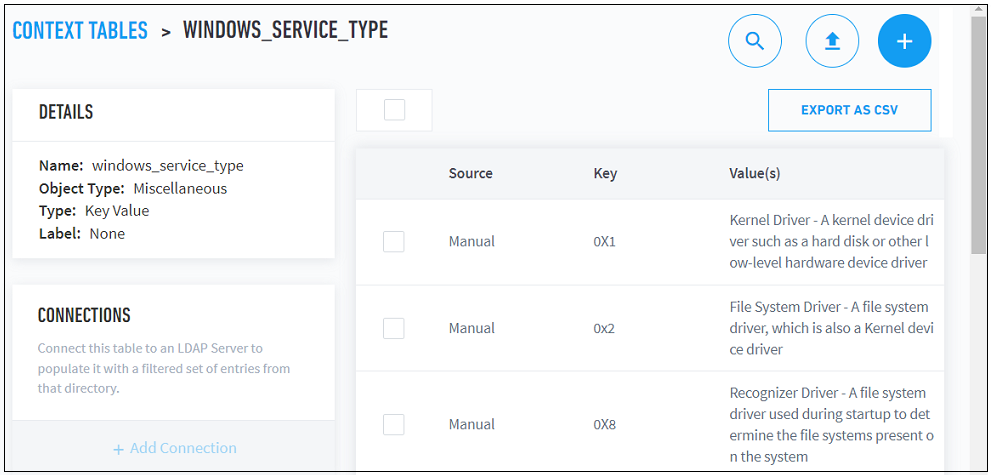 |
Assign a Threat Intelligence Feed to a New Context Table
Some threat intelligence feeds are pre-assigned to specific context tables. However, you can easily add, remove, or change feed assignments. You can configure feed assignments in one of two ways, individually or in bulk.
Note
You cannot unassign default context table mappings.
Individual Feed Assignment
To change the assignment of a single threat intelligence feed to one or more context tables:
Navigate to the Threat Intelligence Feeds page, as described in View Threat Intelligence Feeds.
Find the feed whose context table assignments you want to change and, in the Status column, click edit
 . A list of the available context tables opens.
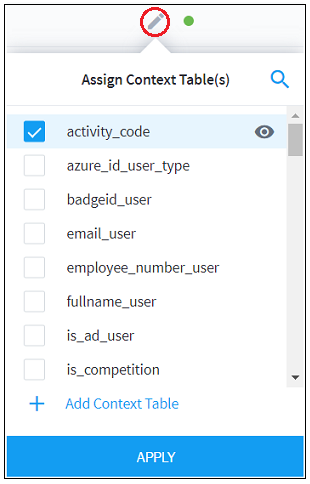
Use the check boxes on the left of each context table to assign or unassign the threat intelligence feed. A single feed can be assigned or unassigned to multiple context tables.
To view the existing threat indicators in a specific context table, click view
 . A new window opens and displays a list of keys and values for the indicators included in the context table. Click OK to close the window.
When you've finished assigning or unassigning the feed to specific context tables, click Apply to save the updated assignments.
Bulk Feed Assignment
To change the assignment of multiple threat intelligence feeds to one or more context tables:
Navigate to the Threat Intelligence Feeds page, as described in View Threat Intelligence Feeds.
Use the check boxes on the left of each feed to select multiple feeds whose assignment you want to change.
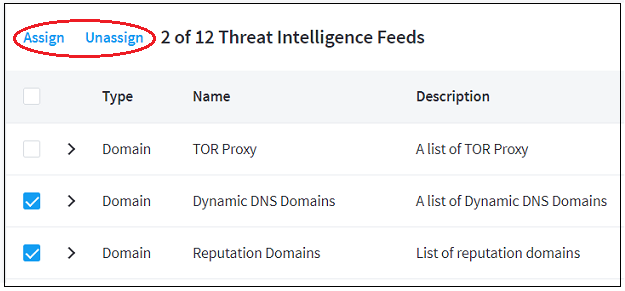
At the top of the feeds list, click Assign or Unassign, depending on what changes you want to make.
Assign: A list of the available context tables opens in a new window. Use the check boxes on the left to select context tables. To see the indicators included in each table, click view
 . When you've completed your table selections, click Assign. All of the specified feeds will be assigned to the selected context tables.
Unassign: All of the specified feeds will be unassigned from their context tables.
Create a New Context Table from a Threat Intelligence Feed
New context tables can be created from specific threat intelligence feeds. You can create new context tables in one of two ways, from an individual feed or from multiple feeds in bulk.
Create a Table from a Single Feed
To create a new context table from a single threat intelligence feed:
Navigate to the Threat Intelligence Feeds page, as described in View Threat Intelligence Feeds.
Find the feed from which you want to create a new content table and, in the Status column, click edit
 . A list of the existing context tables opens.
At the bottom of the list, select the Add Context Table option. A set of options for creating a new context table is displayed.
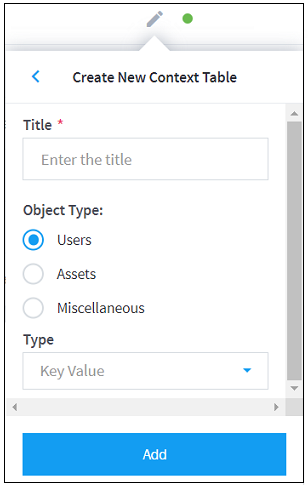
Enter the Title, Object Type, and Type information to define the new context table.
Click Add to save the new context table.
Create a Table from Multiple Feeds
To create a new context table from a bulk selection of threat intelligence feeds:
Navigate to the Threat Intelligence Feeds page, as described in View Threat Intelligence Feeds.
Use the check boxes on the left of each feed to select multiple feeds from which you want to create a new context table.
At the top of the feeds list, click Assign. A list of the existing context tables opens.
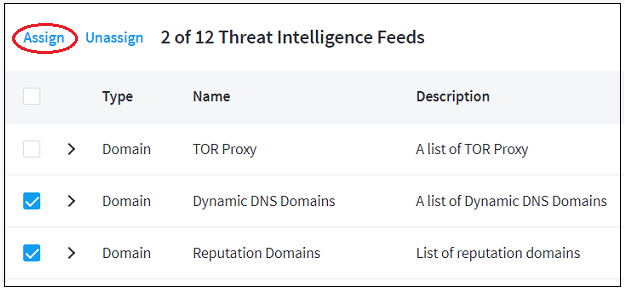
At the bottom of the list, select the Add Context Table option. A set of options for creating a new context table is displayed.
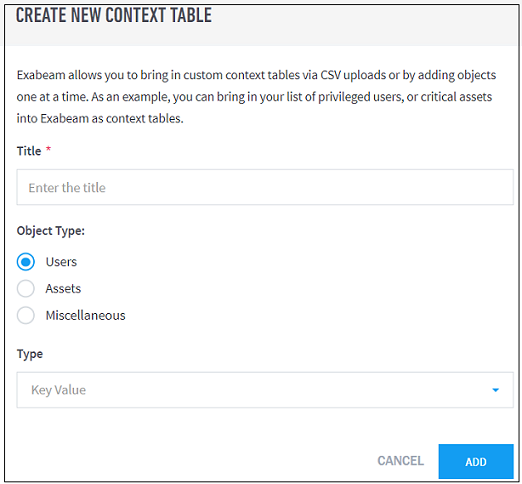
Enter the Title, Object Type, and Type information to define the new context table.
Click Add to save the new context table.
Check ExaCloud Connector Service Health Status
To view the current status of the ExaCloud connector service:
Log in to your instance of the UI.
Click the top-right menu icon and select System Health.
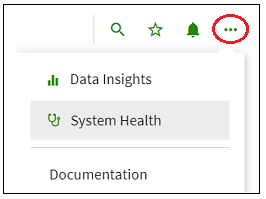
Select the Health Checks tab.
Click Run Checks.
Expand the Service Availability section, and then review the ExaCloud connection service availability icon.
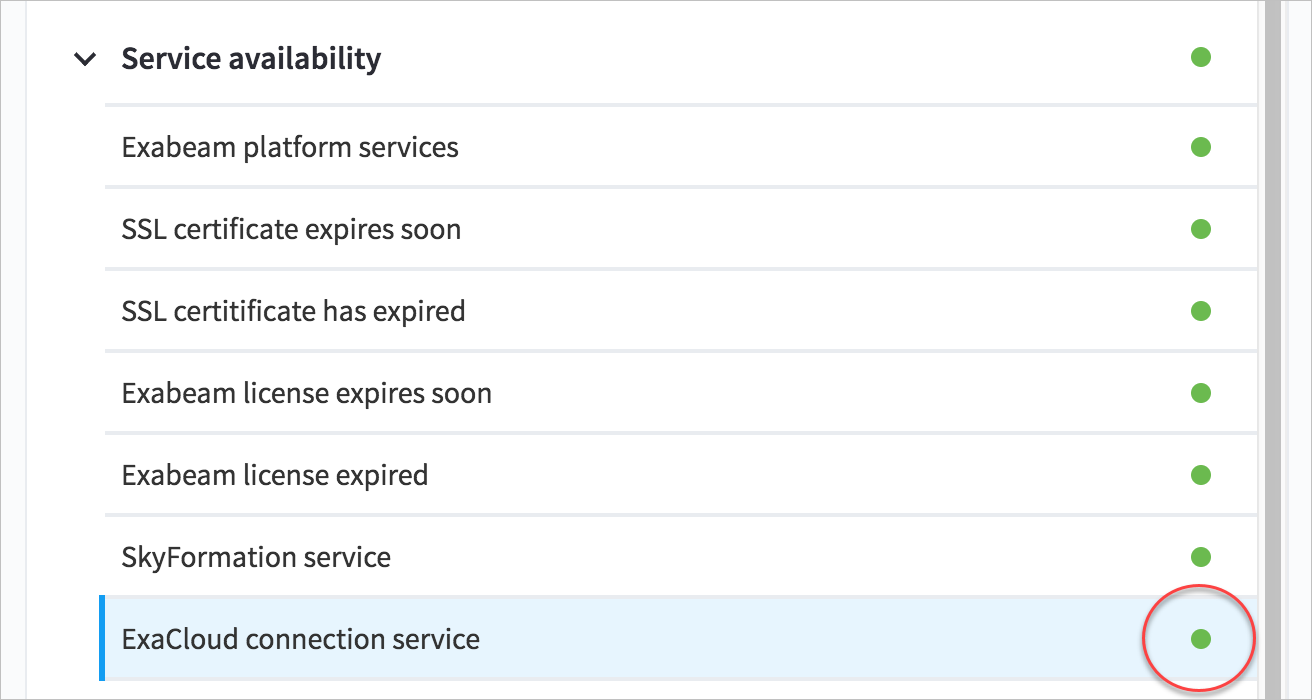
The service availability icon shows the current health of the Cloud Connector service that is deployed on your Exabeam product.
Green – The cloud connector service is healthy and running on your on-prem deployment.
Note
The green icon does not specifically indicate the cloud connector is connecting to the cloud and pulling Threat Intelligence Service data. It only indicates the cloud connector service is up and running.
Red – The cloud connector service has failed. Please contact Exabeam Customer Success by opening a case from Community.Exabeam.com.
Disaster Recovery
In a disaster recovery scenario, Advanced Analytics content is replicated continuously from the active site to the passive site, including:
Logs/Events: The active cluster fetches logs from SIEM and/or receiving the logs via Syslog. After the logs are parsed, the events are replicated to the passive cluster.
Configurations: Changes to the configuration such as new log feeds, parsers, LDAP servers, Exabeam users and roles, models, and rules are replicated from the active to the standby cluster. This includes files and relevant database collections (for example, EDS configuration, users and roles are in database).
Context: Contextual data such as users, assets, service accounts, and peer groups.
User Generated Data: Comments, approved sessions, Watchlists, starred sessions, saved searches, and whitelists stored in the Mongo database.
Note
You can also configure your Advanced Analytics deployment to replicate only specific file types across clusters.
If you have Case Manager or a combined Case Manager and Incident Responder license, the disaster recovery system replicates the following:
Incidents and incident details: Entities, artifacts, comments, etc.
Custom incident filters and searches
Roles and permissions
Playbooks and actions: Including history and saved results of previous actions.
Configurations: For example alert sources, alert feeds, notification settings, incident message and email settings, phases and tasks, and integrated services (parsers and alert rules).
Deploy Disaster Recovery
Warning
You can only perform this configuration with the assistance of Exabeam Customer Success Engineer.
The two-cluster scenario employs an Active-Passive Disaster Recovery architecture with asynchronous replication.
With this approach, you maintain an active and secondary set of Advanced Analytics (and additional Case Manager and Incident Responder) clusters in separate locations. In cases of a failure at the active site, you can fail over to the passive site.
At a high level, when Disaster Recovery is set up between two Advanced Analytics clusters, the active cluster is responsible for fetching the logs from SIEM or receiving the logs over Syslog. After the logs have been parsed into events, the events are replicated from the active cluster to the passive cluster every five minutes.
Optionally, the raw logs can be replicated from the active to the passive cluster. This allows reprocessing of logs, if needed; however, replication generates greater bandwidth demands between nodes. If the active cluster goes down, the passive cluster becomes the active until the downed site is recovered.
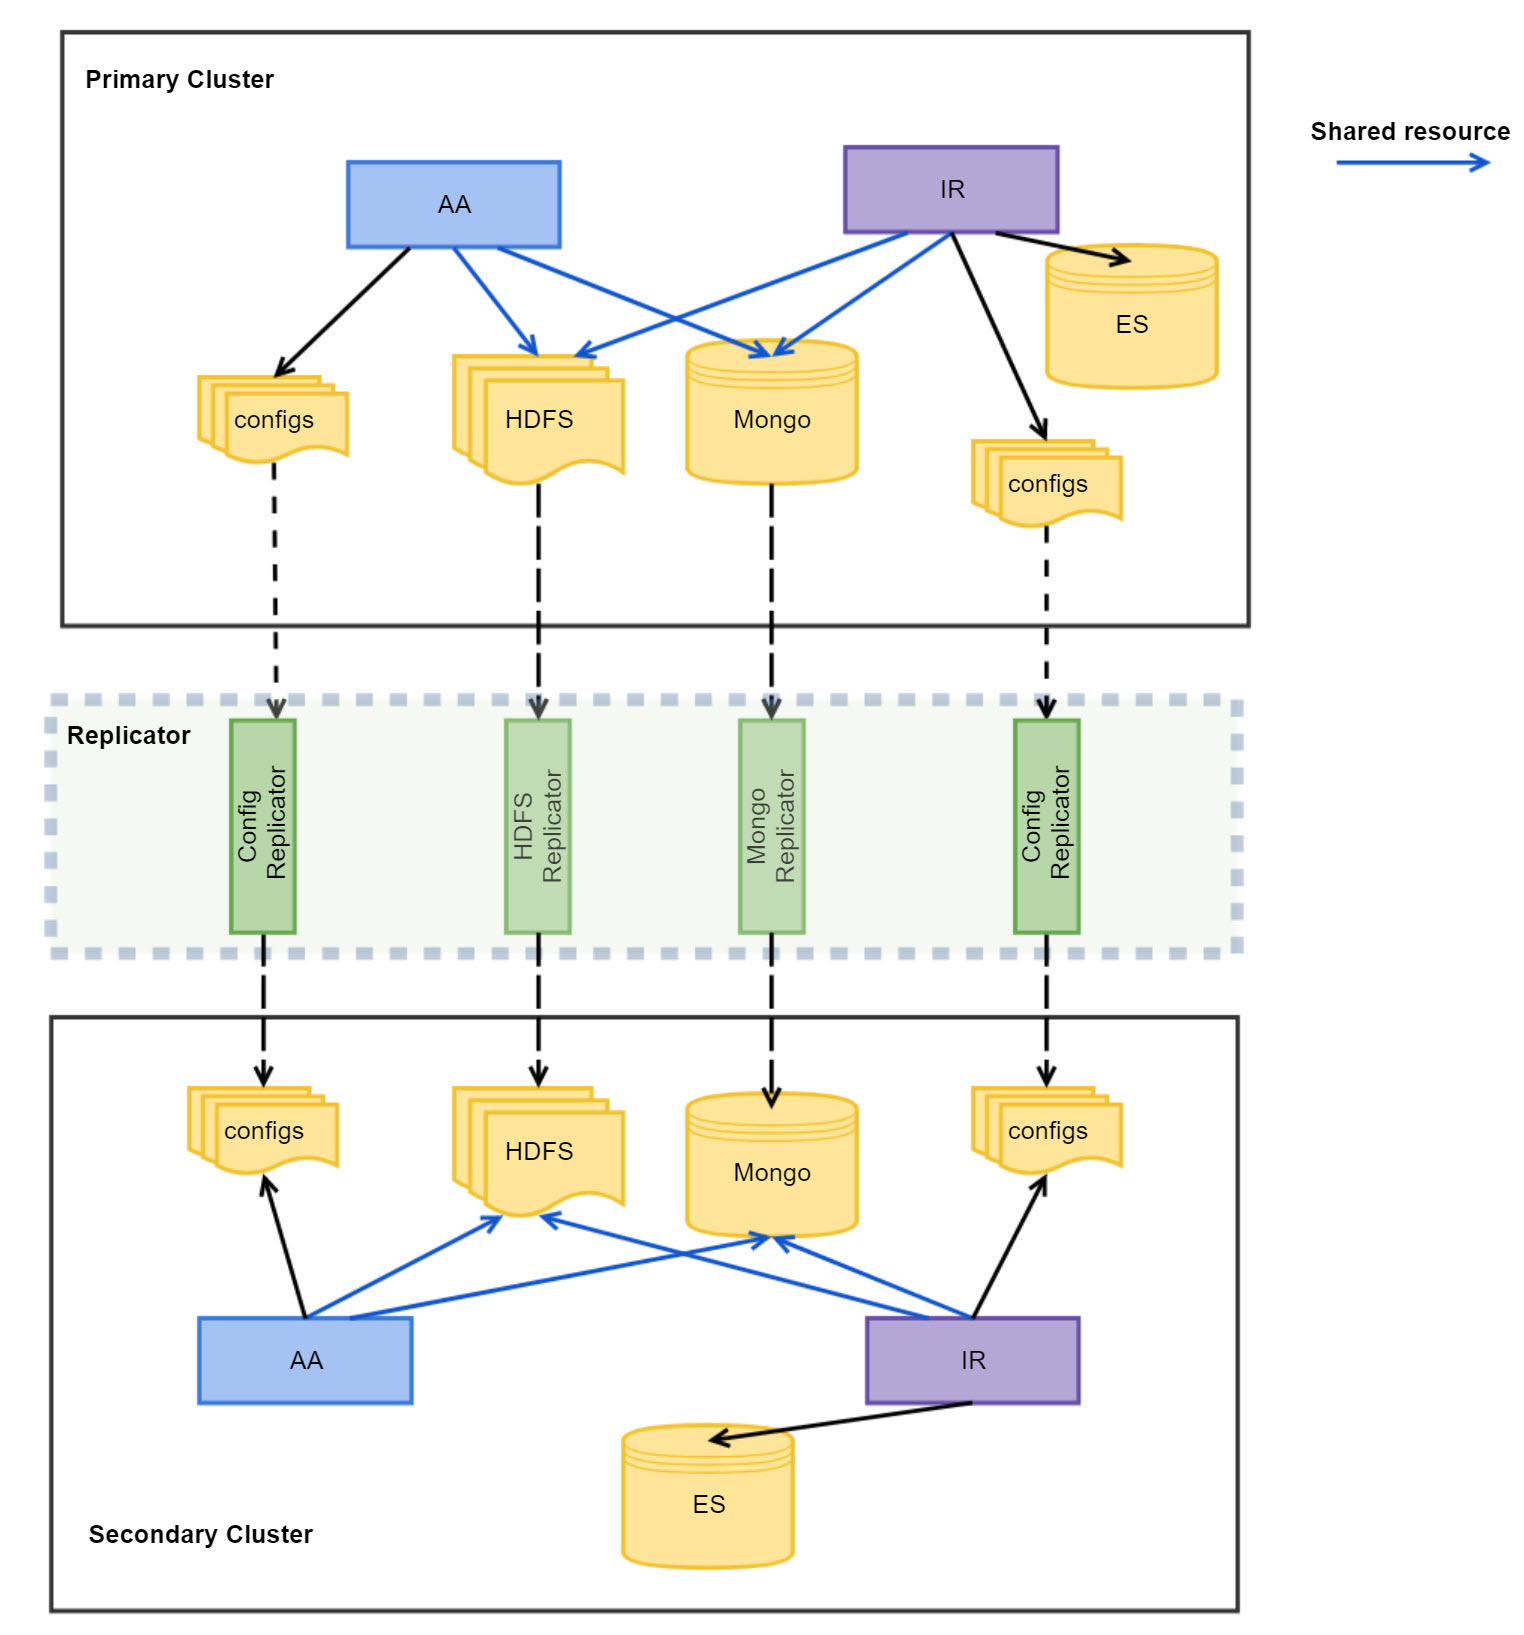 |
Prerequisites
Open port TCP 10022 (bi-directional)
Obtain the IP addresses of both the primary and secondary clusters
Obtain the SSH key to access the primary cluster
Ensure at least 200 megabits per second connection between primary and secondary clusters
Verify that the active and passive clusters have the exact same number of nodes in the same formation. For example, if the second and third nodes on the primary cluster are worker nodes, the second and third nodes on the passive cluster must also be worker nodes. Likewise, if the fifth node on the primary cluster is a Case Manager node, the fifth cluster on the passive cluster must also be a Case Manager node.
Deployment
This process requires you to set up disaster recovery first on the active cluster (primary node) and then on the passive cluster (secondary site).
Note
If you have already set up disaster recovery for Advanced Analytics and are adding disaster recovery for Incident Responder, see Add Case Manager and Incident Responder to Advanced Analytics Disaster Recovery.
Set Up the Active Cluster
On the active site, run the following command:
screen -LS dr_setup
/opt/exabeam_installer/init/exabeam-multinode-deployment.sh
Select Configure disaster recovery (file replication).
Select This cluster is source cluster (usually the primary).
Please select the type of cluster:
1) This cluster is source cluster (usually the primary)
2) This cluster is destination cluster (usually the dr node)
3) This cluster is for file replication (configuration change needed)
This command takes some time to complete. The output is similar to the following:
Getting drive info from host1
Done

PLAY [all] *******************************************************************************************************

TASK [Gathering Facts] *******************************************************************************************
Thursday 17 February 2022  02:05:01 +0000 (0:00:00.142)       0:00:00.142 *****
[0;32mok: [host1][0m

PLAY [Deploy Replicator] *****************************************************************************************

TASK [Gathering Facts] *******************************************************************************************
Thursday 17 February 2022  02:05:04 +0000 (0:00:03.169)       0:00:03.312 *****
[0;32mok: [host1][0m

TASK [replicator : Include set_host_memory_mb.yml] ***************************************************************
Thursday 17 February 2022  02:05:05 +0000 (0:00:01.295)       0:00:04.607 *****
[0;36mincluded: /opt/exabeam_installer/ansible/tasks/set_host_memory_mb.yml for host1[0m

[...]

Thursday 17 February 2022  02:05:44 +0000 (0:00:00.295)       0:00:42.877 *****
===============================================================================
replicator : Pull image from registry --------------------------------------------------------------------- 9.84s
replicator : Enable exabeam-socks-endpoint and ensure restarted ------------------------------------------- 9.22s
Gathering Facts ------------------------------------------------------------------------------------------- 3.17s
replicator : Pull image from registry --------------------------------------------------------------------- 1.62s
replicator : Run registry on deployment host -------------------------------------------------------------- 1.33s
Gathering Facts ------------------------------------------------------------------------------------------- 1.30s
replicator : Copy /opt/exabeam/replicator/config/default/. from docker image exabeam-replicator ----------- 1.15s
replicator : Copy /opt/exabeam/replicator/config/custom/. from docker image exabeam-replicator ------------ 1.11s
replicator : Remove registry container -------------------------------------------------------------------- 0.97s
replicator : Run registry on deployment host -------------------------------------------------------------- 0.89s
******************************************************************************
When the command is complete, the following output is displayed:
There's more to do!!!!

You need to also setup DR on the secondary cluster.
On the secondary master, run:
/opt/exabeam_installer/init/exabeam-multinode-deployment.sh --actions configure_dr

You will need some way to SSH from the DR master to this machine,
either a private key, or a password.
Set Up the Passive Cluster
Copy the SSH key that allows access to the active cluster onto the passive cluster master.
Note
Skip this step if you have a pre-existing key that allows you to SSH from passive to the active cluster.
On the passive site (standby master), run the following command:
screen -LS dr_setup
/opt/exabeam_installer/init/exabeam-multinode-deployment.sh
Select Configure disaster recovery (file replication).
Select This cluster is destination cluster (usually the dr node).
Please select the type of cluster:
1) This cluster is source cluster (usually the primary)
2) This cluster is destination cluster (usually the dr node)
3) This cluster is for file replication (configuration change needed)
The output is similar to the following:
Choices: ['1', '2', '3']: 2
**************************************************************************************
If you have not yet setup DR on the source cluster (usually primary), STOP now!!!!
Ignore this warning if you have already configured the source cluster.
It is safe to press CTRL-C at this prompt (only here).
**************************************************************************************
Do one of the following:
If you have an on-premises deployment, select password.
If your deployment is not on-premises (such as with a VM), select SSH, and then enter the path to the private key file.
The source cluster's SSH key will replace the one for this cluster. How do you want to pull the source cluster SSH key?
1) password
2) SSH key
Important
If the deployment fails after entering the password, proceed to step 6.
If the deployment is successful, the passive cluster connects to the active cluster with the private key provided. If there is no SSH key at the passive cluster, select Option 1 and follow the prompts. You will need to provide user credentials (with sufficient privileges) to either access the active cluster master to retrieve the SSH key or generate a new key.
The output is similar to the following:
************************** GROUP VARS *************************
[all]
aa_mongo_replication: false
ansible_port: 22
ansible_ssh_private_key_file: /opt/exabeam_installer/.ssh/key.pem
ansible_ssh_user: exabeam
calico_network_subnet: 10.225.224.0/20
deployment_host: 10.200.3.59
dl_mongo_replication: false
dns_servers: []
docker_bip: 172.17.0.1/16
initial_user: exabeam
initial_user_needs_password: true
initial_user_ssh_key: null
ip_to_replicate: 10.200.1.250
is_dest_for_replication: true
is_source_for_replication: false
localfs_certs_root_dir: /opt/exabeam_installer/certs
manage_firewall: true
manage_os_configs: true
manage_partitioning: true
manage_rpms: true
needs_stig: false
ntp_server: pool.ntp.org
products:
  - uba
skip_audit_config: false
use_aa_legacy_memory_settings: false
use_iface: eno2
use_thirdparty_ca: false

[mongodb]
mongodb_configsvr_wired_tiger_cache_size_gb: 1
mongodb_shard_wired_tiger_cache_size_gb: auto

[docker]
docker_tags:
  exa_security: c2102.5_19
  exabeam-aa-api: I56.10_2
  exabeam-analytics: I56.10_2
  exabeam-base: v1.0.0
  exabeam-calico-node: v1.0.0

[...]

TASK [ssh : Add slave node host keys to known hosts file] ********************************************************
Thursday 17 February 2022  02:47:50 +0000 (0:00:00.232)       0:00:18.979 *****
[0;36mincluded: /opt/exabeam_installer/ansible/roles/plt/ssh/tasks/add_rsa_host_keys.yml for host1[0m

TASK [ssh : Add all cluster rsa host fields to master /home/exabeam/.ssh/known_hosts file] ***********************
Thursday 17 February 2022  02:47:50 +0000 (0:00:00.089)       0:00:19.068 *****
[0;33mchanged: [host1 -> 127.0.0.1] => (item=host1)[0m
If you received a network error in the previous step, you need to manually change the cluster's Calico subnet by doing the following:
Run the Exabeam installer:
source /opt/exabeam/bin/shell-environment.bash
multinode_init.py
Select Nuke existing services.
Please choose one of the actions below:
1)  Deploy cluster
2)  Run precheck
3)  Run postcheck
4)  Run upgrade_precheck
5)  Add new nodes to the cluster
6)  Nuke existing services
7)  Nuke existing services and deploy
8)  Balance hadoop (run if adding nodes failed the first time)
9)  Generate inventory file on disk
10)  Install pre-approved CentOS package updates
11)  Change network settings
12)  Run migration service to move ES data off host1,2,3 (dl_management)
13)  Detect Network Source/Destination Check
14)  Exit

Choices: ['1', '2', '3', '4', '5', '6', '7', '8', '9', '10', '11', '12', '13', '14']: default (1): 6
After the nuke is complete, update your group vars with the subnet that you’d like to make your Calico subnet. The typical default is a /20 CIDR block, but it can be as large as you need.
Note
A CIDR block smaller than /20 is not recommended.
vi /opt/exabeam_installer/group_vars/all.yml#Change the value for 'calico_network_subnet'. Default will be 10.50.48.0/20After correcting the Calico network subnet, run the installer again and this time choose the Deploy cluster option:
(.env) [exabeam@dev-20200219-065818-1 group_vars]$
multinode_init.pyPlease choose one of the actions below: 1) Upgrade from existing version 2) Deploy cluster 3) Run precheck 4) Run postcheck 5) Run upgrade_precheck 6) Add product to the cluster 7) Enable mongo replication for AA 8) Add new nodes to the cluster.(THIS IS NOT HOW YOU COULD ADD CM. PLEASE USE "Add product to the cluster" INSTEAD) 9) Nuke existing services 10) Nuke existing services and deploy 11) Balance hadoop (run if adding nodes failed the first time) 12) Generate inventory file on disk 13) Configure disaster recovery(file replication) 14) Promote Disaster Recovery Cluster to be Primary 15) Install pre-approved CentOS package updates 16) Change network settings 17) Run migration service to move ES data off host1,2,3 (dl_management) 18) Detect Network Source/Destination Check 19) Exit Choices: ['1', '2', '3', '4', '5', '6', '7', '8', '9', '10', '11', '12', '13', '14', '15', '16', '17', '18', '19']: default (1): 2When the disaster recovery deployment is complete, the following output appears:
******************************************************************************Deploy completed successfully!For detailed deployment log refer to /opt/exabeam_installer/multinode-init.logTotal execution time 0:12:27******************************************************************************
After configuring disaster recovery, start the replicator by running the following command:
sos; replicator-socks-start; replicator-start
Fail Over to Passive Cluster
This topic outlines the procedures for failing over to the passive site when the active site goes down and how to fail back when restoring the site. Exabeam recommends the following policy for failback: demote the failed cluster to become the new passive cluster moving forward.
Consider the following scenario with Cluster A as the Active Cluster and Cluster B as the Passive Cluster:
Failover Process: When Cluster A fails, Cluster B takes over as the active cluster.
Failback Process: Once Cluster A is ready to come back online, it reverts to being a passive cluster. Cluster A will remain passive until it achieves complete data synchronization with Cluster B. After synchronization is complete, Cluster A can be promoted back to an active cluster.
Note
(Recommended) Open an Exabeam support case to let Exabeam know that you are experiencing a situation that requires disaster recovery.
Make the Passive Cluster (Secondary Site) Become Active
Log on to the passive cluster and ensure docker is running.
docker psThe output is similar to the following:
CONTAINER ID        IMAGE                              COMMAND                  CREATED             STATUS              PORTS               NAMES
985202b2f2da        exabeam-eds                        "/usr/bin/java -XX:E…"   26 minutes ago      Up 26 minutes                           exabeam-eds
f6a4f2ad6f4d        exabeam-replicator                 "java -DlogDir=/opt/…"   27 minutes ago      Up 27 minutes                           exabeam-replicator
53bf0750626a        exabeam-cloud-connection-service   "/usr/bin/java -clas…"   34 minutes ago      Up 34 minutes                           exabeam-cloud-connection-service-host1
f316589a1ff1        exabeam-ds-server                  "java -DlogDir=/opt/…"   34 minutes ago      Up 34 minutes                           exabeam-ds-server
32eb80bdfb2a        exabeam-ganglia                    "gmond --foreground"     34 minutes ago      Up 34 minutes                           ganglia-worker-host1
1b1ef3ef2e1b        exabeam-analytics                  "/opt/exabeam/bin/ex…"   35 minutes ago      Up 35 minutes                           exabeam-analytics-ui
247a7ea4c1da        exabeam-content-service            "java -classpath /op…"   36 minutes ago      Up 36 minutes                           exabeam-content-service-host1
c144062780c6        exabeam-web-common                 "java -classpath /op…"   37 minutes ago      Up 37 minutes                           exabeam-web-common
ab05d40c7d0c        exabeam-ganglia                    "bash -c 'chown -R g…"   37 minutes ago      Up 37 minutes                           ganglia-master
146b99c332bd        exabeam-zookeeper                  "/opt/zookeeper/bin/…"   39 minutes ago      Up 39 minutes                           zookeeper-host1
3a70ab4a787a        exabeam-calico-node                "/bin/blackbox --con…"   42 minutes ago      Up 42 minutes                           exabeam-blackbox-exporter-host1
1cbc43c78e8b        exabeam-load-balancer              "/docker-entrypoint.…"   53 minutes ago      Up 53 minutes                           exabeam-load-balancer-host1
467ffc7b39ec        exabeam-hadoop                     "/mnt/custom-configs…"   54 minutes ago      Up 54 minutes                           hadoop-exporter-namenode-host1
32b6fd281dd6        exabeam-hadoop                     "hdfs datanode -D df…"   55 minutes ago      Up 55 minutes                           hadoop-data-host1-f
36c7f1bede42        exabeam-hadoop                     "hdfs datanode -D df…"   55 minutes ago      Up 55 minutes                           hadoop-data-host1-e
0847bb069ae2        exabeam-hadoop                     "hdfs datanode -D df…"   55 minutes ago      Up 55 minutes                           hadoop-data-host1-d
7c6670d2d8a1        exabeam-hadoop                     "hdfs datanode -D df…"   55 minutes ago      Up 55 minutes                           hadoop-data-host1-c
7c2179c853db        exabeam-hadoop                     "hdfs datanode -D df…"   55 minutes ago      Up 55 minutes                           hadoop-data-host1-b
440ea7de6e7d        exabeam-hadoop                     "hdfs datanode -D df…"   55 minutes ago      Up 55 minutes                           hadoop-data-host1-a
3245c40b684d        exabeam-hadoop                     "hdfs namenode"          56 minutes ago      Up 55 minutes                           hadoop-master-host1
9a555c7023ef        exabeam-mongo                      "mongos --sslMode al…"   57 minutes ago      Up 57 minutes                           mongodb-router-host1
f666368077f5        exabeam-mongo                      "mongod --setParamet…"   57 minutes ago      Up 57 minutes                           mongodb-shard-host1
0791fb9fa0b6        exabeam-mongo                      "mongod --sslMode al…"   57 minutes ago      Up 57 minutes                           mongodb-configsvr-host1
19bc84fd0052        exabeam-mongo                      "/data/mongodb_expor…"   57 minutes ago      Up 57 minutes                           mongodb-exporter-router-host1
a6639f1eeb8e        exabeam-mongo                      "/data/mongodb_expor…"   57 minutes ago      Up 57 minutes                           mongodb-exporter-shard-host1
fcc5343cf759        exabeam-mongo                      "/data/mongodb_expor…"   58 minutes ago      Up 58 minutes                           mongodb-exporter-configsvr-host1
3e90e3bd8ec7        exabeam-prometheus                 "/bin/prometheus --c…"   About an hour ago   Up About an hour                        prometheus-host1
081aac5929f3        exabeam-prometheus                 "/bin/alertmanager -…"   About an hour ago   Up About an hour                        alertmanager-host1
9a912083d187        exabeam-prometheus                 "/bin/cadvisor --por…"   About an hour ago   Up About an hour                        cadvisor-host1
0afc6b6dd198        exabeam-calico-node                "start_runit"            About an hour ago   Up About an hour                        calico-node
Stop the replicator.
replicator-socks-stop; replicator-stopAfter stopping the replicator, run the following deployment script:
screen -LS dr_failover
/opt/exabeam_installer/init/exabeam-multinode-deployment.sh
Select Promote Disaster Recovery Cluster to be Primary.
This step promotes the passive cluster to be the active.
Please choose one of the actions below:
1)  Deploy cluster
2)  Run precheck
3)  Run postcheck
4)  Run upgrade_precheck
5)  Add product to the cluster
6)  Add new nodes to the cluster.(THIS IS NOT HOW YOU COULD ADD CM. PLEASE USE "Add product to the cluster" INSTEAD)
7)  Nuke existing services
8)  Nuke existing services and deploy
9)  Balance hadoop (run if adding nodes failed the first time)
10)  Configure disaster recovery(file replication)
11)  Promote Disaster Recovery Cluster to be Primary
12)  Install pre-approved CentOS package updates
13)  Change network settings
14)  Run migration service to move ES data off host1,2,3 (dl_management)
15)  Detect Network Source/Destination Check
16)  Perform functional testing
17)  Replace failed drive (V2)
18)  Exit

Choices: ['1', '2', '3', '4', '5', '6', '7', '8', '9', '10', '11', '12', '13', '14', '15', '16', '17', '18']: 11
Getting drive info from host1
Done
This command may take some time to complete. The output is similar to the following:
PLAY [all] *******************************************************************************************************

TASK [Gathering Facts] *******************************************************************************************
Thursday 17 February 2022  03:32:51 +0000 (0:00:00.145)       0:00:00.145 *****
[0;32mok: [host1][0m

PLAY [Deploy Replicator] *****************************************************************************************

TASK [Gathering Facts] *******************************************************************************************
Thursday 17 February 2022  03:32:56 +0000 (0:00:04.482)       0:00:04.628 *****
[0;32mok: [host1][0m

TASK [replicator : Include set_host_memory_mb.yml] ***************************************************************
Thursday 17 February 2022  03:32:58 +0000 (0:00:02.006)       0:00:06.635 *****
[0;36mincluded: /opt/exabeam_installer/ansible/tasks/set_host_memory_mb.yml for host1[0m

TASK [replicator : Get total memory on the host] *****************************************************************
Thursday 17 February 2022  03:32:58 +0000 (0:00:00.194)       0:00:06.830 *****
[0;33mchanged: [host1][0m
After the passive cluster is promoted to active, stop the docker.
sos; everything-stopIt can take around 15 to 20 minutes to stop all services depending upon the number of nodes in the cluster.
When you run the command, you should see output that is similar to the following:
PLAY [Stop all hosts] ********************************************************************************************

TASK [Gathering Facts] *******************************************************************************************
[0;32mok: [host1][0m

TASK [include_tasks] *********************************************************************************************
[0;36mincluded: /opt/exabeam_installer/ansible/tasks/management/control/control_all.yml for host1[0m

TASK [include_tasks] *********************************************************************************************
[0;36mincluded: /opt/exabeam_installer/ansible/playbooks/management/../../tasks/management/control/stop_all.yml for host1[0m

TASK [include_tasks] *********************************************************************************************
[0;36mincluded: /opt/exabeam_installer/ansible/playbooks/management/../../tasks/management/control/glob_control.yml for host1[0m
[0;36mincluded: /opt/exabeam_installer/ansible/playbooks/management/../../tasks/management/control/glob_control.yml for host1[0m
[0;36mincluded: /opt/exabeam_installer/ansible/playbooks/management/../../tasks/management/control/glob_control.yml for host1[0m
[0;36mincluded: /opt/exabeam_installer/ansible/playbooks/management/../../tasks/management/control/glob_control.yml for host1[0m
[0;36mincluded: /opt/exabeam_installer/ansible/playbooks/management/../../tasks/management/control/glob_control.yml for host1[0m
[0;36mincluded: /opt/exabeam_installer/ansible/playbooks/management/../../tasks/management/control/glob_control.yml for host1[0m
[0;36mincluded: /opt/exabeam_installer/ansible/playbooks/management/../../tasks/management/control/glob_control.yml for host1[0m
[0;36mincluded: /opt/exabeam_installer/ansible/playbooks/management/../../tasks/management/control/glob_control.yml for host1[0m
[0;36mincluded: /opt/exabeam_installer/ansible/playbooks/management/../../tasks/management/control/glob_control.yml for host1[0m
[0;36mincluded: /opt/exabeam_installer/ansible/playbooks/management/../../tasks/management/control/glob_control.yml for host1[0m
[0;36mincluded: /opt/exabeam_installer/ansible/playbooks/management/../../tasks/management/control/glob_control.yml for host1[0m
[0;36mincluded: /opt/exabeam_installer/ansible/playbooks/management/../../tasks/management/control/glob_control.yml for host1[0m
[0;36mincluded: /opt/exabeam_installer/ansible/playbooks/management/../../tasks/management/control/glob_control.yml for host1[0m
[0;36mincluded: /opt/exabeam_installer/ansible/playbooks/management/../../tasks/management/control/glob_control.yml for host1[0m
[0;36mincluded: /opt/exabeam_installer/ansible/playbooks/management/../../tasks/management/control/glob_control.yml for host1[0m
[0;36mincluded: /opt/exabeam_installer/ansible/playbooks/management/../../tasks/management/control/glob_control.yml for host1[0m
[0;36mincluded: /opt/exabeam_installer/ansible/playbooks/management/../../tasks/management/control/glob_control.yml for host1[0m
[0;36mincluded: /opt/exabeam_installer/ansible/playbooks/management/../../tasks/management/control/glob_control.yml for host1[0m
[0;36mincluded: /opt/exabeam_installer/ansible/playbooks/management/../../tasks/management/control/glob_control.yml for host1[0m
Start docker again.
docker-startRun the following command to start all services:
everything-startIt can take around 15 to 20 minutes to start all services depending upon the number of nodes in the cluster.
When you run the command, you should see output that is similar to the following:
PLAY [Start all hosts] *******************************************************************************************

TASK [Gathering Facts] *******************************************************************************************
[0;32mok: [host1][0m

TASK [include_tasks] *********************************************************************************************
[0;36mincluded: /opt/exabeam_installer/ansible/tasks/management/control/control_all.yml for host1[0m

TASK [include_tasks] *********************************************************************************************
[0;36mskipping: [host1][0m

TASK [include_tasks] *********************************************************************************************
[0;36mincluded: /opt/exabeam_installer/ansible/playbooks/management/../../tasks/management/control/start_all.yml for host1[0m

TASK [include_tasks] *********************************************************************************************
[0;36mincluded: /opt/exabeam_installer/ansible/playbooks/management/../../tasks/management/control/glob_control.yml for host1[0m
[0;36mincluded: /opt/exabeam_installer/ansible/playbooks/management/../../tasks/management/control/glob_control.yml for host1[0m
[0;36mincluded: /opt/exabeam_installer/ansible/playbooks/management/../../tasks/management/control/glob_control.yml for host1[0m
[0;36mincluded: /opt/exabeam_installer/ansible/playbooks/management/../../tasks/management/control/glob_control.yml for host1[0m

[...]

TASK [Expand globs for etcd.service] *****************************************************************************
[0;33mchanged: [host1][0m

TASK [include_tasks] *********************************************************************************************
[0;36mincluded: /opt/exabeam_installer/ansible/playbooks/management/../../tasks/management/control/control_unit.yml for host1[0m
If using a Syslog server, switch the Syslog server to push logs to the new active cluster environment (secondary site).
If you have deployed Helpdesk Communications, restart two-way email service in the UI.
Start Log Ingestion and Analytics Engine from the Exabeam Engine page.
Make the Failed Active Cluster (Primary Site) Become Passive After Recovery
Warning
To synchronize data lost during its outage, the restored cluster must first be demoted. Do not immediately promote the restored cluster back to active status after recovery.
Log on to the existing active and ensure docker is running.
sos; docker psRun the following deployment script:
screen -LS dr_failover
/opt/exabeam_installer/init/exabeam-multinode-deployment.sh
Select option Configure Disaster Recovery.
Select This cluster is destination cluster (usually the dr node).
Please select the type of cluster:
1) This cluster is source cluster (usually the primary)
2) This cluster is destination cluster (usually the dr node)
3) This cluster is for file replication (configuration change needed)
Enter the IP address of the source cluster.
What is the IP of the source cluster?
Do one of the following:
If you have an on-premises deployment, select password.
If your deployment is not on-premises (such as with a VM), select SSH, and then enter the path to the private key file.
The source cluster's SSH key will replace the one for this cluster. How do you want to pull the source cluster SSH key?
1) password
2) SSH key
Run the following command to stop all services:
sos; everything-stopIt can take around 15 to 20 minutes to stop all services depending upon the number of nodes in the cluster.
After the recovered cluster is demoted, start docker again:
docker-startRun the following command to start all services:
everything-startIt can take around 15 to 20 minutes to start all services depending upon the number of nodes in the cluster.
Failback to Passive Site (Original Primary) Cluster
Demote Active Cluster (Secondary Site) Back to Passive After Synchronization
Log on to the current active cluster and ensure docker is running.
sos; docker psStop the replicator.
replicator-socks-stop; replicator-stopAfter stopping the replicator, run the following deployment script:
screen -LS dr_failback
/opt/exabeam_installer/init/exabeam-multinode-deployment.sh
Select Configure Disaster Recovery.
Set the cluster as Disaster Recovery (Non Primary) to demote the active (former standby) cluster back to standby.
After the active (former passive) cluster is demoted to passive, stop docker.
sos; everything-stopIt can take around 15 to 20 minutes to stop all services depending upon the number of nodes in the cluster.
After everything is done, start docker again.
docker-startRun the following command to start all services:
everything-startIt can take around 15 to 20 minutes to start all services depending upon the number of nodes in the cluster.
Promote Restored Cluster (Original Primary) to Active
Log on to the restored cluster master and ensure docker is running.
sos; docker psRun the following deployment script:
screen -LS dr_failback
/opt/exabeam_installer/init/exabeam-multinode-deployment.sh
Select Promote Disaster Recovery Cluster to be Primary.
This step promotes the recovered cluster to back to active status.
Run the following command to stop all services:
sos; everything-stopIt can take around 15 to 20 minutes to stop all services depending upon the number of nodes in the cluster.
After the restored cluster is promoted, start docker again.
docker-startRun the following command to start all services:
everything-startIt can take around 15 to 20 minutes to start all services depending upon the number of nodes in the cluster.
If you have deployed Incident Responder, restart incident feed log ingestion in the UI.
Navigate to Settings > Case Manager > Incident Ingestion > Incident Feeds.
Click Restart Log Ingestion Engine.
If you have deployed Helpdesk Communications, restart two-way email service in the UI.
Navigate to Settings > Case Manager > Incident Ingestion > 2-Way Email.
Click the pencil/edit icon associated with the applicable email configuration.
Click Restart.
If using a Syslog server, switch the Syslog server to push logs to the active cluster (primary site). Start Log Ingestion and Analytics Engine from the Exabeam Engine page.
Replicate Specific Files Across Clusters
Warning
You can only perform this configuration with the assistance of Exabeam Customer Success Engineer.
File replication across clusters leverages Advanced Analytics and Incident Responder disaster recovery functionality, which replicates entire cluster configurations, context, user generated data, logs/events, and HDFS files (for Incident Responder).
Note
Advanced Analytics HDFS files are copied from oldest to newest. Incident Responder HDFS files are copied from newest to oldest.
In certain scenarios, clusters are situated in remote areas with considerable bandwidth restraints. In these rare scenarios, you can configure Advanced Analytics and/or Incident Responder to replicate and fetch only specific files. For example, you can configure your deployment to replicate only compressed event files across clusters.
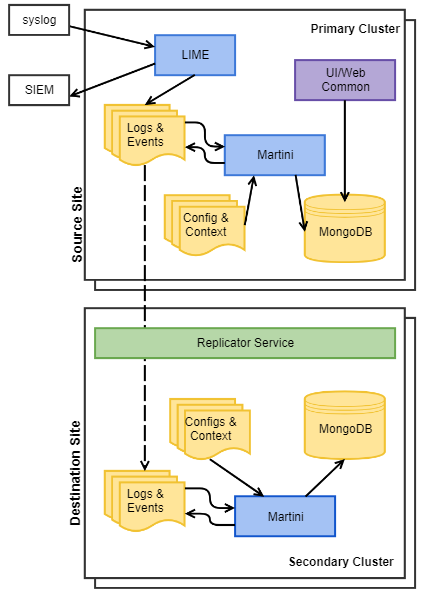
Set Up the Source Cluster on the Primary Site
On the primary site, run the following:
screen -LS dr_setup
/opt/exabeam_installer/init/exabeam-multinode-deployment.sh
Select Configure disaster recovery.
Select This cluster is source cluster (usually the primary).
Please select the type of cluster:
1) This cluster is source cluster (usually the primary)
2) This cluster is destination cluster (usually the dr node)
3) This cluster is for file replication (configuration change needed)
Wait for the deployment to finish.
Set Up Destination Cluster on the Secondary Site
On the secondary site, run the following:
screen -LS dr_setup
/opt/exabeam_installer/init/exabeam-multinode-deployment.sh
Select Configure disaster recovery.
Select This cluster is for file replication (configuration change needed).
Please select the type of cluster:
1) This cluster is source cluster (usually the primary)
2) This cluster is destination cluster (usually the dr node)
3) This cluster is for file replication (configuration change needed)
Enter the IP address of the source cluster.
What is the IP of the source cluster?
Select SSH key.
The source cluster's SSH key will replace the one for this cluster. How do you want to pull the source cluster SSH key?
1) password
2) SSH key
Enter the private key path.
What is the path to the private key file?
Wait for the deployment to successfully finish.
Start the replicator.
sos; replicator-socks-start; replicator-startAfter the replicator is started, log on to the standby cluster GUI, navigate to Context Setup , and then click the Generate Context to gather context from the active cluster to synchronize the standby cluster.
Enable or Disable Items in the Replicated Cluster
Open the following custom configuration file for the replicated cluster:
/opt/exabeam/config/custom/custom_replicator_disable.conf.Enable or disable items as needed by entering
trueorfalse.For example, if you want to fetch compressed event files, set the
Enabledvalue for theevt.gzfile type totrue, as shown in the following:{ EndPointType = HDFS Include { Dir = "/opt/exabeam/data/input" FilePattern = [".evt.gz"] } Enabled = true }
Add Case Manager and Incident Responder to Advanced Analytics Disaster Recovery
Hardware and Virtual Deployments Only
If you are upgrading from Advanced Analytics SMP 2019.1 (i48) or lower and have configured disaster recovery for Advanced Analytics, add Case Manager and Incident Responder to the existing Advanced Analytics disaster recovery.
Warning
Configure this only with an Exabeam Customer Success Engineer.
1. Stop the Replicator
Ensure that the Advanced Analytics replication is current.
To ensure that the passive site matches the active site, compare the files in HDFS, the local file system, and MongoDB.
Source the shell environment:
. /opt/exabeam/bin/shell-environment.bashOn the active cluster, stop the replicator:
sos; replicator-socks-stop; replicator-stop
2. Upgrade the Passive and Active Advanced Analytics Clusters
Note
Both the primary and secondary clusters must be on the same release version at all times.
Warning
If you have an existing custom UI port, please set the web_common_external_port variable in /opt/exabeam_installer/group_vars/all.yml. Otherwise, you may lose access at the custom UI port after the clusters upgrade.
web_common_external_port: <UI_port_number>
(Optional) Disable Exabeam Cloud Telemetry Service.
If you use the SkyFormation cloud connector service, stop the service.
For SkyFormation v.2.1.18 and higher, run:
sudo systemctl stop sk4compose
For SkyFormation v.2.1.17 and lower, run:
sudo systemctl stop sk4tomcat
sudo systemctl stop sk4postgres
Note
After you've finished upgrading the clusters, the SkyFormation service automatically starts. To upgrade to the latest version of SkyFormation, please refer to the Update SkyFormation app on an Exabeam Appliance guide at support.skyformation.com.
From Exabeam Community, download the Exabeam_[product]_[build_version].sxb file of the version you're upgrading to. Place it anywhere on the master node, except
/opt/exabeam_installer, using Secure File Transfer Protocol (SFTP).Change the permission of the file:
chmod +x Exabeam_[product]_[build_version].sxb
Start a new terminal session using your Exabeam credentials (do not run as ROOT).
To avoid accidentally terminating your session, initiate a screen session.
screen -LS [yourname]_[todaysdate]
Execute the command (where
yyis the iteration number andzzis the build number):./Exabeam_[product]_[build_version].sxb upgrade
The system auto-detects your existing version. If the version cannot be detected, you are prompted to enter the existing version you are upgrading from.
When the upgrade finishes, decide whether to start the Analytics Engine and Log Ingestion Message Extraction engine:
Upgrade completed. Do you want to start exabeam-analytics now? [y/n] y
Upgrade completed. Do you want to start lime now? [y/n] y
3. Add Case Manager to Advanced Analytics
SSH to the primary Advanced Analytics machine.
Start a new screen session:
screen –LS new_screen
/opt/exabeam_installer/init/exabeam-multinode-deployment.sh
When asked to make a selection, choose Add product to the cluster.
From these actions, choose option
4.1) Upgrade from existing version 2) Deploy cluster 3) Run precheck 4) Add product to the cluster 5) Add new nodes to the cluster 6) Nuke existing services 7) Nuke existing services and deploy 8) Balance hadoop (run if adding nodes failed the first time) 9) Roll back to previously backed up version 10) Generate inventory file on disk 11) Configure disaster recovery 12) Promote Disaster Recovery Cluster to be Primary 13) Install pre-approved CentOS package updates 14) Change network settings 15) Generate certificate signing requests 16) Exit Choices: ['1', '2', '3', '4', '5', '6', '7', '8', '9', '10', '11', '12', '13', '14', '15', '16']: default (1): 4Indicate how the node should be configured:
Which product(s) do you wish to add? ['ml', 'dl', 'cm']: cm
How many nodes do you wish to add? (minimum: 0): 1
What is the IP address of node 1 (localhost/127.0.0.1 not allowed)? 10.10.2.40
What are the roles of node 1? ['cm', 'uba_slave']: cm
To configure Elasticsearch, Kafka, DNS servers, and disaster recovery, it's best that you use these values:
How many elasticsearch instances per host? [2] 1
What's the replication factor for elasticsearch? 0 means no replication. [0]
How much memory in GB for each elasticsearch instance? [16] 16
How much memory in GB for each kafka instance? [5]
Would you like to add any DNS servers? [y/n] n
Do you want to setup disaster recovery? [y/n] n
Once the installation script successfully completes, restart the Analytics Engine.
4. Configure Disaster Recovery on the Advanced Analytics and Case Manager Passive Clusters
On the secondary site, run:
screen -LS dr_setup
/opt/exabeam_installer/init/exabeam-multinode-deployment.sh
Select Configure disaster recovery.
Select This cluster is for file replication (configuration change needed).
Please select the type of cluster:
1) This cluster is source cluster (usually the primary)
2) This cluster is destination cluster (usually the dr node)
3) This cluster is for file replication (configuration change needed)
Enter the IP address of the source cluster.
What is the IP of the source cluster?
Select SSH key.
The source cluster's SSH key will replace the one for this cluster. How do you want to pull the source cluster SSH key?
1) password
2) SSH key
Enter the private key path.
What is the path to the private key file?
The deployment may take some time to finish.
The primary cluster begins to replicate automatically, but all replication items are disabled. You must manually enable the replication items.
On the secondary site, access the custom configuration file /
opt/exabeam/config/custom/custom_replicator_disable.conf, then enable replication items.For example, if you wish to only fetch compressed event files, then set the
Enabledfield for the [“.evt.gz”] file type totrue:{ EndPointType = HDFS Include { Dir = "/opt/exabeam/data/input" FilePattern = [".evt.gz"] } Enabled = true }Start the replicator:
sos; replicator-start
Log on to the standby cluster GUI.
To gather context from the active cluster to synchronize the standby cluster, navigate to LDAP Import > Generate Context, then click Generate Context.
5. Start the Replicator
On the active cluster, start the replicator:
replicator-socks-start; replicator-start
Manage Security Content in Advanced Analytics
Install, get updates on, uninstall, and upload content packages in Advanced Analytics settings.
Manage all your content packages directly in Advanced Analytics settings, under Admin Operations > Additional Settings > Content Updates, where you retrieve the latest available content packages from the cloud in real time, including both general Exabeam releases and custom fixes you request.
In these settings, a content package that includes custom fixes you requested is called a custom package. A content package from a general Exabeam release is called a default package. It's important that you update your content with each release because the release may contain new parsers and event builders, support new log sources and vendors, or include other additions and fixes that keep your system running smoothly.
If you have an environment that can access the internet, you can pull the latest content packages manually or automatically, select a specific content packages to install, or even schedule content packages to automatically install on a daily or weekly basis, all from the cloud.
If you have an environment that can't access the internet, you can't connect to the cloud. You must view and download the latest content packages from the Exabeam Community, then upload them.
You can only install and upload content packages that contain event builders or parsers.
Manually Install a Content Package
Install a new content package directly from Advanced Analytics settings onto your system.
Select a content package to install from a list of the latest, available content packages. If your environment can't access the internet, you can't install content packages from the cloud. Instead, download the content package from the Exabeam Community or your case ticket, then manually upload it.
A content package from a general Exabeam release is called a default package. It's important that you update your content with each release because the release may contain new parsers and event builders, support new log sources and vendors, or include other additions and fixes that keep your system running smoothly. You can upload multiple default content packages, but only install one default package at a time.
A content package that includes custom fixes you requested is called a custom package. You can upload and install any number of custom packages.
You can only install custom content packages that contain event builders or parsers.
In the navigation bar, click the menu
 , select Settings, then select Core.
Under ADMIN OPERATIONS, select Content Updates.
To install a default content package, click the DEFAULT PACKAGES tab. To install a custom content package, click the CUSTOM PACKAGES tab.
Click INSTALL.
If the package is a default content package and a newer version of one you previously installed, this newer version replaces the older version. You can no longer view or install the older version.
If the package is a custom content package and a newer version of one you already installed, ensure that you uninstall the older version.
Automatically Install Content Packages
Schedule Advanced Analytics to automatically check for and install new content packages on a daily or weekly basis.
If you have an environment that can't access the internet, you can't install content packages from the cloud. Instead, download a content package from the Exabeam Community or your case note, then manually upload it.
Only content packages that contain event builders or parsers are available.
In the navigation bar, click the menu
 , select Settings, then select Core.
Under ADMIN OPERATIONS, select Content Updates.
Click Install Schedule, then toggle Auto Install on.
After Install package, select the day of the week when Advanced Analytics downloads new content.
After at, select the time when Advanced Analytics downloads new content.
Click SAVE. If newer versions of custom content packages were installed, ensure that you uninstall the older version.
Manually Check for New Content Packages
Manually fetch the latest available content packages. You can also set Advanced Analytics to automatically check for new packages every 30 minutes.
If you have an environment that can't access the internet, you can't connect to the cloud to view the latest, available content packages. Instead, check the Exabeam Community for the latest content packages. If you manually refresh the list, Advanced Analytics says you have no new packages.
Only content packages that contain event builders or parsers are available.
In the navigation bar, click the menu
 , select Settings, then select Core.
Under ADMIN OPERATIONS, select Content Updates.
Click refresh
 . Advanced Analytics checks for new default and custom content packages and updates both lists.
Automatically Check for New Content Packages
Set Advanced Analytics to automatically check for new content packages and fetch them every 30 minutes.
This setting automatically checks for new content packages but doesn't install them. To automatically install them, you must schedule it separately.
If you have an environment that can't access the internet, you can't connect to the cloud to view the latest, available content packages. Instead, check the Exabeam Community for the latest content packages.
Only content packages that contain event builders or parsers are available.
In the navigation bar, click the menu
 , select Settings, then select Core.
Under ADMIN OPERATIONS, select Content Updates.
Click Last Update Checked, toggle Auto Updates on, then click SAVE. Advanced Analytics checks for new content packages every 30 minutes and updates the list.
Uninstall a Custom Content Package
Uninstall a custom content package if there's an issue with the package or to remove an older version of a package once you upload a newer version.
A content package from a general Exabeam release is called a default package. A content package that includes custom fixes you requested is called a custom package. You can only uninstall a custom content package, not a default content package. To remove a default content package, you must install another default content package.
In the navigation bar, click the menu
 , select Settings, then select Core.
Under ADMIN OPERATIONS, select Content Updates.
Click the CUSTOM PACKAGES tab, then next to the content package, click UNINSTALL.
Exabeam Hardening
The Exabeam Security Management Platform (SMP) has enabled security features by default that provide stricter controls and data protection. Two examples of what Exabeam has built protection against include Cross-Site Request Forgery (CSRF) and Cross-Origin Resource Sharing (CORS). A default set of filters are defined and enabled in Exabeam configurations. This improves the default security of the environment for all Exabeam services.
For Exabeam SaaS deployments that use Exabeam Advanced Analytics as your Exabeam Cloud Connector identity provider (IdP), Exabeam will update Cloud Connector to v.2.5.86 or later.
No manual configuration is needed for deployments with the following versions or later, as these protections are enabled by default:
Exabeam Advanced Analytics i53.6
Exabeam Data Lake i34.6
Important
This security enhancement has been enabled by default:
Data Lake i34.6 and i35
Advanced Analytics i53.6 and i54.5
It is not enabled by default in:
Data Lake i33 or earlier
Advanced Analytics i52 or earlier
Please follow the hardening guidelines. At the earliest opportunity, please upgrade to a currently supported version of Advanced Analytics and Data Lake .
How to Enable Cross-Site Request Forgery Protection
Cross-Site Request Forgery (CSRF) attacks are web-based vulnerabilities where attackers trick users with trusted credentials to commit unintended malicious actions. CSRF attacks change the states of their targets rather than steal data. Examples include changing account emails and changing passwords.
CSRF protection is available for Exabeam Advanced Analytics and Data Lake and previously inactive. Older versions of Advanced Analytics and Data Lake may manually harden or upgrade to a hardened supported version (Advanced Analytics i53.6 or later and Data Lake i34.6 or later) to enable the security configuration by default.
For information about enabled versions, see Exabeam Hardening.
These protections may affect API calls to the Exabeam SMP; please review customs scripts and APIs used by your organization. Please follow instructions given in Step 1c to conform your scripts.
To enable CSRF protection, apply the following:
For all deployments, the
/opt/exabeam/config/common/web/custom/application.conffile at each master host needs to be configured to enable CSRF protection at service startup.Edit the following parameters in the CONF file:
csrf.enabled=true
csrf.cookie.secure=true
csrf.cookie.name="CSRF_TOKEN"
Restart
web-commonto enable CSRF protection.. /opt/exabeam/bin/shell-environment.bash web-common-restart
Note
Log ingestion will not be interrupted during the restart.
web-commoncan take up to 1 minute to resume services.API calls to Exabeam that utilize
POSTrequests using typesapplication/x-www-form-urlencoded,multipart/form-dataandtext/plainare affected by CSRF configurations. Ensure API clients have headers that hasCsrf-Tokenset to valuenocheck.Continue with the next step.
For Advanced Analytics using Case Manager or Incident Responder , edit
/opt/exabeam/code/soar-python-action-engine/soar/integrations/exabeamaa/connector.py.Find the entry
self._session = SoarSession(base_url=apiurl, timeout=timeout, verify=False)and replace with:self._session = SoarSession(base_url=apiurl, timeout=timeout, verify=False, headers={'Csrf-Token': 'nocheck'})Restart services.
sudo systemctl restart exabeam-soar-python-action-engine-web-server
sudo systemctl restart exabeam-soar-python-action-engine
If SAML is configured, the IdP’s domain needs to be explicitly added to the CORS origins and then apply the new configuration. Please follow steps given in How to Enable Cross-Origin Resource Sharing Protection.
How to Enable Cross-Origin Resource Sharing Protection
Cross-Origin Resource Sharing (CORS) is a browser standard which allows for the resources or functionality of a web application to be accessed by other web pages originating from a different domain -- specifically, the origin. An origin is defined by the scheme (protocol), host (domain), and port of the URL used to access a resource. CORS is a policy that allows a server to indicate any origins other than its own from which a browser should permit loading of resources
CORS protection is available for Exabeam Advanced Analytics and Data Lake and enabled by default in Data Lake i34.6 or Advanced Analytics i53.6 and later versions. Older versions of Advanced Analytics and Data Lake may manually harden or upgrade to a hardened supported version (Advanced Analytics i53.6 or later and Data Lake i34.6 or later) to enable the security configuration by default.
For information about enabled versions, see Exabeam Hardening.
To manually enable CORS protection when it is not enabled by default, apply the following:
For all deployments, the
/opt/exabeam/config/common/web/custom/application.conffile at each master host needs to be configured to enable CORS protection at service startup. Editwebcommon.service.originsparameter the CONF file to match your Exabeam service domain:webcommon.service.origins = ["https://*.exabeam.<your_organization>.com:<listener_port>", <...additional_origins...>]
Here's an example with 2 service origins:
webcommon.service.origins = ["https://*.exabeam.org-name.com", "https://*.exabeam.org-name.com:8484"]
Restart
web-commonto enable CORS protection.. /opt/exabeam/bin/shell-environment.bash web-common-restart
Note
Log ingestion will not be interrupted during the restart.
web-commoncan take up to 1 minute to resume services.
How to Verify Origin and CORS Enforcement with cURL
The verification method presented here uses cURL to test CORS protection once it has been implemented.
You can verify that your environment is enforcing CORS policy with the following (using www.example.com as an origin):
curl -H "Origin: http://www.example.com" --verbose <exabeam_ip_or_hostname>
The response should be 403 Forbidden with the error message Invalid Origin - http:www.example.com.
To verify that CORS is working as intended, modify the origin:
curl -H "Origin: <exabeam_ip_or_hostname>" --verbose <exabeam_ip_or_hostname>
The response should be 200 OK with the Exabeam home page's HTML.
