- What's New in i56
- Updated Threat Intelligence Feeds from ZeroFox
- Improved Filters for Smart Timelines™
- Display More Accurate Times for When Rules Triggered on the Smart Timeline™
- More Accurate Geolocation and Internet Service Provider (ISP) Data for Your Events
- More Helpful Technical Support Information
- Updated Navigation to the Exabeam Community and Documentation Portal
- Troubleshoot Your Own Data Ingestion issues
- Support for the Latest Version of IBM® QRadar® Security Information and Event Management (SIEM)
- Stuck and Failed Parser Detection
- Issues Fixed in Advanced Analytics i56.14
- Issues Fixed in Advanced Analytics i56.13
- Issues Fixed in Advanced Analytics i56.12
- Issues Fixed in Advanced Analytics i56.11
- Issues Fixed in Advanced Analytics i56.10
- Issues Fixed in Advanced Analytics i56.9
- Issues Fixed in Advanced Analytics i56.8
- Issues Fixed in Advanced Analytics i56.7
- Issues Fixed in Advanced Analytics i56.5
What's New in i56
Note
These release notes apply only to on-premises Advanced Analytics deployments. For information on cloud-delivered Advanced Analytics releases, see Cloud-Delivered Advanced Analytics Release Notes in the New-Scale Security Operations Platform documentation.
Updated Threat Intelligence Feeds from ZeroFox
To provide increased accuracy for risk evaluation of users and assets, Exabeam can now leverage threat intelligence feeds from ZeroFox (ZF) across Exabeam products. The ZeroFox feeds provide improved information for indicators of compromise (IoCs) such as IP addresses associated with ransomware and malware attacks.
In most cases, no configuration change is required to begin utilizing ZeroFox threat intelligence. However, if you previously disabled rules or models that utilize the new feeds, you will need to enable them to utilize the new feeds.
The following table displays the rules that leverage the ZeroFox threat intelligence feeds by IoC category:
IoC Category | Rules |
|---|---|
(ZF) IP addresses associated with ransomware attacks |
|
(ZF) IP addresses associated with ransomware or malware attacks |
|
(ZF) Domain names and URLs associated with sites that often contain malware, drive-by compromises, and more |
|
(ZF) Domain names associated with phishing or ransomware | WEB-UD-Phishing |
Improved Filters for Smart Timelines™
With new and improved Smart Timeline filters, it's easier to find and navigate to an event based on a specific detail.
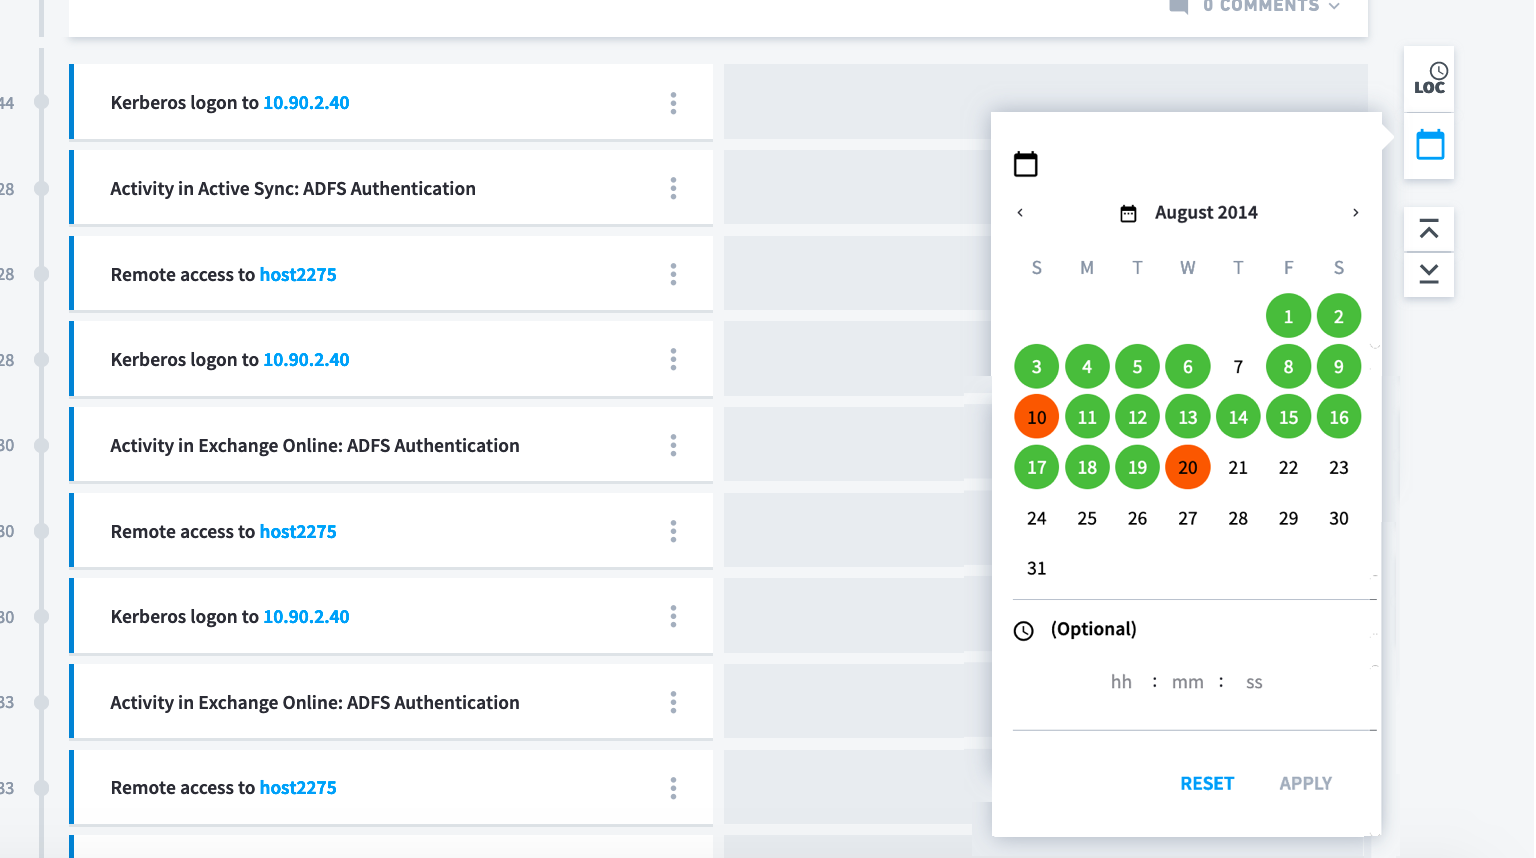
You can now navigate to an event that occurred during a specific time. Previously, you used the calendar to jump to a session on a specific date. Now, you can also specify a time in 24-hour notation. Your Smart Timeline jumps to an event that starts on that time, or the next latest event after that time.

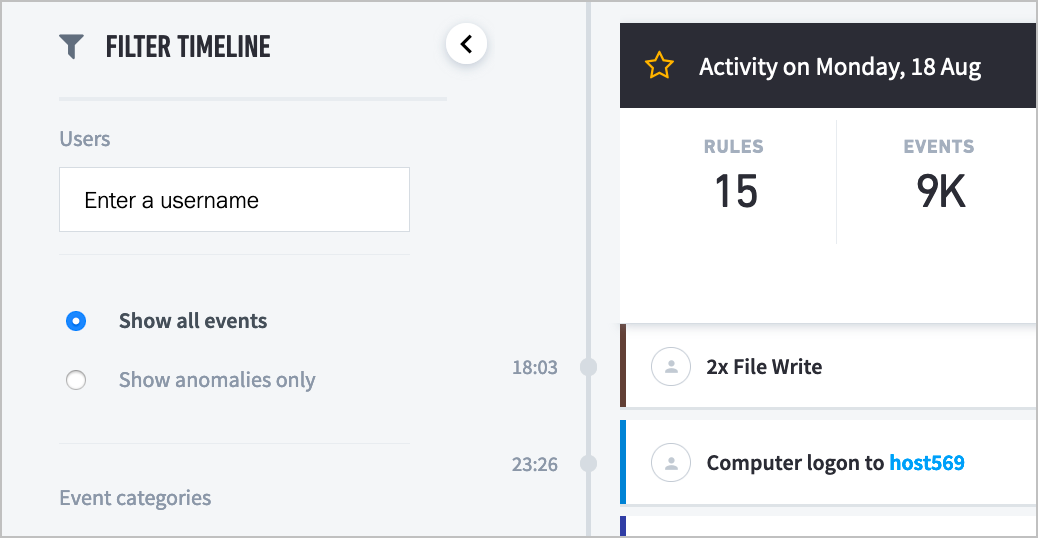
In an asset Smart Timeline, use the new Users filter to view events related to a specific user. Search for and select the user, then apply the filter. You can only filter by one user at a time.

Previously, the session summary information disappeared if you filtered out sessions from your Smart Timeline. Now, this information is always visible at the top of the page, even if you're not filtering for sessions.
Display More Accurate Times for When Rules Triggered on the Smart Timeline™
Configure the Smart Timeline to more accurately display when time-based rules trigger.
The Smart Timeline displays the day of the week and 24-hour time notation when an ingested raw log and triggered a time-related rule, like DC23 (Abnormal session start time) or PA-UTi-A (Badge access at abnormal time).
For these time-based rules, the Smart Timeline displays when the event builder created an event from the raw log, which may not accurately represent when a rule triggered. In some cases, like if your SIEM lags when sending raw logs to Advanced Analytics, there may be up to a delay between when the raw log was created and when it's processed to create an event.
Now, you can configure the Smart Timeline so it displays when the raw log was created, which more accurately represents when anomalous behavior happened.
If you have a hardware deployment, configure this feature by editing the rule and model configuration. If you have a cloud-delivered deployment, configure this feature by contacting Exabeam Customer Success.
Exabeam Documentation: Configure Smart Timeline™ to Display More Accurate Times for When Rules Triggered
More Accurate Geolocation and Internet Service Provider (ISP) Data for Your Events
Your events are enriched with the most updated geolocation and ISP data so your rules and models train on more accurate data, and you can better detect potential threats in your environment.
When Advanced Analytics builds events, it associates the event's IP address with a geolocation or ISP, and enriches the event with this data. To ensure the data is as accurate as possible, Advanced Analytics now pulls from an improved database.
Previously, Advanced Analytics pulled geolocation and ISP data from MaxMind's GeoLite2 database. Now, Advanced Analytics pulls this data from the Neustar's UltraGeoPoint database, which is more accurate and is updated more frequently.
Instead of pulling from the database in a CSV format, Advanced Analytics now pulls data in MaxMind DB (MMDB) binary format, which takes less memory and helps your system run more smoothly.
After you upgrade to i56, models that use geolocation or ISP data train will reset and train on the new values, which may trigger more rules.
More Helpful Technical Support Information
Generate technical support information that includes Analytics Engine and Log Ingestion and Messaging Engine (LIME) rotated logs. These logs help Exabeam Customer Success quickly understand and resolve a problem with your system.
Previously, when you generated a support file for Advanced Analytics, certain critical information could be missing. This missing information was usually found in a rotated log from the Analytics Engine or LIME, which was difficult to retrieve. It took Customer Success a long time to get the information necessary to resolve your issue.
Now, from within Advanced Analytics, you can quickly generate a support file that includes the last five rotated logs. After you generate the file, attach it to your case ticket on the Exabeam Community.

Exabeam Documentation: Generate a Support File
Updated Navigation to the Exabeam Community and Documentation Portal
There's a new way to get the help you need in Advanced Analytics.
Previously, the menu  listed several options: File a Ticket, Got an Idea, What's new, which lead to the Documentation Portal, and Documentation, which lead to the Exabeam Community knowledge articles. We updated these links so they're easier to understand:
To understand the product and how to use it, select Documentation.
To get support from other Exabeam users in the Exabeam Community, select Community.
To create a support case, select Support.
To provide feedback on new features you'd like to see, select Suggest Ideas.
Troubleshoot Your Own Data Ingestion issues
Introducing a self-service mechanism for hardware and virtual deployments that exposes what's really going on when Advanced Analytics ingests data.
An event may appear incorrectly in Smart Timelines because there was an issue with ingesting data into Advanced Analytics. In previous versions, you contacted Exabeam Customer Success to diagnose and triage these issues. They designed and implemented intensive custom solutions just to see what was happening to data in your system.
Now, if you have a hardware or virtual deployment, you can troubleshoot your own data ingestion issues without waiting for Exabeam Customer Success. Using a new mechanism, you can see the status of your data as it's ingested in real time.
You create JSON file that specifies which logs you're tracking and the problem you're troubleshooting, then run a Python script. As logs are ingested into Advanced Analytics, the script prints messages describing what's happening to the log in real time. You use these messages to identify the problem, then take the appropriate steps to resolve it.
Exabeam Documentation: Troubleshoot Advanced Analytics Data Ingestion Issues
Support for the Latest Version of IBM® QRadar® Security Information and Event Management (SIEM)
You can ingest data from IBM QRadar version 7.4.
If you configured IBM QRadar as a log source, Advanced Analytics automatically starts ingesting logs after you upgrade. You don't need to re-configure IBM QRadar as a log source in Advanced Analytics settings or restart IBM QRadar.
Stuck and Failed Parser Detection
Note
The i56 release notes were updated to include information about a backported system enhancement. This enhancement is available if you upgrade to the Advanced Analytics i56.7 release.
To keep Log Ingestion and Messaging Engine (LIME) running, your system detects stuck and failed parsers early and pauses them.
Parsers use regular expressions to extract data from logs. If these regular expressions are incorrect, parsers can enter an infinite loop and get stuck, or fail with a non-timeout exception. Sometimes, parsers can also get stuck when it can't parse incorrect input data. When parsers fail or get stuck, LIME stops working because it can't move forward until the previous parser is done processing.
Now, if a parser takes too long to process, a mechanism pauses those parsers to keep your system running. If the parser exceeds a configured time limit, your system fails the parser with a timeout exception, logs the error at a DEBUG security level, and notes the parser in internal error statistics. Your system periodically checks the error statistics to identify any parsers that have accumulated more than a certain number of errors, then pauses them.
After your system pauses a stuck or failed parser, you can view the parser in the list of paused parsers under System Health. You do not receive a system health alert when a stuck or failed parsers is paused, but you will continue to receive a system health alert when a slow parser is paused.
Exabeam Documentation: Paused Parsers
