- Advanced Analytics
- Understand the Basics of Advanced Analytics
- Configure Log Management
- Set Up Admin Operations
- Set Up Authentication and Access Control
- Additional Configurations
- Configure Rules
- Exabeam Threat Intelligence Service
- Threat Intelligence Service Prerequisites
- View Threat Intelligence Feeds
- Threat Intelligence Context Tables
- View Threat Intelligence Context Tables
- Assign a Threat Intelligence Feed to a New Context Table
- Create a New Context Table from a Threat Intelligence Feed
- Check ExaCloud Connector Service Health Status
- Exabeam Cloud Telemetry Service
- Manage Security Content in Advanced Analytics
- Health Status Page
Paused Parsers
If your parser takes too long to parse a log and meets certain conditions, Advanced Analytics pauses the parser.
To keep your system running smoothly and processing data in real time, Advanced Analytics detects parsers that are performing poorly, then pauses them. Your parsers may perform poorly because:
In both cases, your system calculates whether the parser exceeds configured thresholds and meets certain conditions, then pauses the parser.
When a parser meets the conditions on a Log Ingestion and Messaging Engine (LIME) node, your system pauses the parser only on that node. If you have multiple LIME nodes, it is not automatically paused on all nodes unless it meets these conditions on every node.
When Advanced Analytics pauses a parser on any node, the parser appears in a list of paused parsers. You receive a system health alert only for paused slow parsers, not stuck or failed parsers.
Conditions for Pausing Slow Parsers
To identify a slow parser, your system places the parser in a cache. Every configured period, OutputParsingTimePeriodInMinutes (five minutes by default), it calculates how long it takes, on average, for the parser to parse a log. It compares this average to a configurable threshold, ParserDisableThresholdInMills, in lime.conf.
To calculate a percentage of how much the parser makes up of the total parsing time, your system divides the previously-calculated average by the total time all parsers took to parse an event in the same five minute period. It compares the percentage to another configurable threshold, ParserDisableTimePercentage, in lime.conf.
Your system conducts a second round of checks if the parser meets certain conditions:
The average time it takes for the parser to parse a log exceeds a threshold,
ParserDisableThresholdInMills(seven milliseconds by default).The parser constitutes more than a certain percentage,
ParserDisableTimePercentage(50 percent by default), of the total parsing time of all parsers.
During another five-minute period, your system checks the parser for a second time. If the parser meets the same conditions again, your system pauses the parser.
If you have a cloud-delivered deployment, contact Exabeam Customer Success to configure these variables.
Conditions for Pausing Stuck Parsers
To identify a stuck parser, your system measures how long it takes for a parser to parse a log. If the time exceeds a threshold, StuckParserWaitTimeoutMillis (100 milliseconds by default), the parser fails with a timeout exception. Your system logs the error at a DEBUG security level and notes the parser in internal error statistics.
In each configured period, ParserMaxErrorTimeWindowForChecksMillis (9000 miliseconds, or 15 minutes, by default), your system checks the internal error statistics for any parsers that have accumulated a certain number of errors. If the errors exceed a threshold, ParserMaxErrorNumberThreshold (100 errors by default), the parser is paused and removed from the internal error statistics.
If you have a cloud-delivered deployment, contact Exabeam Customer Success to configure these variables.
View Paused Parsers
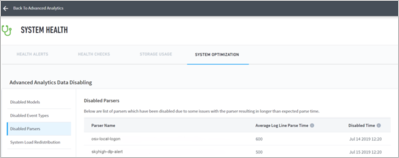
To keep your system running smoothly and processing data in real time, Advanced Analytics detects slow or inefficient parsers, then pauses them. View all paused parsers in Advanced Analytics under System Health.
In the sidebar, click the menu
 , then select System Health.
Select the System Optimization tab.
Select Paused Parsers.

View a list of paused parsers, sorted alphabetically by parser name, and information about them, including:
Parser Name – The name of the paused parser.
Average Log Line Parse Time – Average time the parser took to parse each event.
Paused Time – Date and time when the parser was paused.
