- Welcome to Threat Detection Management
- Analytics Rules
- Correlation Rules
- Threat Scoring
Monitor the Analytics Engine
From the Threat Detection Management app on the New-Scale Security Operations Platform, you can monitor the status of the analytics engine.
When you log in to the app, the first tile that you see summarizes the analytics Engine Status.
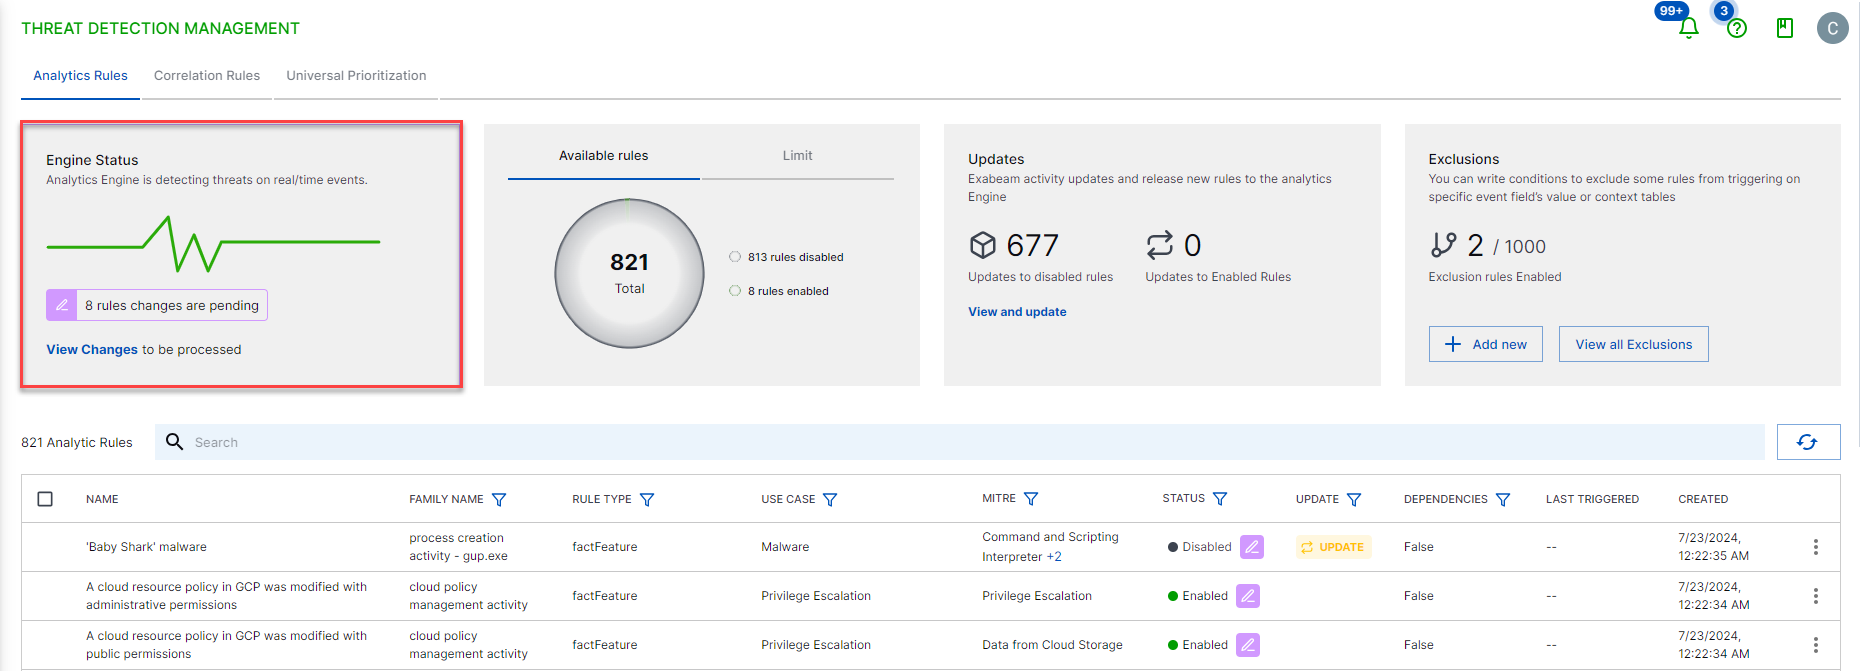
Depending on the state of your environment, the analytics engine displays one of the following statuses:
Status | Description |
|---|---|
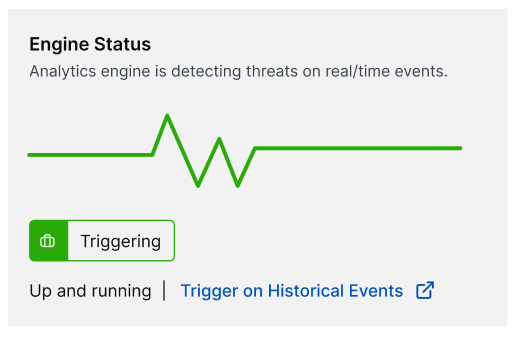 | Triggering The analytics engine is actively detecting threats based on real-time data. |
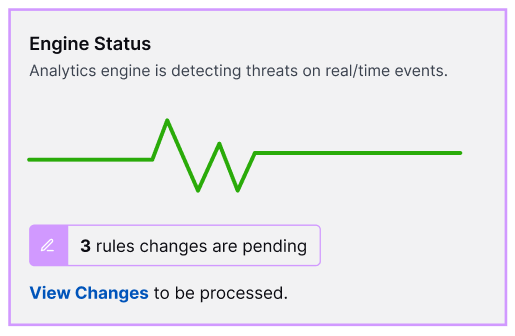 | Pending changes The analytics engine is actively detecting threats based on real-time data but has pending rule changes. Review and apply the rules as needed to get the latest in threat detection logic. |
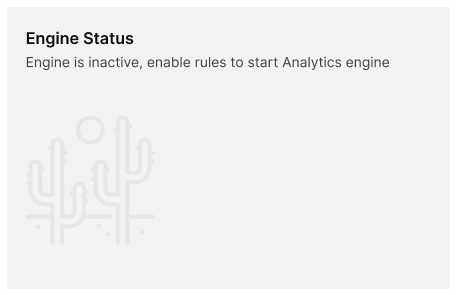 | Inactive The analytics engine does not have any active rules by which it can raise alerts. Enable one or more rules to begin threat detection activity. |
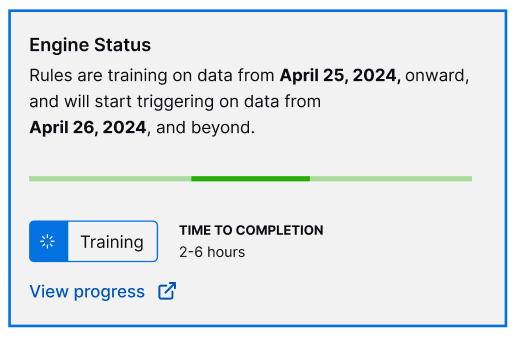 | Training The analytics engine is currently assessing historical data to establish baselines. If desired, view progress to monitor the training status. |
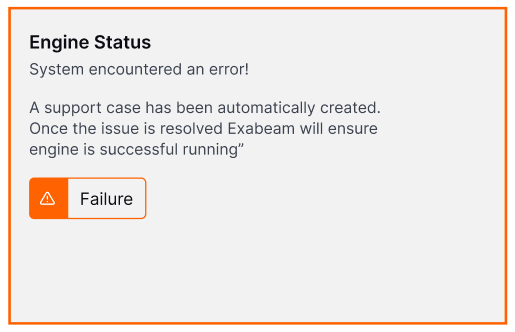 | Failure The analytics engine has encountered an error and is not currently operational. The error was reported to Exabeam Support for immediate investigation. After the issue is resolved, the analytics engine will reprocess and apply threat detection rules to historical data. |