- About Exabeam Data Lake
- Data Lake Search
- Visualize Results in Exabeam Data Lake
- Exabeam Data Lake Dashboard Setup
- Exabeam Data Lake Reports
- Export Limits for Large Volume Exabeam Data Lake Query Results
- Access Restrictions for Saved Objects in Exabeam Data Lake
- How to Forward Alerts Using Correlation Rules in Exabeam Data Lake
- How Correlation Rules Work
- Correlation Rules in Data Lake vs Advanced Detection Rules in Advanced Analytics
- Auto Disable Correlation Rules during High Latency
- How to Find Disabled or Erred Correlation Rules
- Rule Types in Exabeam Data Lake
- Create a Correlation Rule in Exabeam Data Lake
- Correlation Rules Table in Exabeam Data Lake
- Blacklist/Whitelist Correlation Rules using Context Tables in Exabeam Data Lake
- A. Technical Support Information
- B. Supported Browsers
Exabeam Data Lake Dashboard Setup
The Data Lake Dashboard page is where you can create, modify, and view your own custom dashboards. Essentially, they are a place to consolidate visualizations and saved searches. With a dashboard, you can combine multiple visualizations onto a single page, then filter them by providing a search query or by selecting filters by clicking elements in the visualization. You can easily use one visualization on multiple dashboards and if you edit the visualization is will be updated automatically on every dashboard you use. Unsaved reports will be impacted by changes in searches and visualizations.
Dashboards are useful for when you want to get an overview of your logs and make correlations among various visualizations and events. They can be shared among your colleagues and used in reporting. Each chart will refresh itself with the most recent data, making them useful for performing recurrent tasks.
To create a Dashboard:
Click the Dashboard icon
 on the left toolbar.
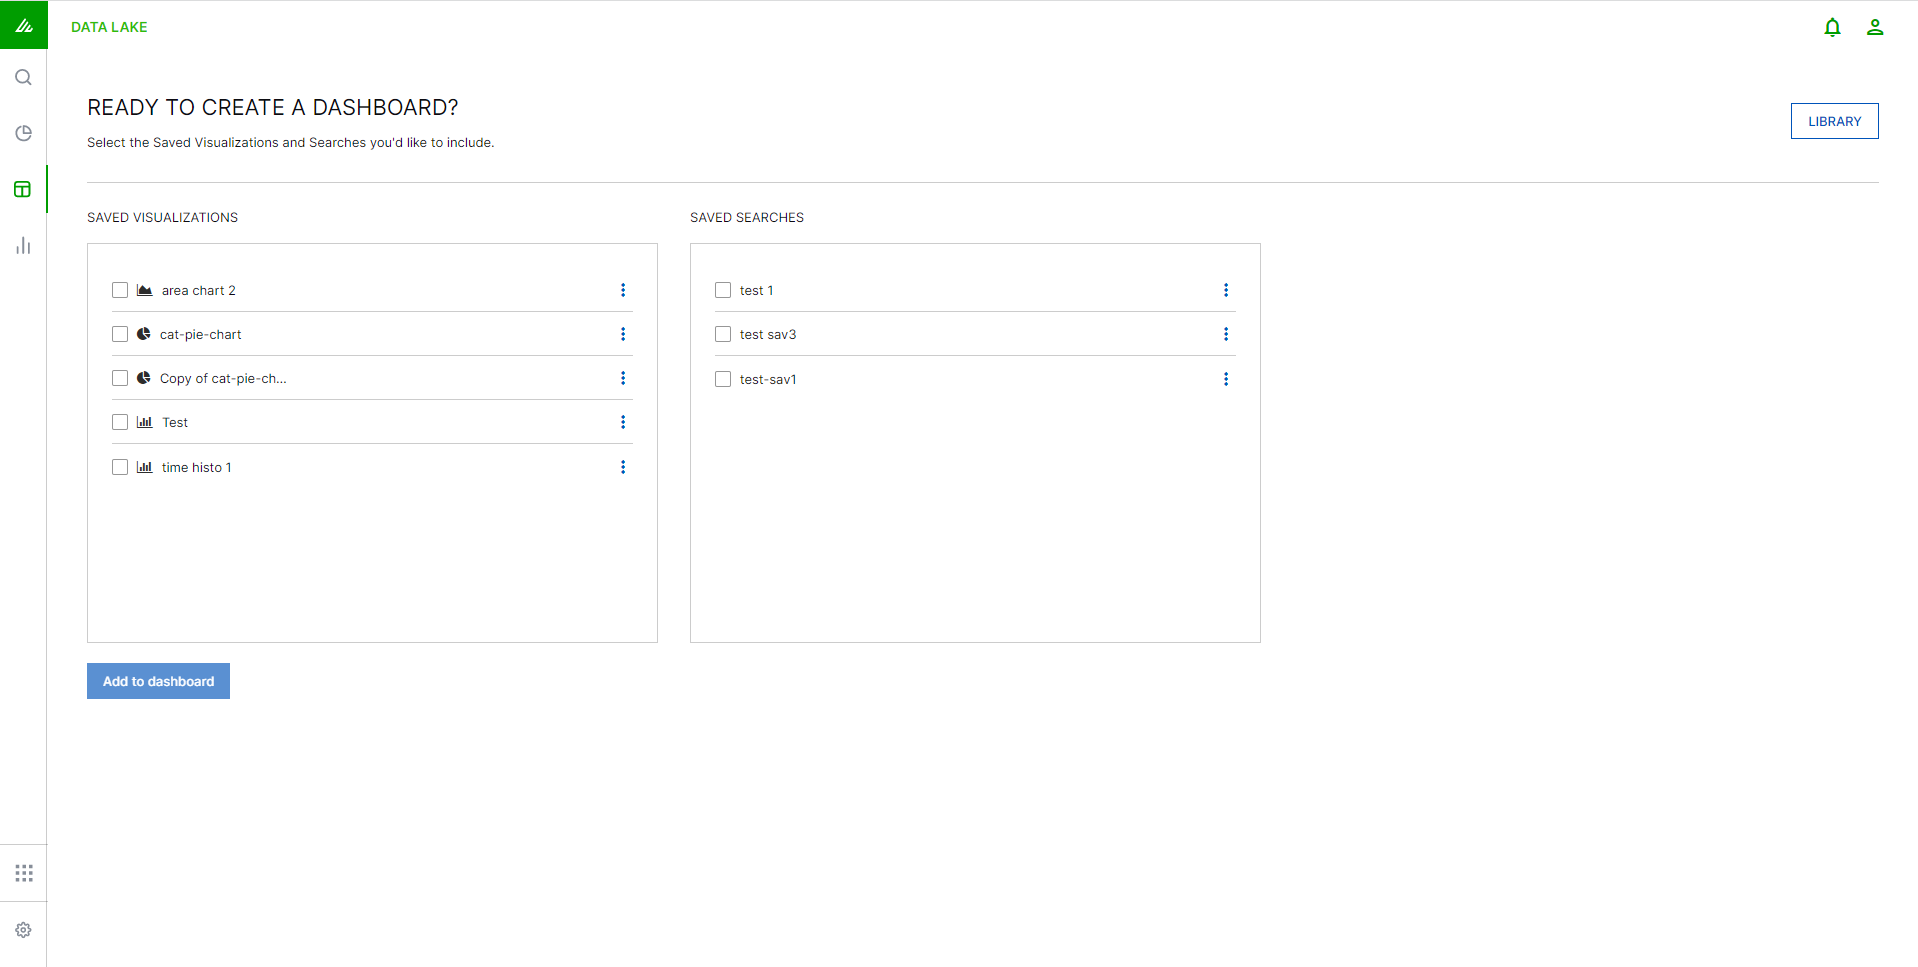
Check the box next to any of your saved visualizations and searches to add them to your dashboard.
Note
Having at least one saved search or visualization is a prerequisite for building a Dashboard.
Click Add to Dashboard.
The visualizations and searches you have selected will be added as separate tiles to your Dashboard.
Arrange Dashboard tiles to your satisfaction. Resize the tile by hovering the mouse over any of the tile's corners and dragging.
Hover your mouse over a tile to access an edit menu.
Click the Edit pencil to edit your saved visualization or search.
Use the Move icon to drag the tile to the desired location.
Click the Delete icon to remove the tile from this particular Dashboard.
Dashboards can be filtered further by entering a search query, changing the time filter, or clicking on the elements within the visualization. As with all the other pages, you can use the query language to enter queries in the top search box. This query will filter the data for all of the visualizations placed on the dashboard. If you have stored a query with a visualization, both queries will apply. This means you can use the dashboard search to filter out data, without compromising any logic inside the visualization.
You can also select particular elements within the visualization themselves. For example, if you click on a particular color segment in the histogram, Data Lake will allow you to filter on the significant term that the segment represents. Filters can be applied and removed as needed. The search and time filters work just like they do in the Search page, except they are only applied to the data subsets that are presented in the dashboard. Changing the time interval will apply to every visualization on the dashboard.
Once you are satisfied with your dashboard, save it:
Click Save on the toolbar.
If you are updating an existing dashboard, a drop-down menu appears. Select Save to update the existing dashboard, or Save As to save the dashboard under a new name instead of overwriting the existing version.
Give the dashboard a name and description.
Click Save to library.
As with visualizations and searches, anytime you make changes to the dashboard, you need to save again to store these changes permanently.
To store the time period specified in the time filter with the dashboard, select Store time with dashboard.
All Dashboards are saved in your Search Library and can be accessed from anywhere in Data Lake.
You can save the dashboard results to a file by selecting PDF in the  menu. Export limits will apply to large volume search results. For more information on export format, see Export Limits for Large Volume Exabeam Data Lake Query Results .
To share your dashboard:
Click Share.
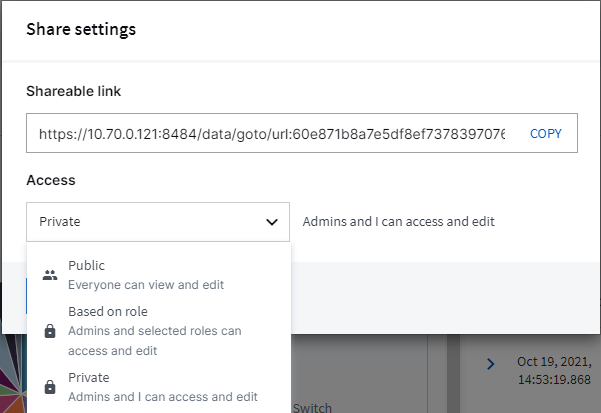
The Shareable link contains a link to your saved Dashboard.
Note
If you simply copy out the link and share this, your users won't have the option to modify the dashboard. This is not a security feature, since a user can just remove the embed from the URL, but it might be useful so people don't modify the dashboards by accident.
Select the access you want to grant.
Click Save.