- About Exabeam Data Lake
- Data Lake Search
- Visualize Results in Exabeam Data Lake
- Exabeam Data Lake Dashboard Setup
- Exabeam Data Lake Reports
- Export Limits for Large Volume Exabeam Data Lake Query Results
- Access Restrictions for Saved Objects in Exabeam Data Lake
- How to Forward Alerts Using Correlation Rules in Exabeam Data Lake
- How Correlation Rules Work
- Correlation Rules in Data Lake vs Advanced Detection Rules in Advanced Analytics
- Auto Disable Correlation Rules during High Latency
- How to Find Disabled or Erred Correlation Rules
- Rule Types in Exabeam Data Lake
- Create a Correlation Rule in Exabeam Data Lake
- Correlation Rules Table in Exabeam Data Lake
- Blacklist/Whitelist Correlation Rules using Context Tables in Exabeam Data Lake
- A. Technical Support Information
- B. Supported Browsers
Data Lake Search
One of the primary activities of a SOC is to find specific events in your log repository. For example, searching for the activities of a specific user in a given timeframe. Searching is the beginning of any investigation. It is where you access all your logs and filter through them, looking for events that match your criteria. Regardless of if you are building a visualization or a chart, you begin from a search.
You can interactively explore your data from the Search page. You have access to every event that matches the search query within the selected date and time range. You can submit search queries, filter the search results, and view event data. You can also see the number of events that match the search query and get field value statistics. The distribution of events over time is displayed in a histogram at the top of the page.
Exabeam Data Lake Search Page Overview
This section identifies the different sections of the Search page and provides a brief overview of their functions.

Query in Data Lake
At the top of the page is a search bar where you can enter a simple text search or use the Lucene query syntax to search your data. The total number of matching events are shown above the toolbar. To the right is a drop-down time filter that you can use to filter logs based on various relative and absolute time ranges.

Next to the time filter is a SAVE button that allows you to save searches - this function saves both the query string and the currently selected index pattern.
Clicking on LIBRARY opens a drop-down box that contains all of your saved searches, visualizations, and dashboards. Clicking on a saved search will populate the Search Bar with the saved query and launch the search.
For searches that have run a long period without timing out (for example, a search on a small data set that does not complete within 5 minutes) or you have initiated in error, you can halt the query by clicking the cancel icon that appears when the search starts:

If your query string extends beyond the length of the search bar, the text will wrap to the next row. To view the whole expanded query, click ... located in the lower right corner of the search bar. Click elsewhere outside the search bar to collapse the expanded view.

To initiate a query with hot-keys, use Control-Enter.
Note
In a cluster deployment, shards that are not available (such as replicate shards) do not block searches on the remainder of the cluster. Partial results will be returned.
Events Table from Exabeam Data Lake Search Results
When you submit a search request, the Timeline, Events Table, and Fields update to reflect the search results. The most recent events that match the query are listed in the Events Table. You can use this to look at individual log messages and display log data filter by fields. If no fields are selected, then the entire log is displayed.
Every event returned in the search results list consists of four sections. Here is an example of an Enhanced view of a log:
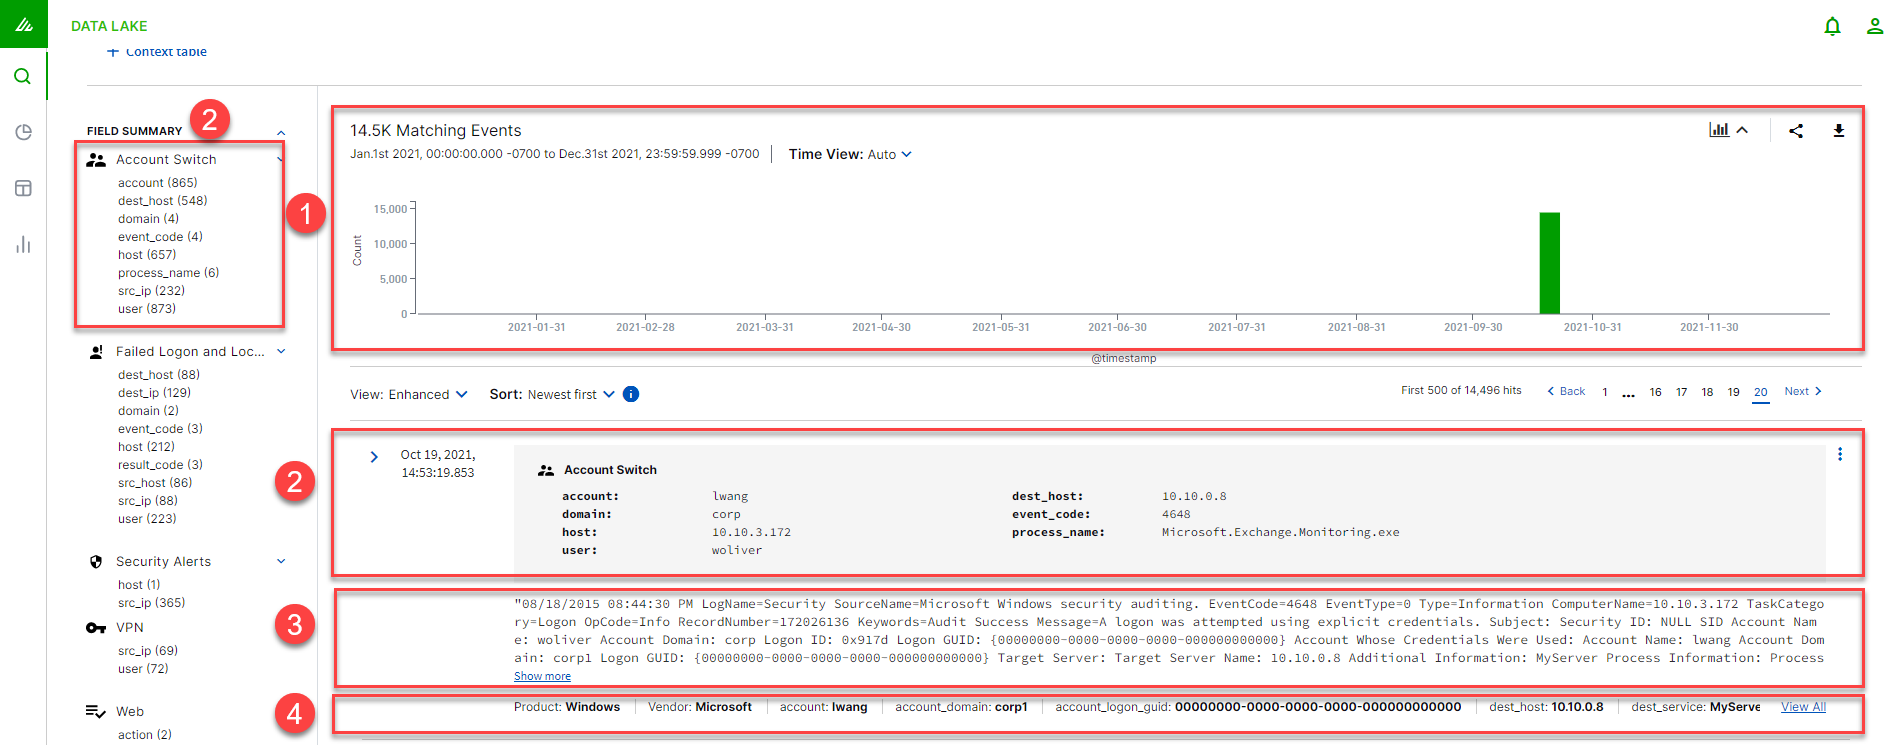 |
1 A date histogram bar graph that shows the count of logs over time, matched by the search and time filters. Use the Time View drop-down menu to narrow the time filter:
Millisecond
Second
Minute
Hourly
Daily
Weekly
Monthly
Yearly
Note
If an event does not specify a timezone, the time is reported in UTC.
2 Highlighted fields that are considered of most value for the given category. For example, field categories in the Fields Summary for the Account Switch category are shown with respective log counts from parsed logs. The categories will appear only if event logs produced positive matches during parsing.
3 Raw log view. This shows the log in the way it was received by Data Lake.
Note
Different browsers may display spaces in the data differently. Some browsers might add spaces to achieve better alignment, or the copy function via text selection may interpret the distance between words differently. For example, while there may be two spaces between data in the raw log, your browser might show just one when looking at the raw view, or show two when there is only one. If you need to view the data exactly as it is in the log, use the Copy Raw Log feature.
4 Listing of all parsed and metadata fields for the log.
The Table view allows you to create your own table with fields of your choosing, to be arranged as you see fit.

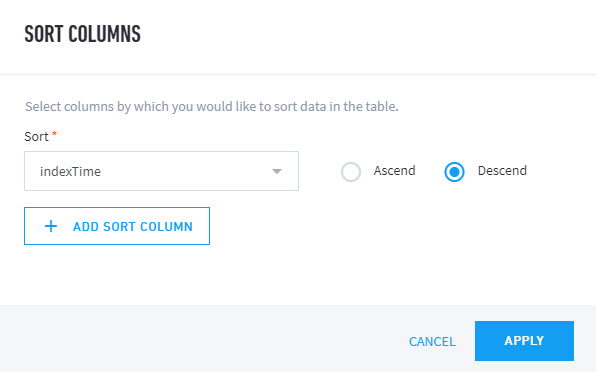
While viewing in Table view, sort the results according to a single column or multiple columns by clicking SORT COLUMNS or by clicking the arrow next to any column name.

Use the SORT COLUMNS menu to select the columns by which you want to sort data in the table. You can configure each column to sort by ascending or descending order. Additionally, you can sort search result tables on the Search page and data tables on the Visualizations by multiple columns.
 |
Use the Share button to create a shortened URL which links directly to the current search results table. Click COPY to copy and share the snapshot link with members of your organization who have access to the Data Lake UI.

Use the Export button to save your search results as a PDF or a CSV file. Export limits will apply to large volume search results. For more information on export format, see Export Limits for Large Volume Exabeam Data Lake Query Results .

For each log event, select the More Options icon ( ) to open the submenu for export options:
Copy Raw Log – Cache the raw log text to your local buffer.
Copy Link – Cache a shareable link to you local buffer.
Open in New Tab – Present the parsed fields and raw log in a new tab in your web browser.
 |
Timeline View from Exabeam Data Lake Search Results
The Timeline View is a date histogram bar graph that shows the count of logs over time, matched by the search and time filters. You can click on the bars to narrow the time filter.
 |
To set a Time Filter from the histogram, do one of the following:
Click the bar that represents the time interval you want to zoom in on.
Click and drag to view a specific timespan. You must start the selection with the cursor over the background of the chart—the cursor changes to a plus sign when you hover over a valid start point.
Note
If an event does not specify a timezone, the time is reported in UTC.
The histogram lists the time range you’re currently exploring, as well as the interval range that is being used. To change the intervals, click the link and select an interval from the drop-down. The default behavior automatically sets an interval based on the time range.

You can narrow your search further using the Time Picker tool. See Selecting a Timeframe.
You can collapse or display the Timeline by clicking the Open/Close icon.
 |
Selecting a Timeframe in Exabeam Data Lake Search Results
The time filter restricts the search results to a specific time period. You can set a time filter if your index contains time-based events and a time-field is configured for the selected index pattern. By default, the time filter is set to the last 15 minutes. You can use the Time Picker to change the time filter or select a specific time interval or time range in the timeline view at the top of the page.
For all time-based data, you can select the time span that you want to analyze in the current view at the top right of the window. There are multiple ways to get to the events you are interested in: either use the Quick tab to select a date range like Today or Last 1 hour or use the Relative and Absolute tabs to specify more specific time spans you want to look at.
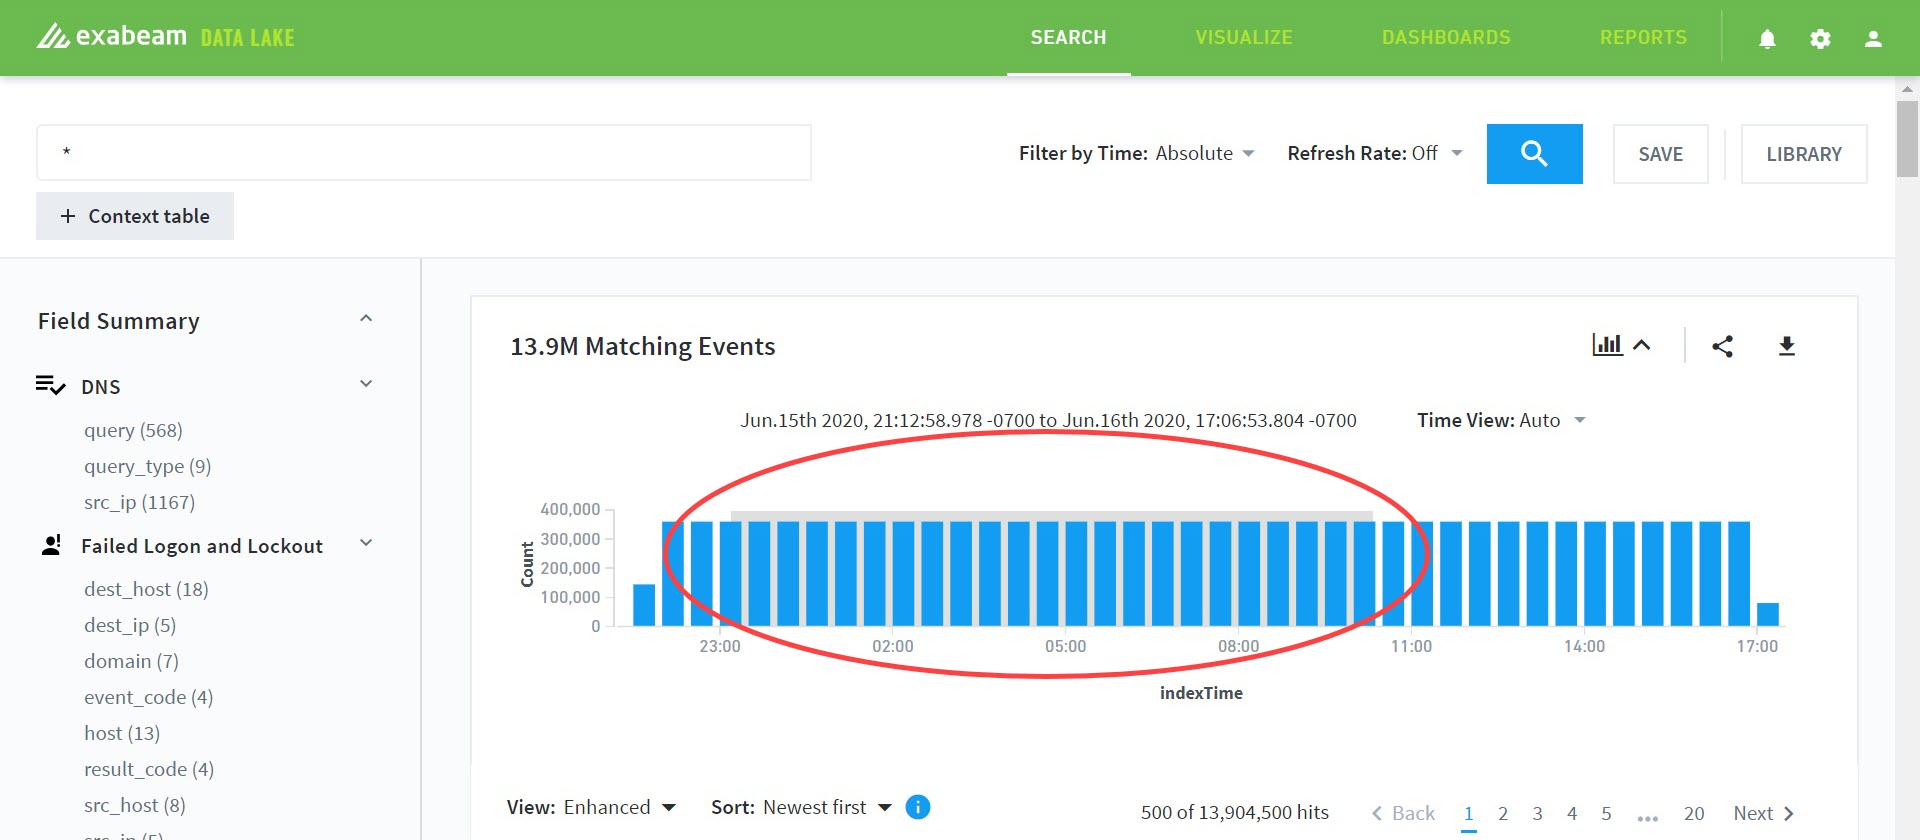
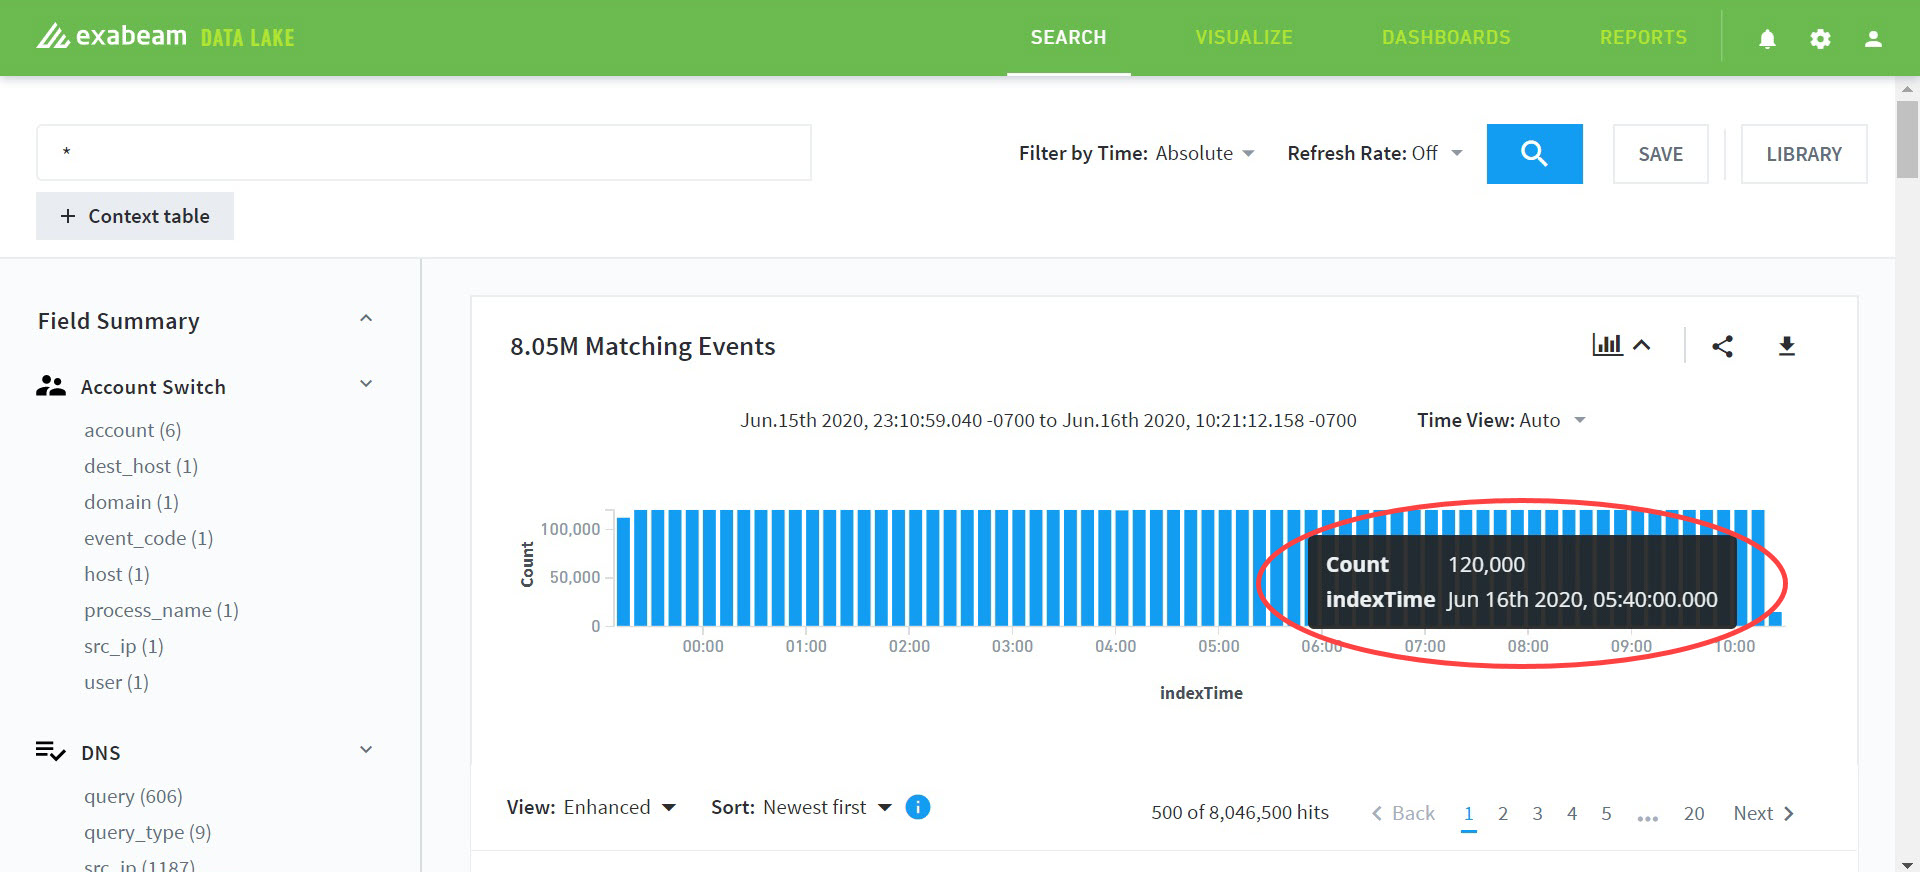
After you select a time range, you will see a timeline view at the top of the screen, which will show the distribution of events over time.
To use the Time Picker, either drag your mouse over a specific span of time.
 |
Or, you can select a bar on the timeline that represents the time interval you want to zoom in on.
 |
Exabeam Data Lake Search Fields
Data Lake displays a list of fields that found in the events of the search results, at the left of the UI. You can click the field to add a column containing the contents of this field to the table. No matter what fields you have added as columns, you can always expand a row on the caret in the front. You can also remove fields that you don’t want to see as columns anymore in the section Selected Fields above the field list on the left.
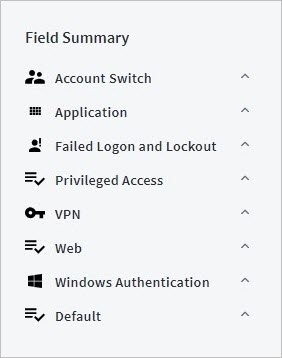 |
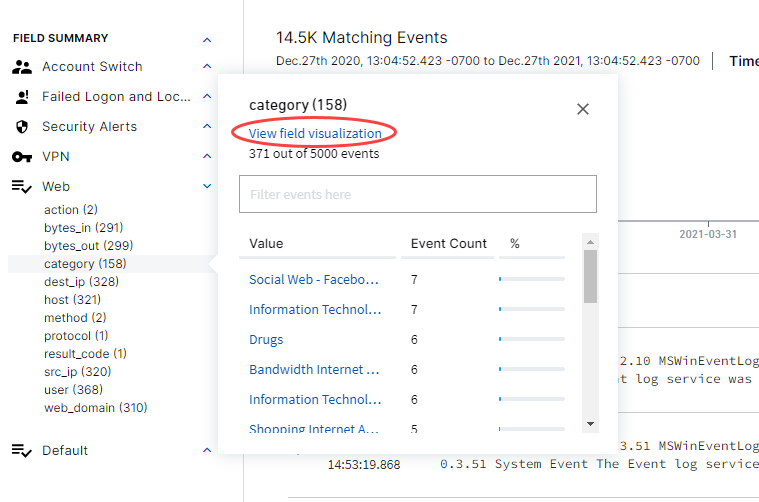
You can expand any field in the fields list on the left by clicking on it. It will reveal the list of the most common values for that field. Use the – and + magnifier icons to quickly add a filter to show only events containing that value (+) or to exclude all events with that value (-).
If you add filters that way, this field will be added as a search term within the query.
Filters can also be set by expanding the table rows on the right which show the event contents and using the filter buttons which appear there. Note that events may contain fields which are not indexed and can thus not be used for filtering. You won’t find any filter buttons for those.
Additionally, click the View field visualization link to create a new visualization from a single selected field. Once the new visualization is created, you can further customize the view by adding or removing top terms you want to review.
Please see the Visualize section for more information on creating, managing, and reviewing your visualizations.
Field Explorer
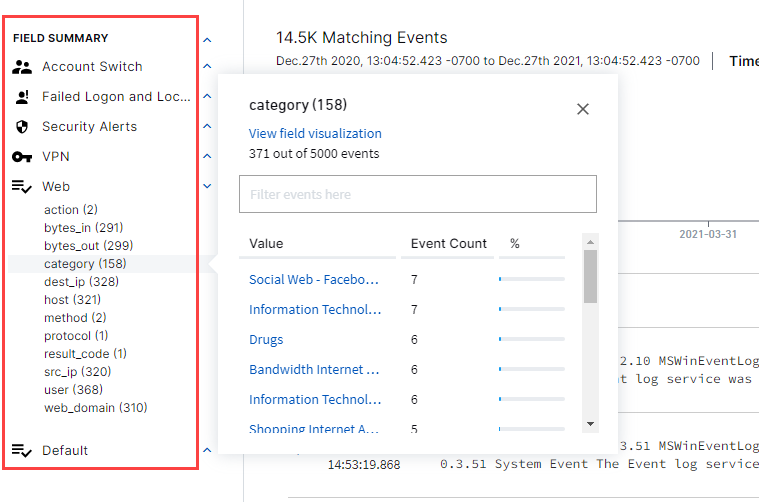
In addition to using manually created search strings, users have the option to filter data using out-of-the-box filters available in the Search UI.
The Field Explorer is the quick pick tool for viewing captured data in known categories (both out-of-the-box and custom filters). Click on the hyperlink for a given sub-category and menu of known values are listed to filter further. View field visualization can be selected to immediately visually organize data from the shown list.
Filtered Searches in Data Lake
In addition to using time constraints to narrow data, you can filter with context tables. Filtered searches can be applied to searches, dashboards, visualizations, and reports.
Note
Keep in mind the following:
You can only search keyword fields (for example:
caller_user.keyword)Filtered searches work only with key-only context tables of no greater than 10k records
Only one context table can be applied per filtered search
Context table records must match the format of the field being queried
Exact value matches are applied
To apply a context table filter, below the Search field, click + Context table.

Select a Field, an is or is not condition, and an In a context table . You can select from the drop-down lists or start typing in the fields to display possible matches.
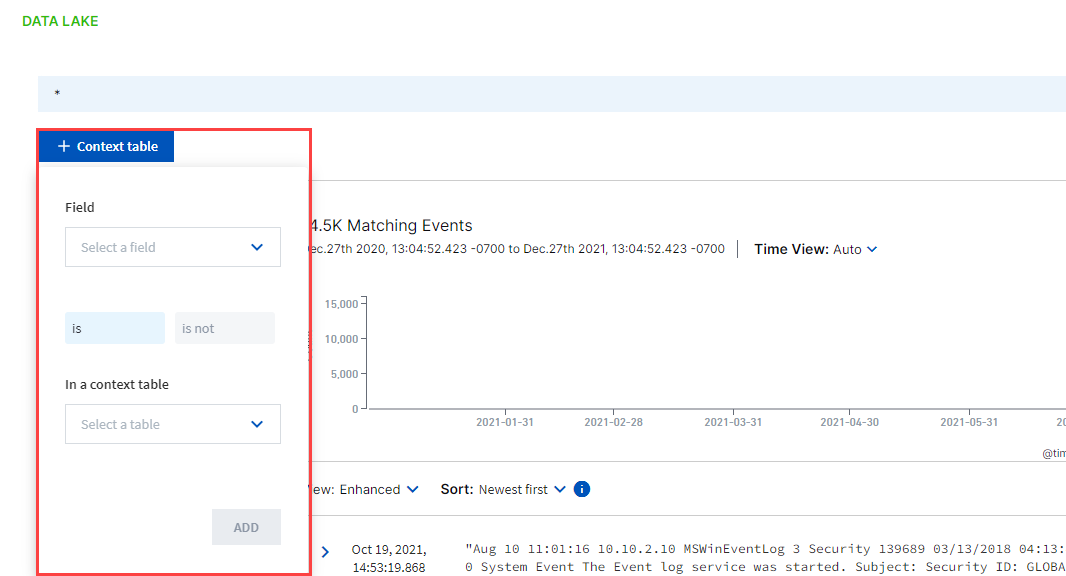
To apply the filter, click ADD . The filter appears below the Search field.

(Optional) To save the search to the library, click SAVE.
(Optional) To export the search results to a PDF or CSV, click Export.

You can click the filter to edit it. If the parameter has already been applied, a check mark appears next to the record. When you are done editing, click UPDATE.
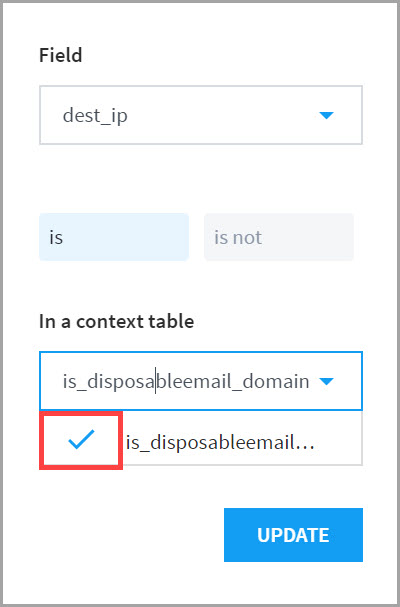 |
For data formats supported in filtered searches, please see the Exabeam Search Quick Reference Guide.
Performing Searches in Exabeam Data Lake
Data Lake is built on top of Elasticsearch, which uses the Lucene query language. For more detailed information on syntax and search options, see Data Lake Search Quick Reference Guide.
Note
In a cluster deployment, shards that are not available (such as when a node goes down) do not block searches on the remainder of the cluster. Partial results will be returned.
Types of Exabeam Data Lake Queries
Data Lake accepts searches in the Lucene query language. This section covers some of the basic operators for conducting searches.
Note
The period . character is not included in searches. For example, command_line : ".ck" will only search on "CK" and not on ".CK".
Text Searches
A query is broken up into terms and operators. There are two types of terms: Single Terms and Phrases.
A Single Term is a single word such as "test" or "hello".
A Phrase is a group of words surrounded by either straight single or straight double quotes such as "hello world". Be consistent with quote usage as a query with a single quote and a double quote will not return results.
Multiple terms can be combined with Boolean operators to form a more complex query.
Do not use string values with numeric characters
By default, the search box performs unstructured text searches. It searches for entries containing any of your search terms and a hyphen is considered a delimiter. This means that if no specific field is indicated in the search, the search will be done on all of the fields that are being analyzed. It will not tell you if your search has the wrong syntax.
Note
Text searches are case insensitive. This means that category and CaTeGory return the same results.
Field Level Searches
The query language allows you to search inside any field, simply enter the name of the field and then a colon.
Some examples:
To just search inside a field named “lang”
lang:en
To search for the language English or Spanish in the "lang" field
lang:(en OR es)
Like the selected fields, the entered query will be persisted if you save your search.
You can search a range within a field. If you use brackets [], this means that the results are inclusive. If you use {}, this means that the results are exclusive.
Using the _exists_ prefix for a field will search the events to see if the field exists.
You cannot use wildcards inside of phrases.
For information on queries, see Data Lake Search Quick Reference Guide.
Logical Statements
Logical statements enable you to use more than one condition in a query. You can use parentheses to define complex logical statements and be sure that you use the proper format such as capital letters to define logical terms like AND or OR.
In some cases, you might want to compare the results of two separate queries. Data Lake can handle multiple queries by joining them with a logical OR.
To search for the logon event 4768 and the user Barbara Salazar:
event_code:4768 AND user:bsalazar
Search Type | Operator(s) | Example |
|---|---|---|
Full Search | * | * |
Literal String | "" | "geo-address" |
Single Field | <Field name>: | country: |
Missing Field | missing: | missing:vpn |
Present Field | _exists_: | _exists_:vpn |
Wildcard | * for any number of characters ? for one character (Cannot be used in | * |
Negative Terms | !;-;NOT | -VPN !VPN NOT VPN |
Range Search | [number TO number] | user.listed_count:[0 TO 10] |
For more detailed information about running searches, see Exabeam Search Quick Reference Guide
Exabeam Data Lake Sort Logic
The following is the sorting order using in Data Lake. Note that leading spaces are given greater weight than all other character or number when records are sorted.
Ascending order is:
Blank spaces (' ').
Underscore ('_').
Numeric characters.
Lower case alphabetic character.
Upper case alphabetic character.
Field values longer than maximum char limit of 256).
Descending order is:
The reverse of the above.
The following is an example of ascending order:
david
David
_david
_David
1david
2david
3david
david
daVid
daVid
David
Exabeam Data Lake Event Categorization
Data Lake supports multiple categorization attributes for each log or event type defined in the product. Different vendors use different fields and terms in their logs.
Categorizing events provides a consistent taxonomy for queries, reports, visualization, dashboard, search, and correlation rules. Our out-of-the-box compliance reports leverage this nomenclature.
For example, a log has the following value:
exa_activity_type: authentication/local_logon
This log will also be returned in the query:
exa_activity_type=authentication
Current categories are:
exa_categoryexa_device_typeexa_activity_typeexa_outcome
Examples:
exa_activity_type = account-management/user/create
exa_device_type = operating-system/network/firewall
exa_outcome = success/allow
For a complete list of Exabeam event categories, see the "Searches using Exabeam exa_category" section in How to Run Query Searches in Exabeam Data Lake How to Run Query Searches in Exabeam Data Lake.
Saved Searches in Exabeam Data Lake
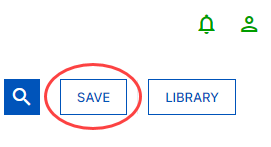
Saving searches enables you to reload query results quickly and use them as the basis for Visualizations, Dashboards, and Reports. A search can be saved into a library by clicking on the SAVE. You can access the search library at any time to get a list of all your saved searches. Selecting a saved search will populate the search box with the query and launch the search.
To Save the Current Search:
Click SAVE in the toolbar.
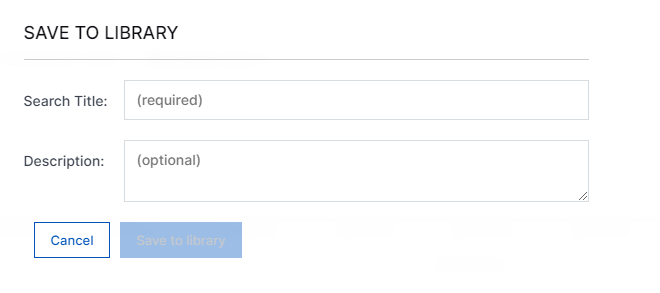
Enter a name and description for the search and click SAVE TO LIBRARY.
To Open a Saved Search:
Click LIBRARY in the toolbar.
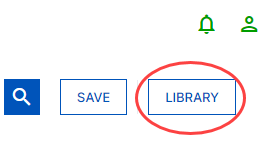
Select the search you want to open:

To Edit or Delete a Saved Search:
The search library contains a list of all saved searches.
To edit a saved search:
Click the vertical ellipsis to the right of the date field:

Select Edit or Delete from the drop-down menu.
Create an Exabeam Data Lake Report from New Search
Note
Reports based on searches that would return more than 10 billion records will result in an error.
If you selected CREATE NEW SEARCH when creating a new report, the Search landing page will be opened.
Input the search terms that you would like your Report to be based on. Data Lake accepts searches in the Lucene query language.
Your search will be run and the results displayed as a preview of what your Report would look like with those search terms.
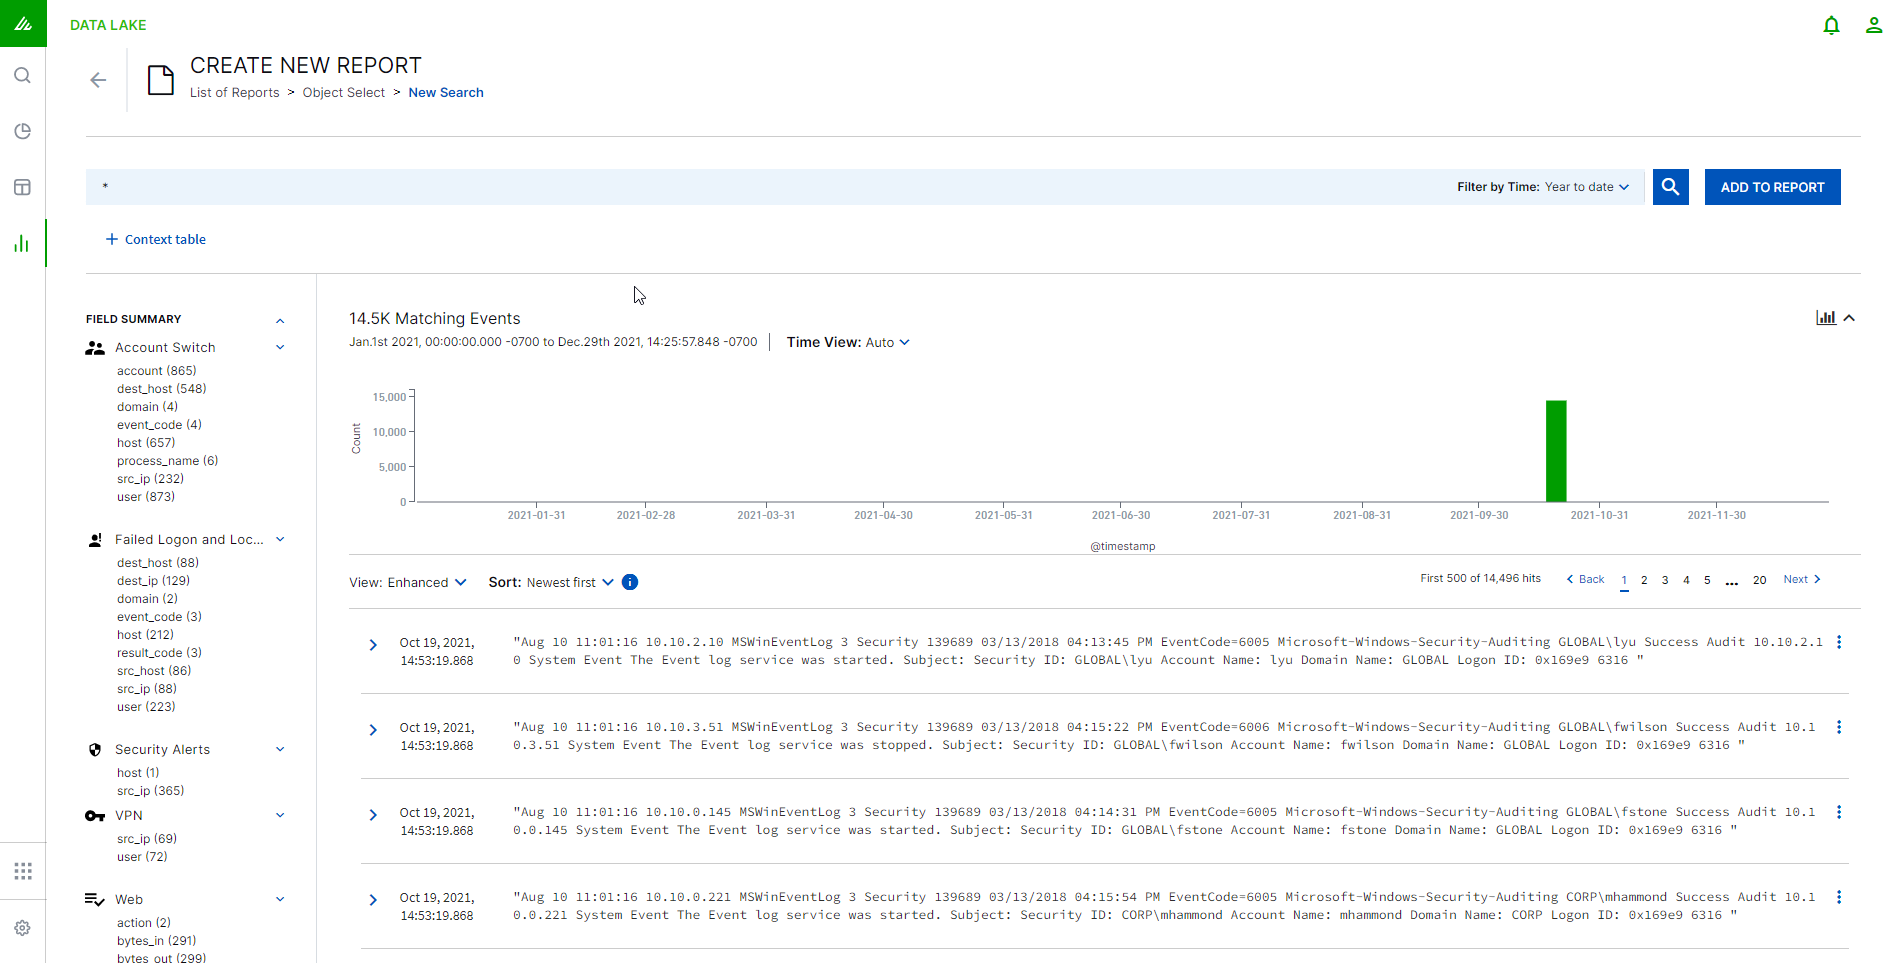
If you are satisfied with the Report preview, click ADD TO REPORT. If you are not satisfied, return to the previous screen and edit your search terms.
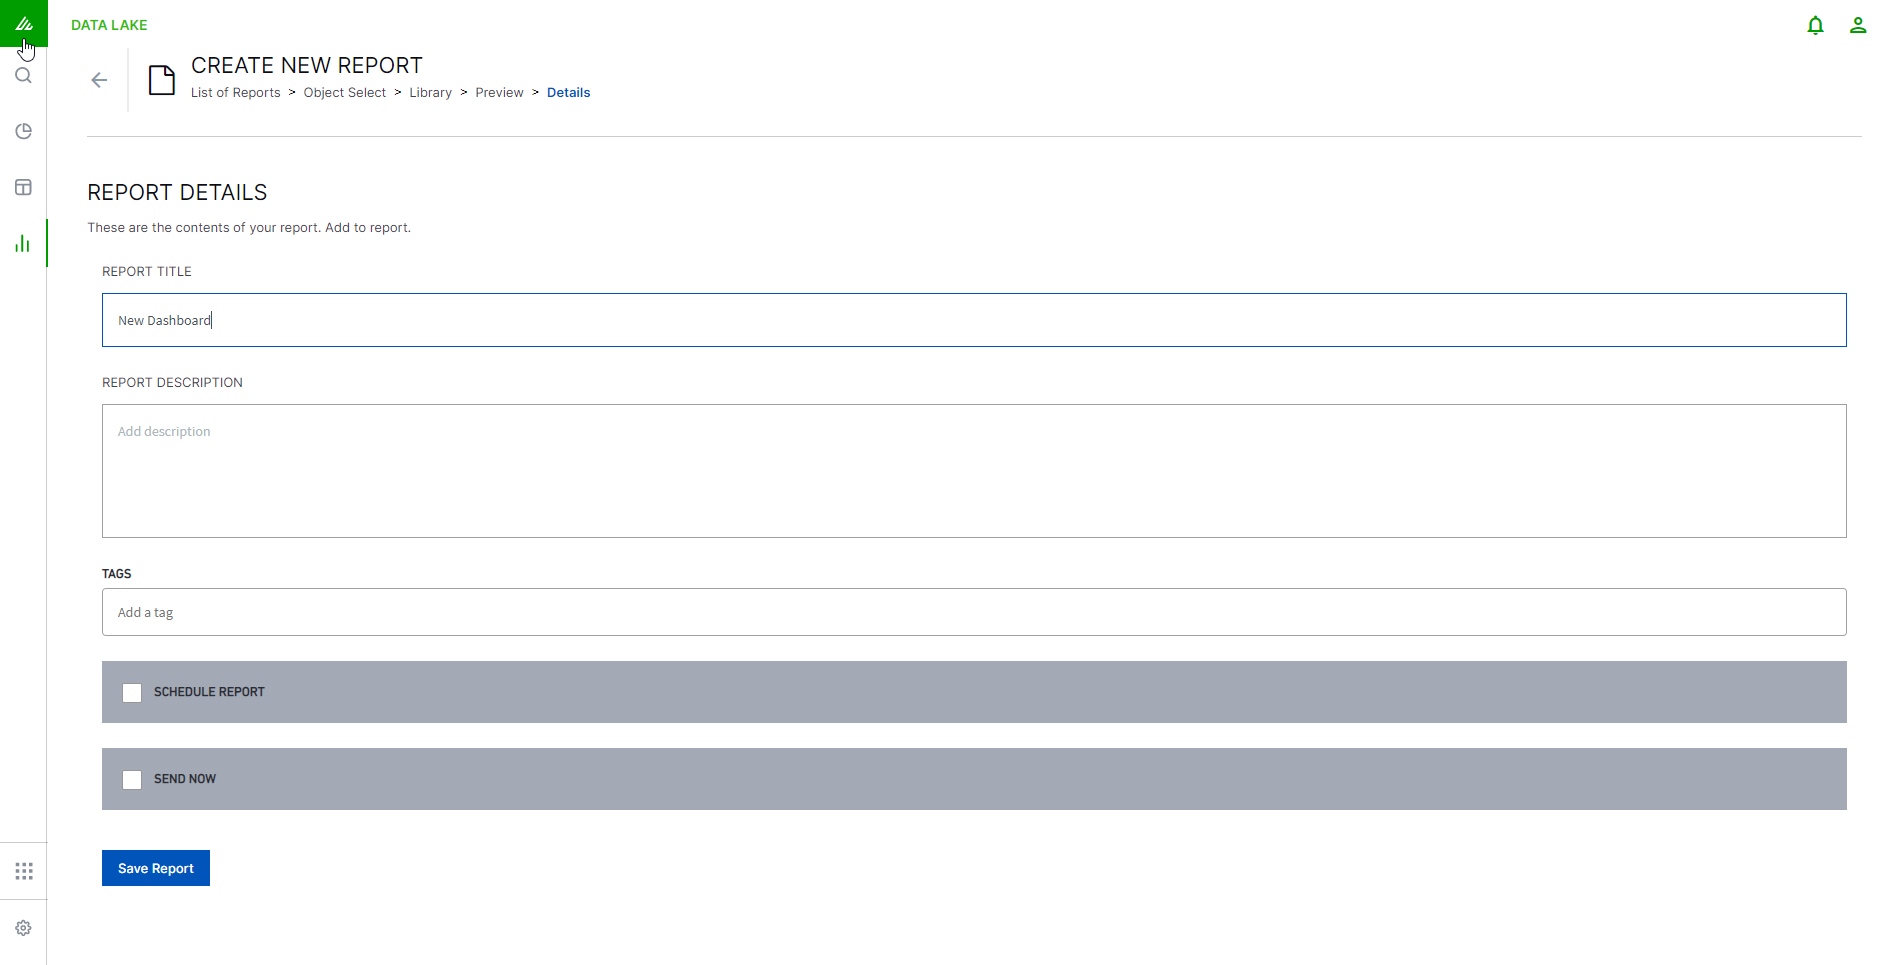
Give the report a title and description.
Note
Report names cannot contain special characters.
From this page you can:
Click in the Add a tag box to select from a predefined list of tags that you can add to your report.
Tick the SCHEDULE REPORT box to enter the frequency with which you would like the report sent, and all of the recipients who should receive it.

Note
Tick the Attach as CSV box to attach the report as a CSV file, and enter the number of records to export (up to 10000). This option will only be available when building a report from a search (either new or existing), and will not be available if building a report from a dashboard.
Tick the SEND NOW box which will run and send the report when you save.
Click Save Report.
How to Run a Data Lake Cross-Cluster Search
Ensure you have permission to run a cross-cluster search and that the clusters of interest are available. You must have at least one remote cluster configured. For more information on setting up a searchable remote cluster, see Data Lake Cross-Cluster Search.
If you have permission to conduct cross-cluster searches, there will be a Local Cluster menu above the search field.
 |
Select the clusters you want to apply the search to. Compose the query and its parameters as you would for typical searches, following prescribed syntaxes (see Type of Queries). To configure a remote cluster, see Data Lake Cross Cluster Searches.
Warning
Cross cluster search results export is limited to 10,000 events per search query. For local clusters, up to 1,000,000 events per search query can be exported in CSV format.
