- About Exabeam Data Lake
- Data Lake Search
- Visualize Results in Exabeam Data Lake
- Exabeam Data Lake Dashboard Setup
- Exabeam Data Lake Reports
- Export Limits for Large Volume Exabeam Data Lake Query Results
- Access Restrictions for Saved Objects in Exabeam Data Lake
- How to Forward Alerts Using Correlation Rules in Exabeam Data Lake
- How Correlation Rules Work
- Correlation Rules in Data Lake vs Advanced Detection Rules in Advanced Analytics
- Auto Disable Correlation Rules during High Latency
- How to Find Disabled or Erred Correlation Rules
- Rule Types in Exabeam Data Lake
- Create a Correlation Rule in Exabeam Data Lake
- Correlation Rules Table in Exabeam Data Lake
- Blacklist/Whitelist Correlation Rules using Context Tables in Exabeam Data Lake
- A. Technical Support Information
- B. Supported Browsers
Exabeam Data Lake Reports
Repetitive summaries and queries for known data of interest can be stored in reports.
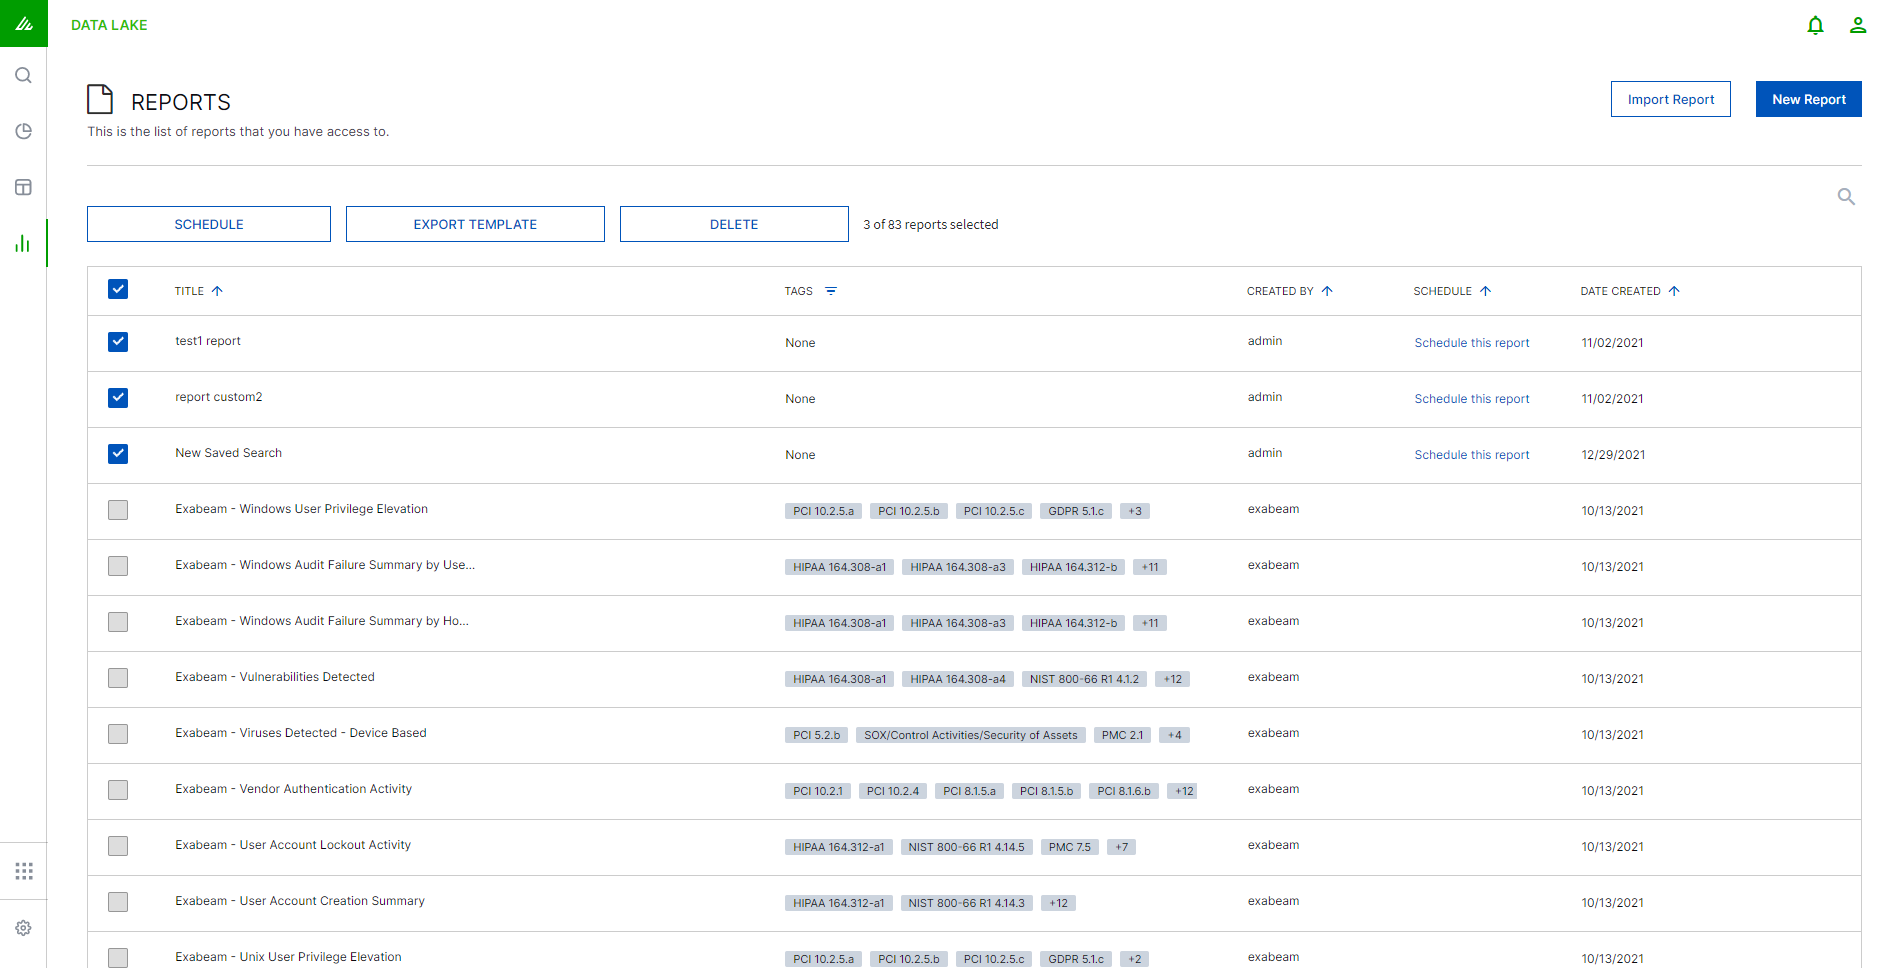
The Reports page lists all of the reports that you have access to; those that you created, as well as any reports shared with you.
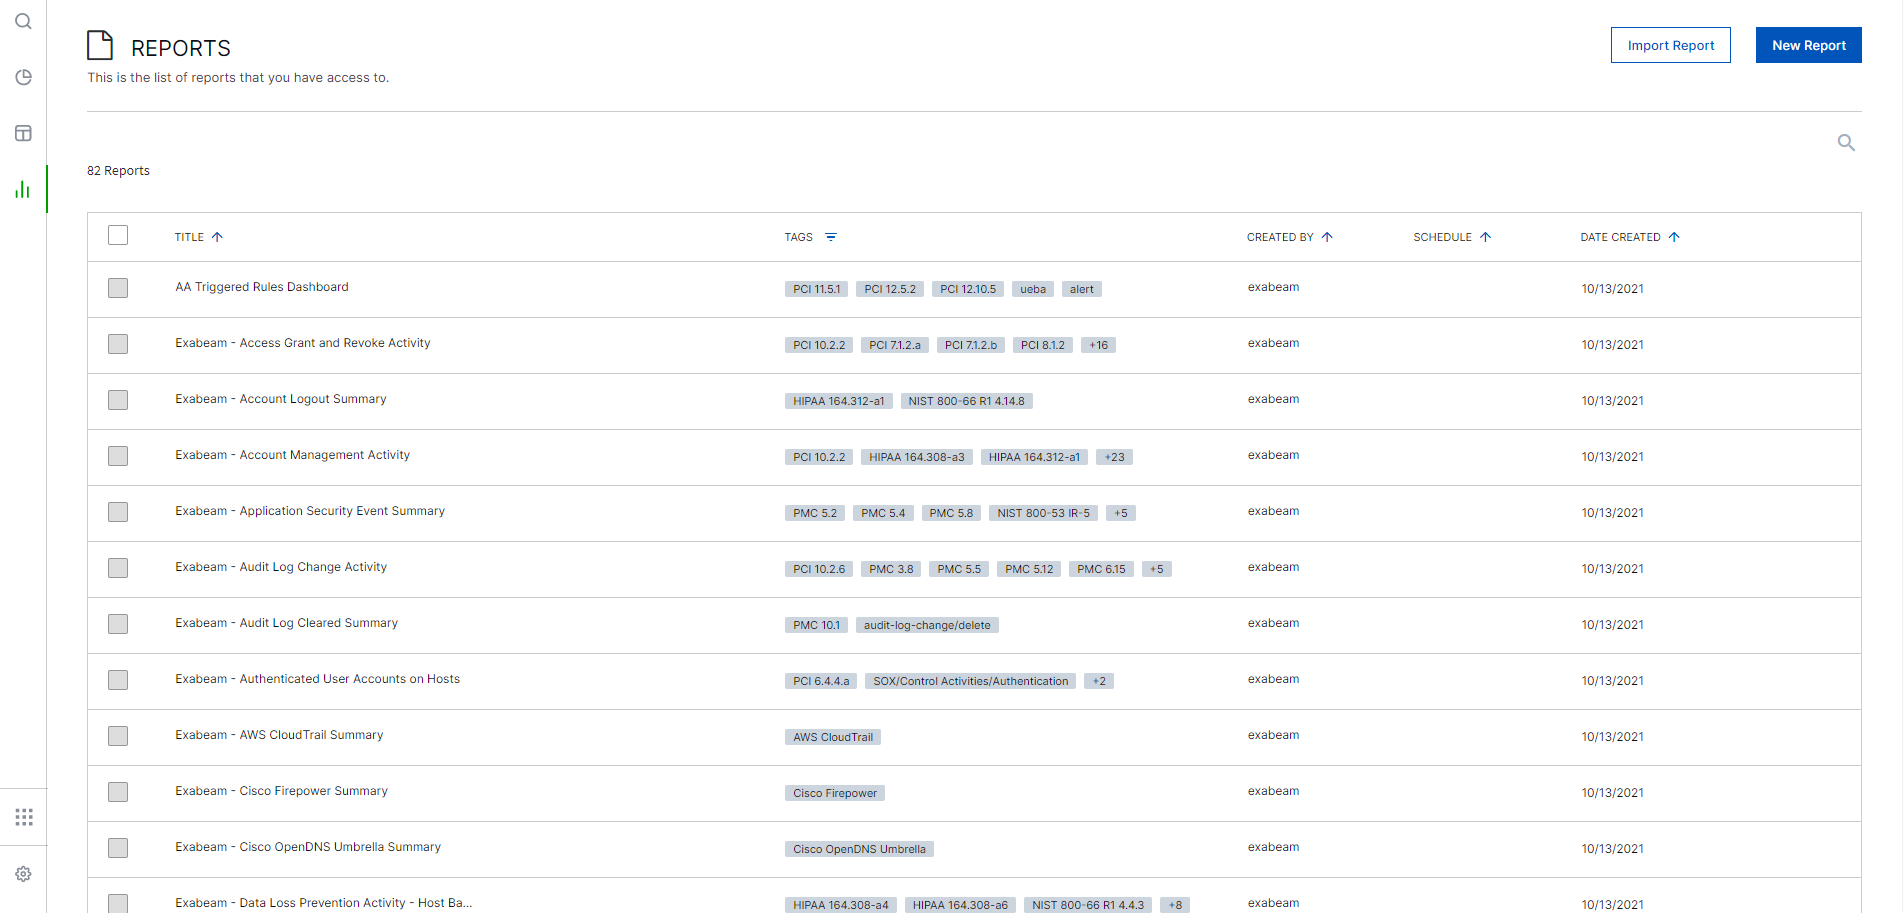
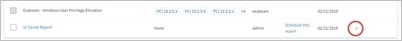
When you hover your mouse over an individual report, a vertical ellipsis appears. If you have edit access to the report, a pencil icon will also appear.

From here you can edit a report reports by selecting the pencil icon. Click the vertical ellipsis to Duplicate, Share Links, Send, Download, Export, or Delete a report.
In Data Lake, a report can be created from either the enhanced view of a search's results (the results of a search query), a table view (the results of a search query), or a dashboard (potentially multiple search results) or a brand new search.
Note
Reports cannot be created from visualizations alone. If you would like to create a report with only a visualization, save a dashboard that includes the visualization and create a report from the dashboard.
Reports have the following attributes:
Report Title
Report Description
Tags
Created By
Schedule
Data Created
Create an Exabeam Data Lake Report
Reports are generated from the data queried during its creation or from saved searches. When creating a report, you choose to create it from a previously saved search or dashboard, or from a brand new search.
A few notes about the time frame of reports:
If a report is created from an enhanced view search, table view search, or dashboard of a newly saved search, the time frame in the report will be the same as the time frame of the saved search or dashboard. Note that the time frame applies to all searches and visualizations within the dashboard.
Modification of the time frame must be performed in the Saved Search or Saved Dashboard.
To create a new report:
Click the REPORTS icon (
 ) on the left toolbar.
Click New Report.
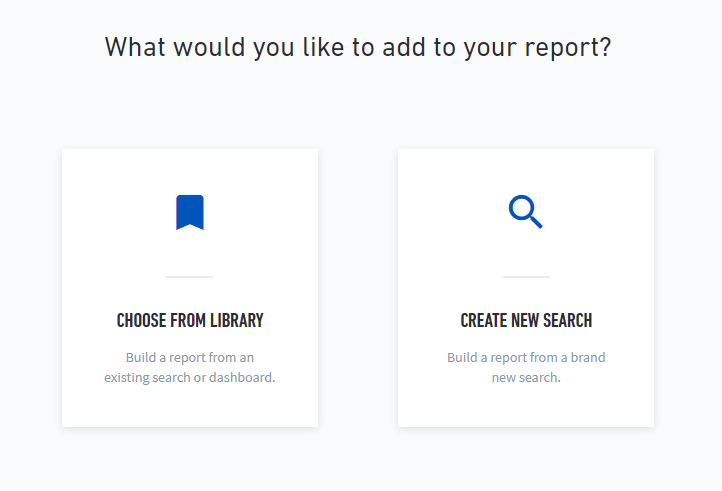
Choose whether to create a report from an existing search or dashboard, or from a brand new search.
Create an Exabeam Data Lake Report from a Saved Search/Dashboard
If you selected CHOOSE FROM LIBRARY when creating a new report, your library of saved searches and dashboards opens.
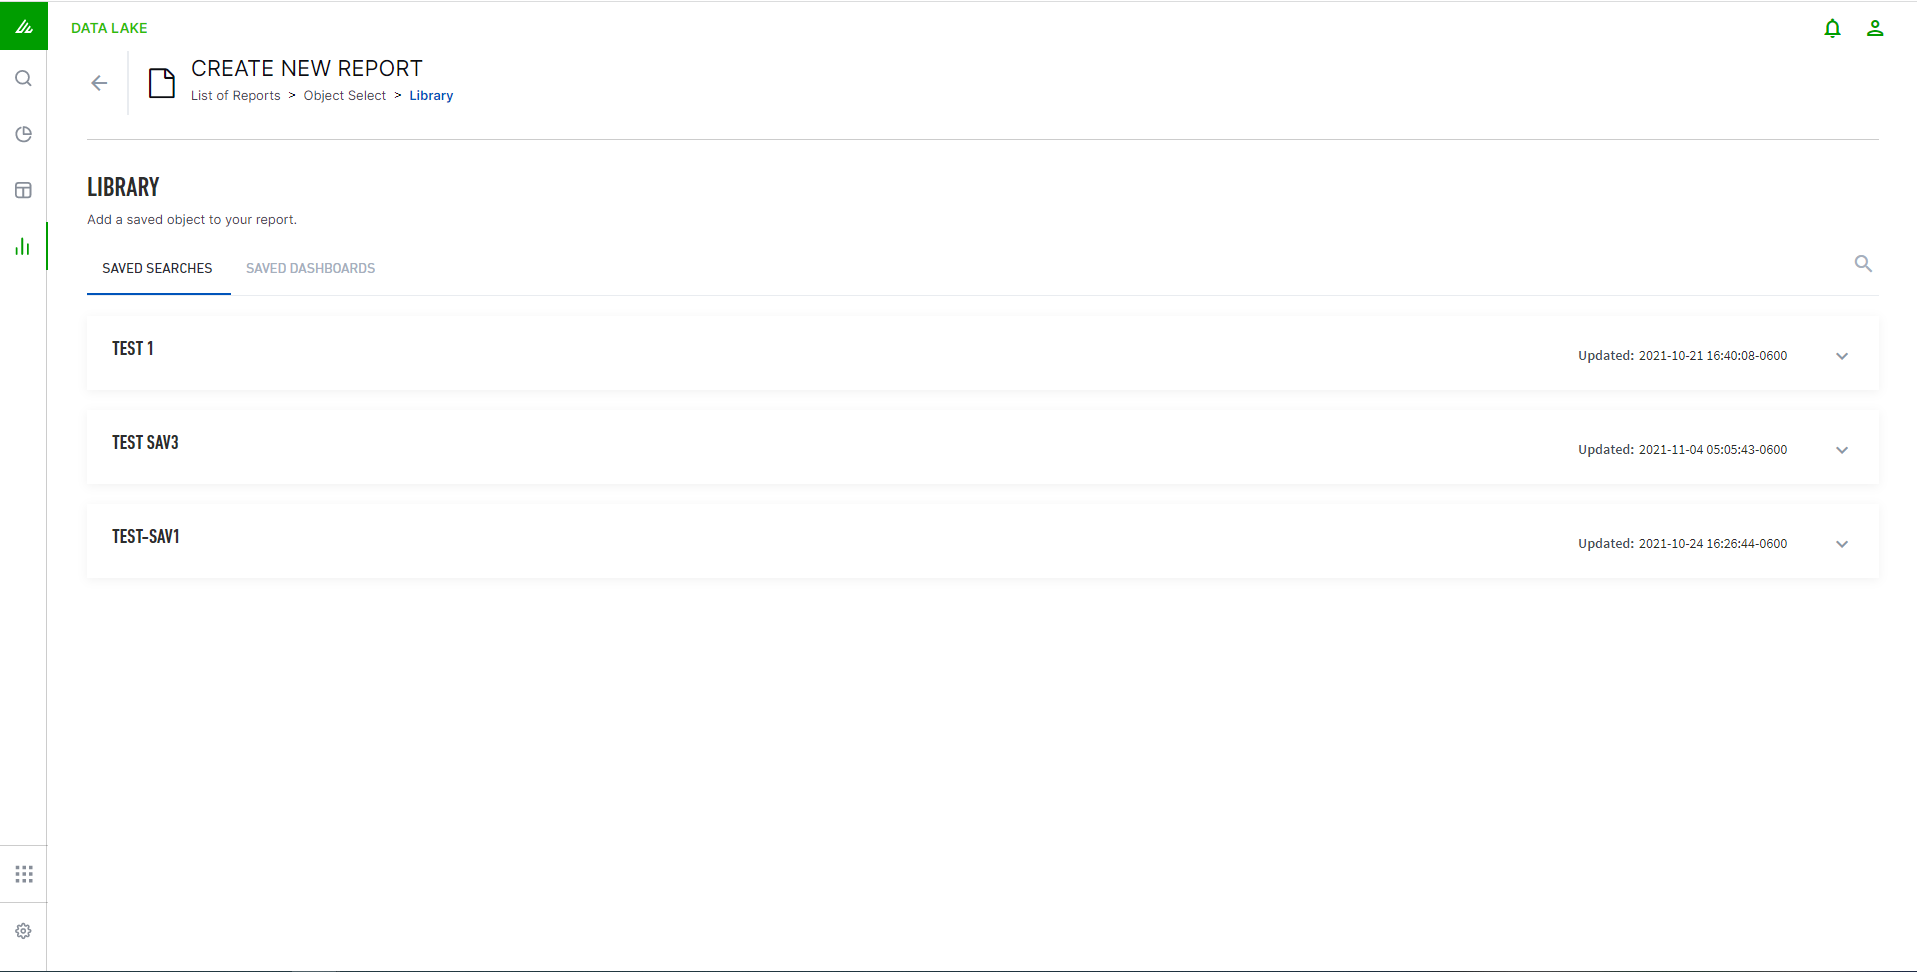
Select saved searches or dashboards you would like to use to create your report.
The drop-down menu provides more information about the dashboard or search and gives you the ability to preview your report.
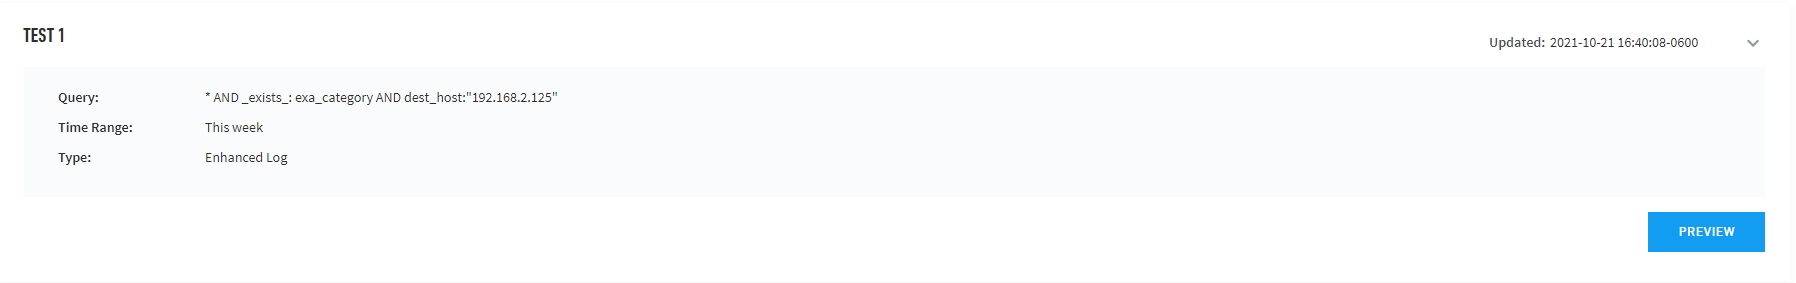
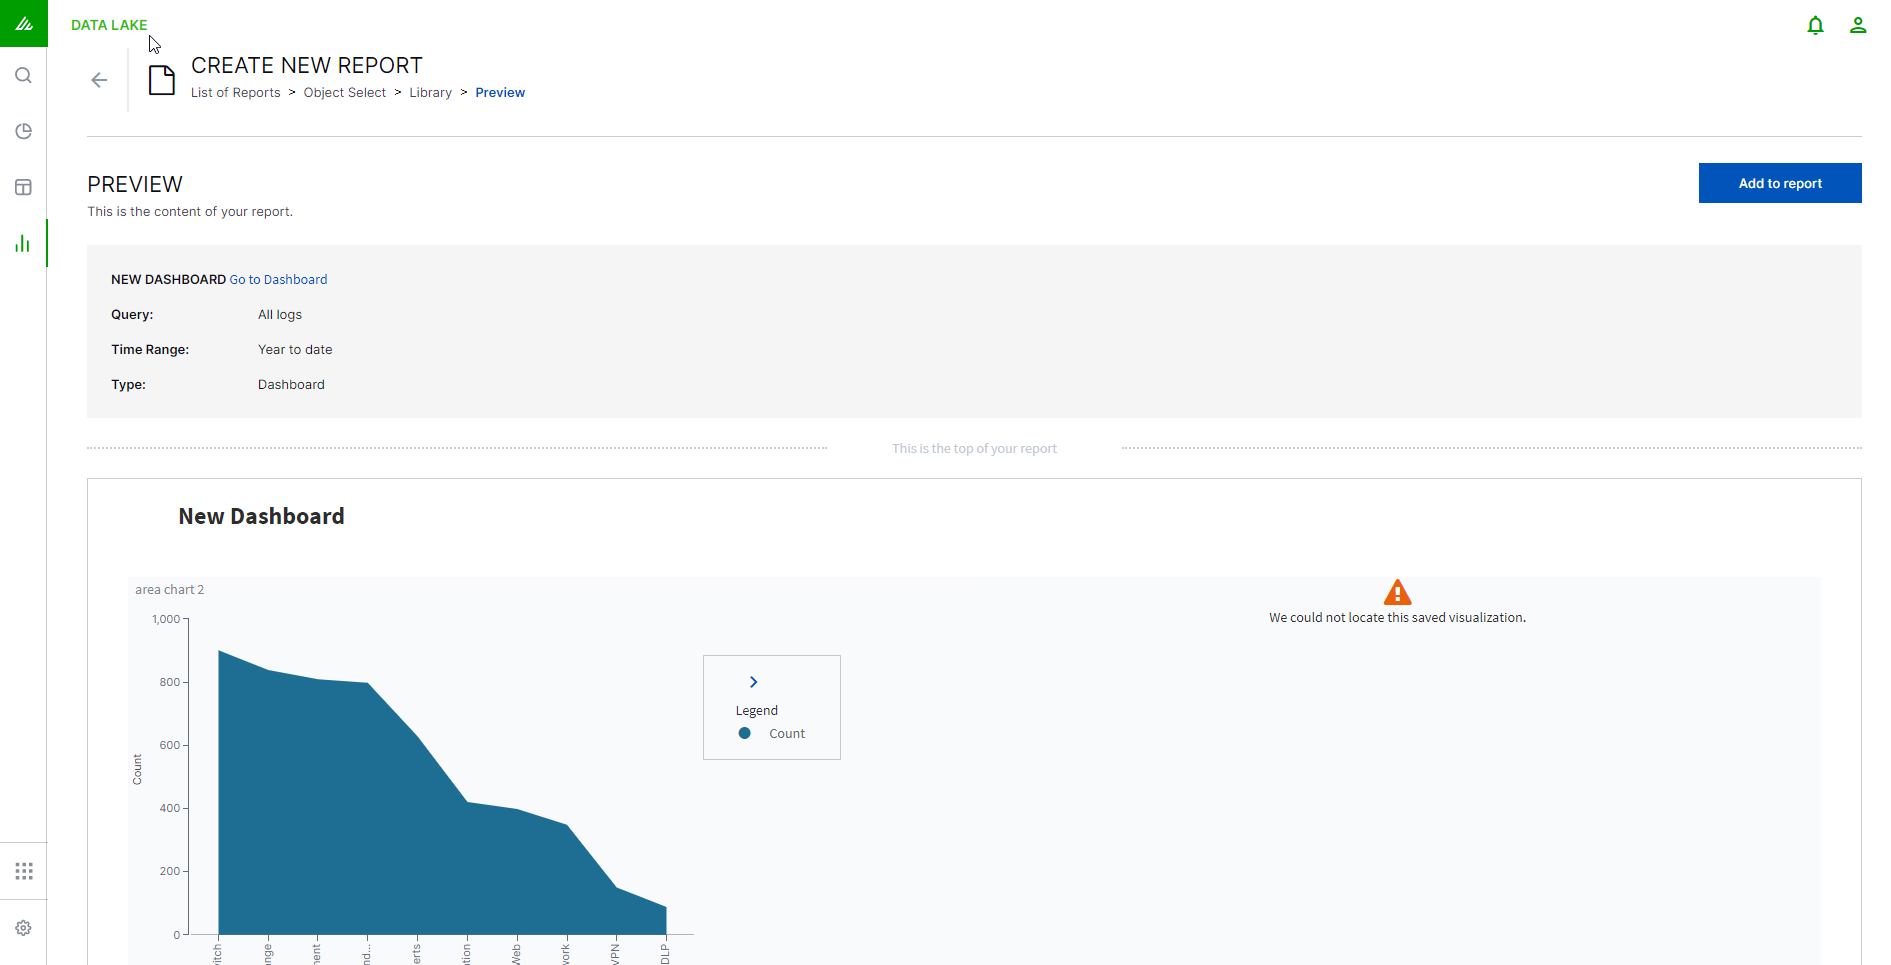
Click Preview.
A preview of your report appears.
Note
Reports based on searches that would return more than 10 billion records will result in an error.
If you are satisfied with the preview, click Add to Report.
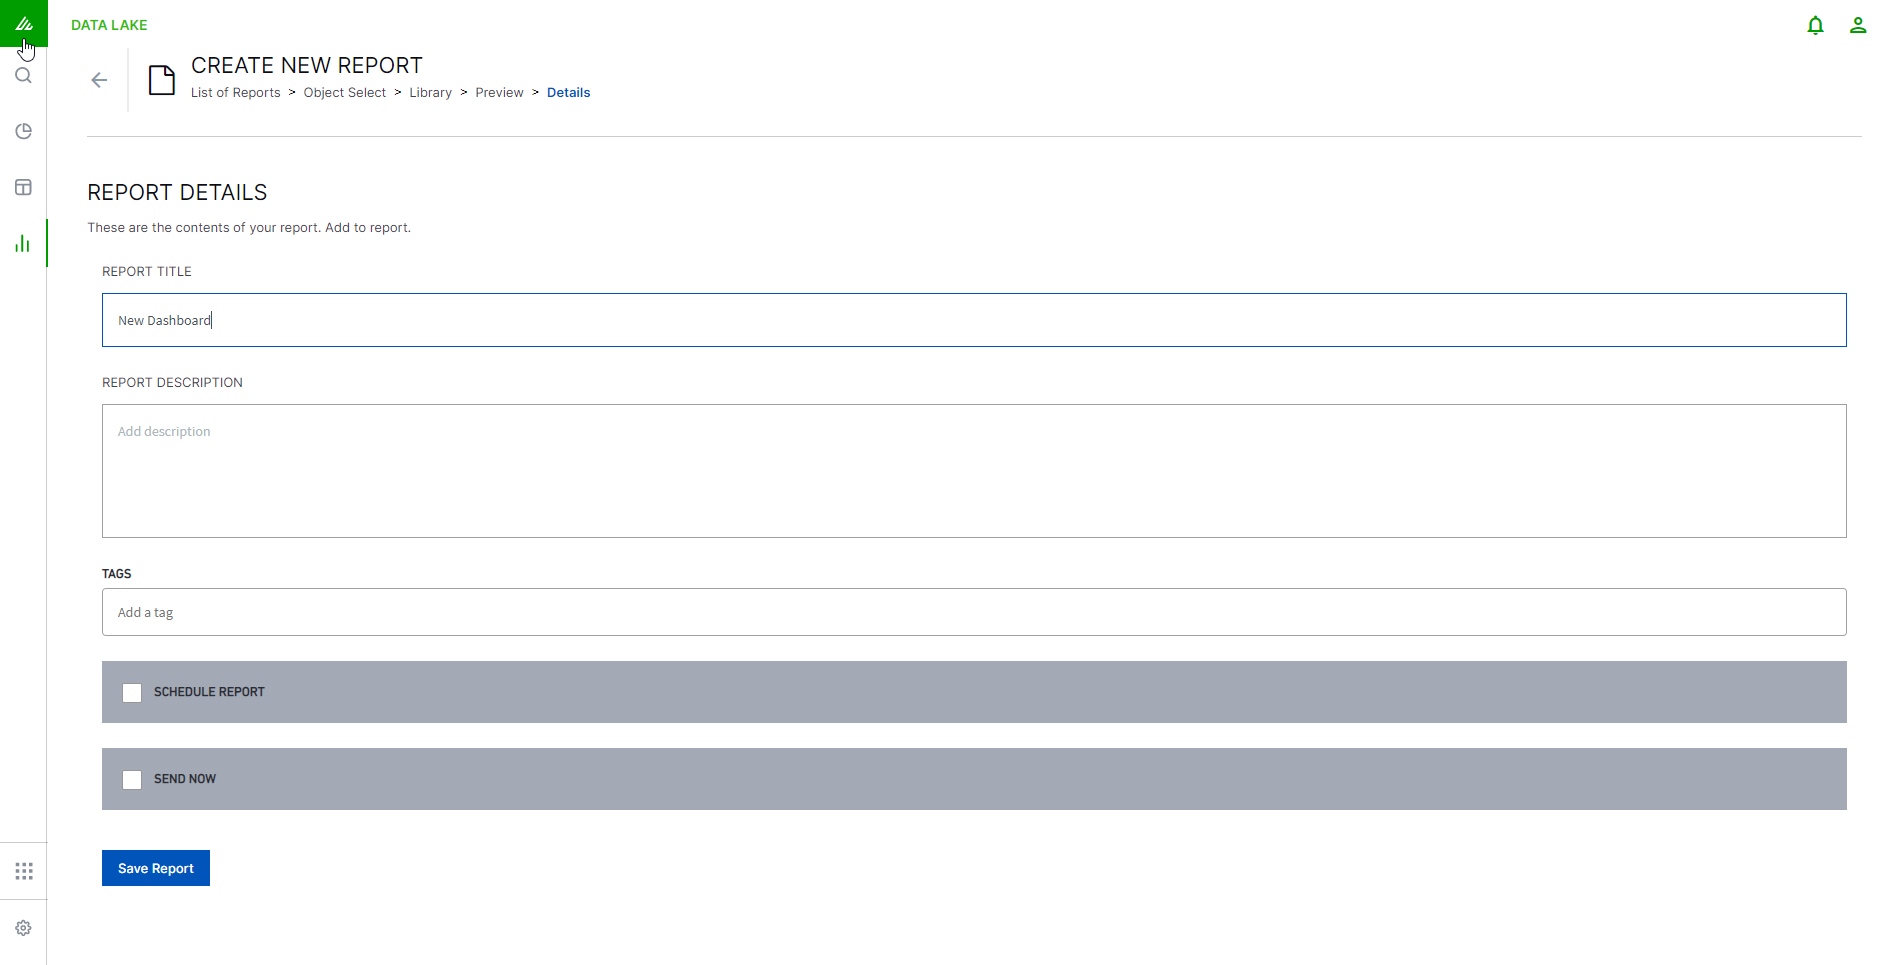
Give the report a title and description.
Note
Report names cannot contain special characters.
From this page you can:
Click in the Add a tag box to select from a predefined list of tags that you can add to your report.
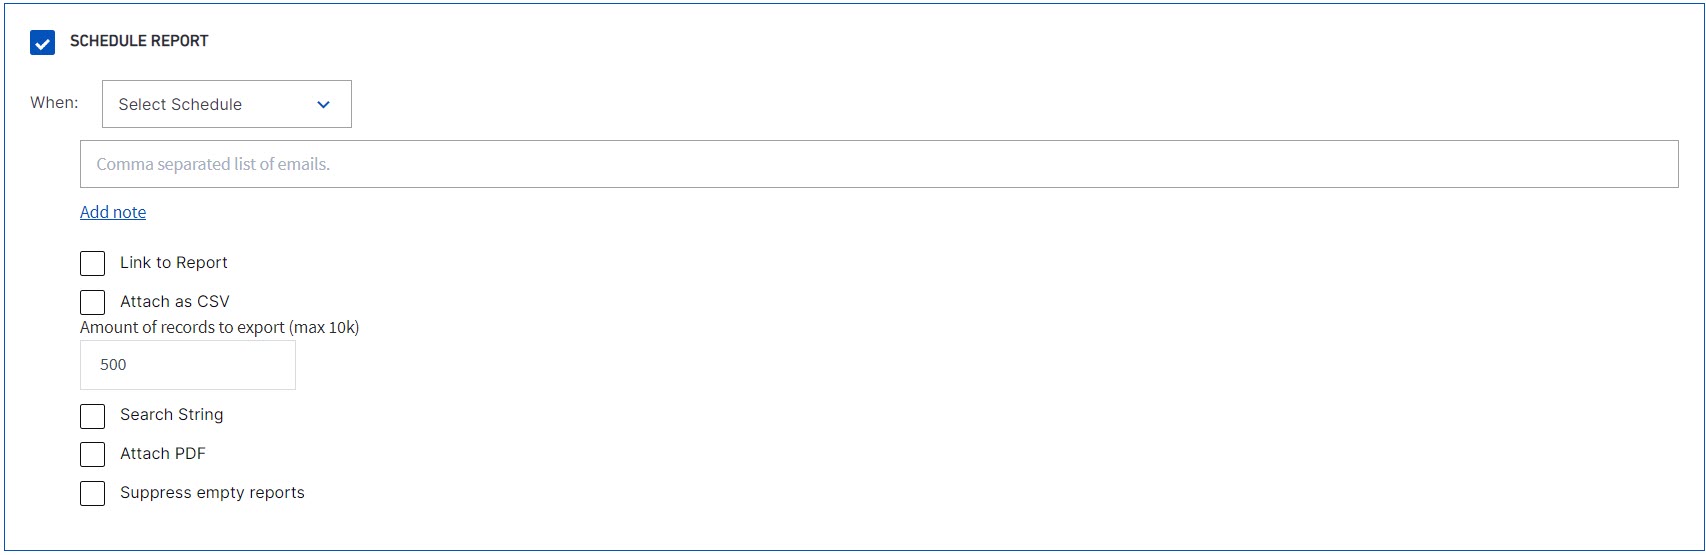
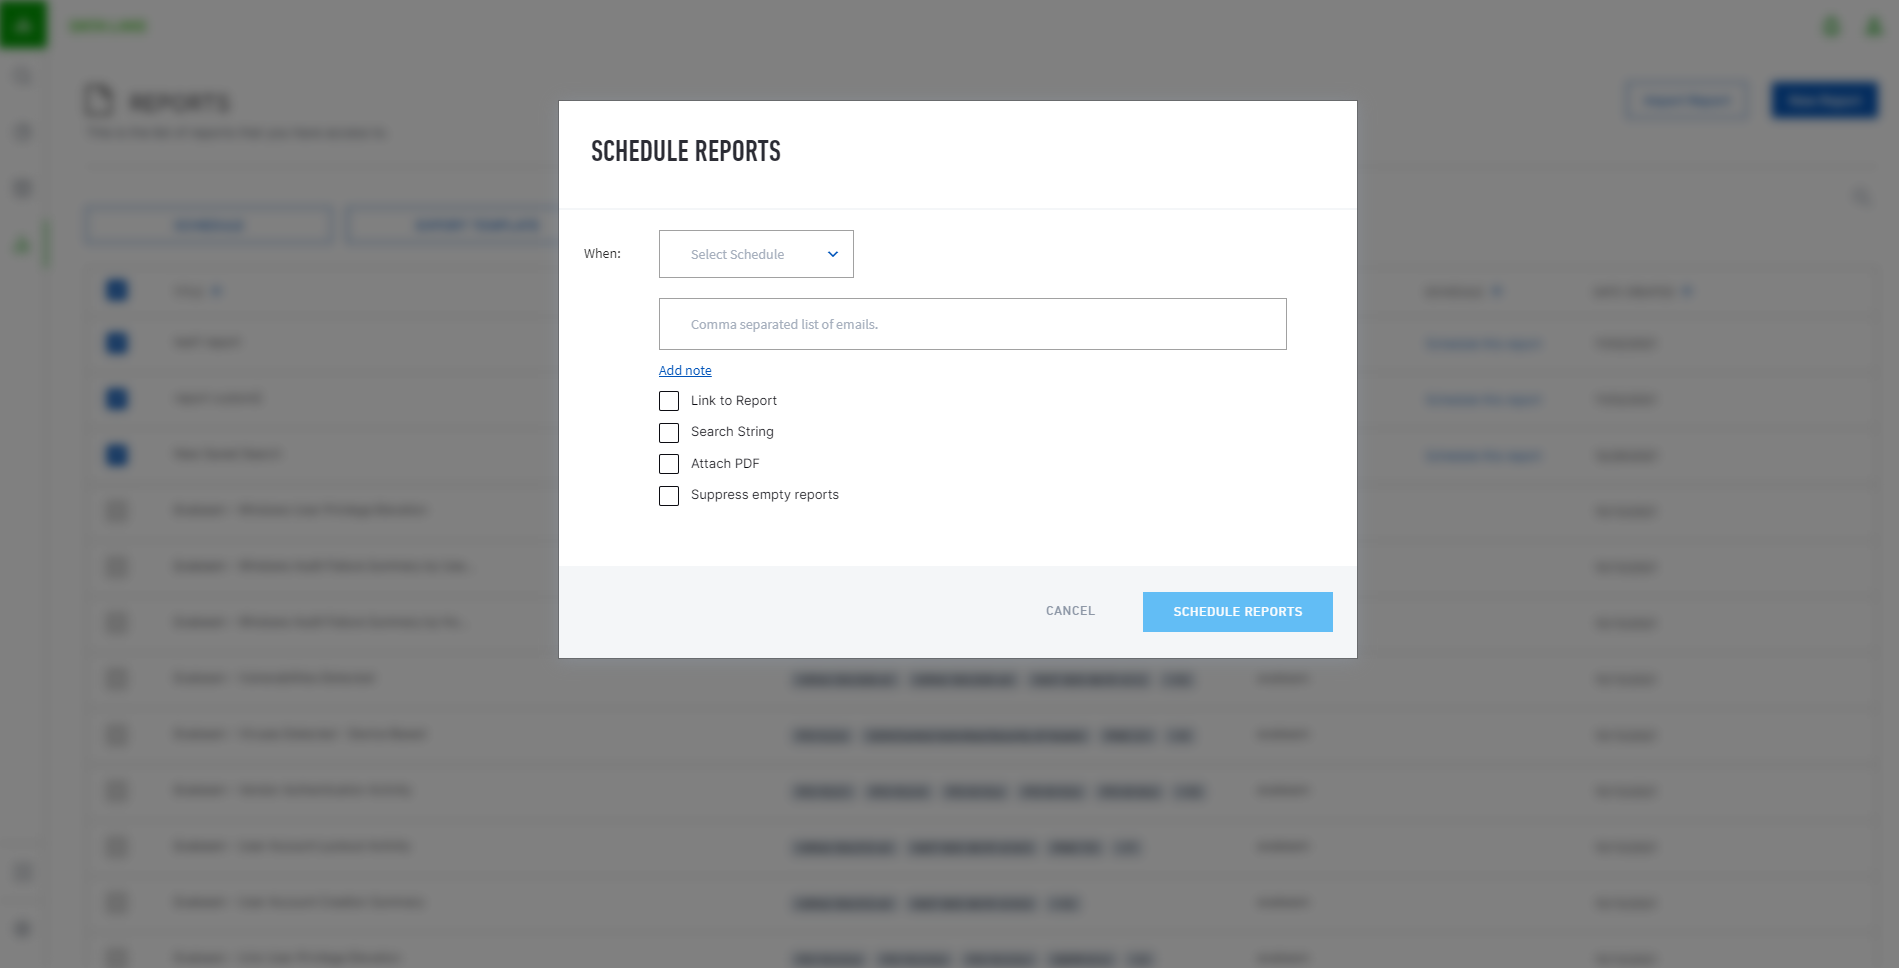
Tick the SCHEDULE REPORT box and enter the frequency with which you would like the report sent, and all of the recipients who should receive it.
Note
Tick the Attach as CSV box to attach the report as a CSV file, and enter the number of records to export (up to 10000). This option will only be available when building a report from a search (either new or existing), and will not be available if building a report from a dashboard.
Tick the SEND NOW box which will run and send the report when you save.
Click Save Report.
Create an Exabeam Data Lake Report from New Search
Note
Reports based on searches that would return more than 10 billion records will result in an error.
If you selected CREATE NEW SEARCH when creating a new report, the Search landing page will be opened.
Input the search terms that you would like your Report to be based on. Data Lake accepts searches in the Lucene query language.
Your search will be run and the results displayed as a preview of what your Report would look like with those search terms.
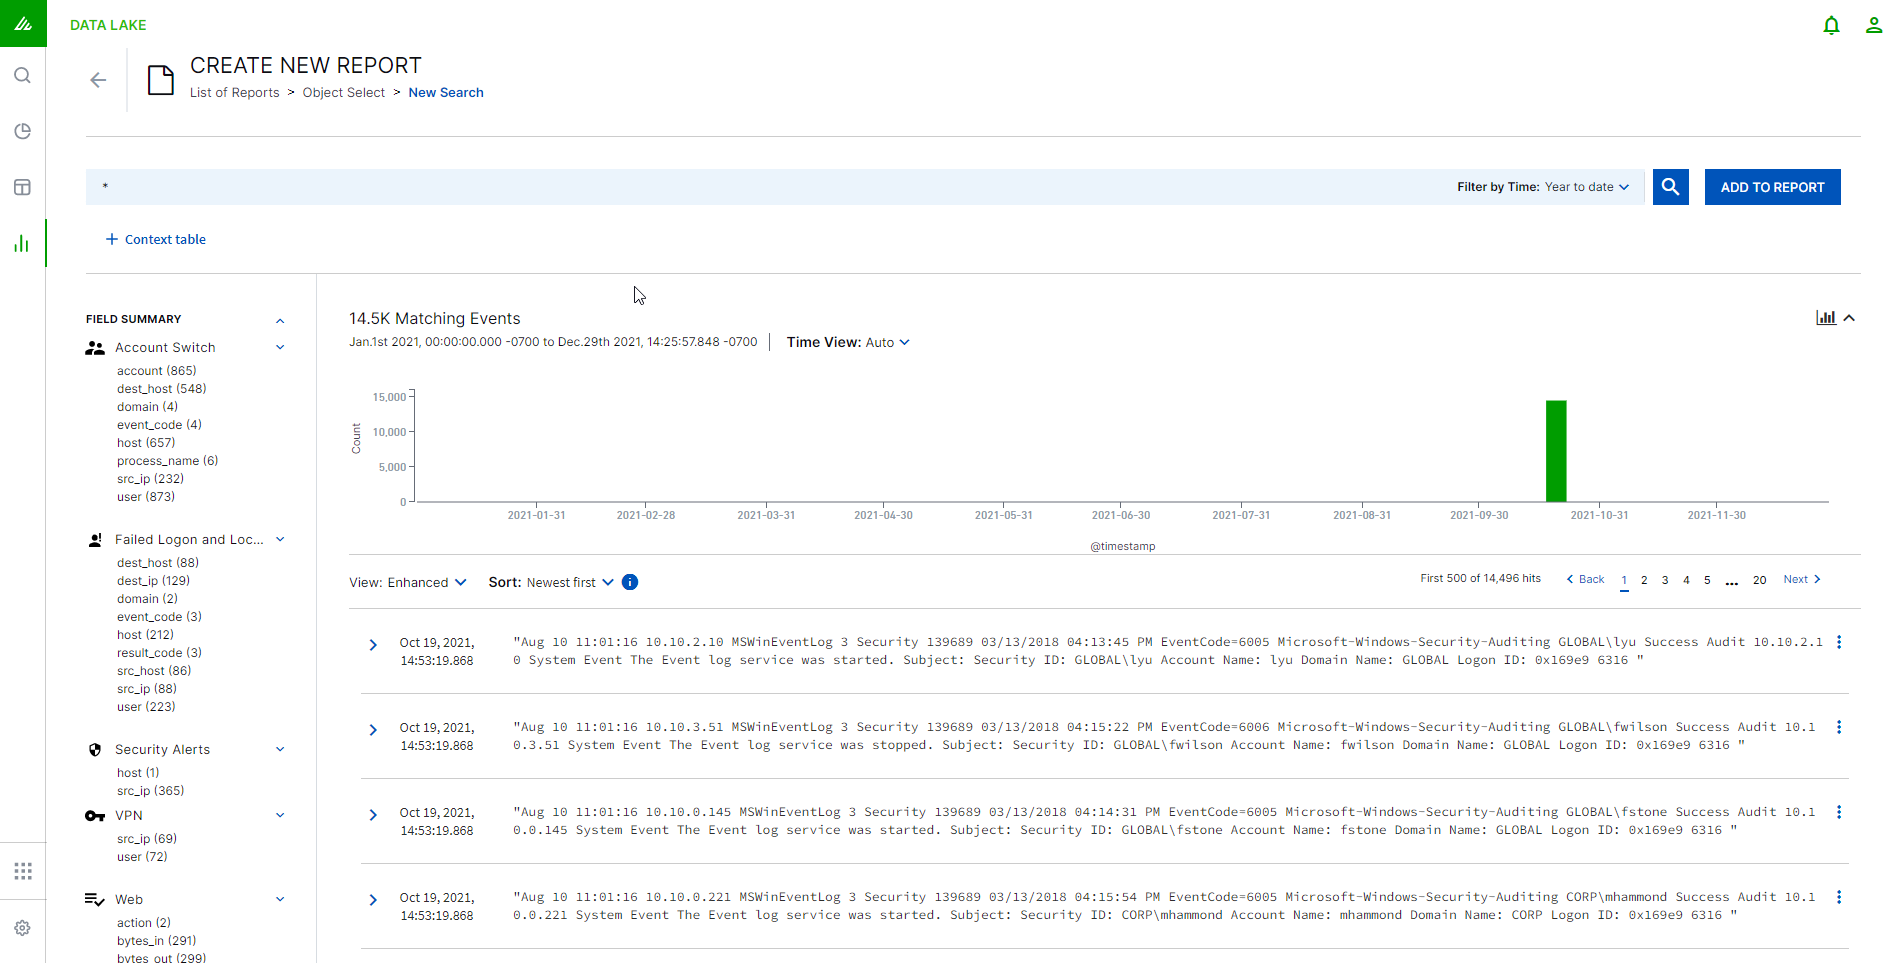
If you are satisfied with the Report preview, click ADD TO REPORT. If you are not satisfied, return to the previous screen and edit your search terms.
Give the report a title and description.
Note
Report names cannot contain special characters.
From this page you can:
Click in the Add a tag box to select from a predefined list of tags that you can add to your report.
Tick the SCHEDULE REPORT box to enter the frequency with which you would like the report sent, and all of the recipients who should receive it.
Note
Tick the Attach as CSV box to attach the report as a CSV file, and enter the number of records to export (up to 10000). This option will only be available when building a report from a search (either new or existing), and will not be available if building a report from a dashboard.
Tick the SEND NOW box which will run and send the report when you save.
Click Save Report.
Multi-select Exabeam Data Lake Reports
Reports can be multi-selected in order for the user to perform mass operations on them. The following changes can be made:
Schedule - Reports can be scheduled. When multiple reports are selected and scheduled, they will be put on the same schedule and delivered to the same list of email recipients.
Export Template - Reports can be exported. When multiple reports are selected, and the export button is clicked, all the reports (along with the underlying search, visualization, and schedule) are downloaded as a zip archive of JSON files.
Delete - Reports can be deleted. When multiple reports are selected and the delete button is clicked, all reports will be deleted. This action cannot be undone.
Compliance Reports in Exabeam Data Lake
Exabeam offers compliance report templates for both U.S. and international regulations. Data Lake supports the following compliance reports out-of-the-box:
Note
Please contact your Data Lake administrator to enable/disable any out-of-the-box compliance reports listed below.
GDPR – Protects the data and privacy for all individuals within the European Union (EU) and the European Economic Area (EEA). It also addresses the export of personal data outside the EU and EEA areas.
GPG – Protects U.K. citizens by ensuring protective monitoring of business processes and technology. It provides visibility and understanding of who is accessing an organization’s sensitive data.
HIPAA – Protects sensitive patient data. Any company that deals with protected health information (PHI) must ensure that all the required physical, network, and process security measures are in place and followed.
NIST – Protects U.S.-based organizations in the science and technology industry by producing standards and guidelines to help these federal agencies meet the requirements of the Federal Information Security Management Act (FISMA).
PCI DSS– A set of security standards designed to ensure that all companies that accept, process, store, or transmit credit card information maintain a secure environment.
SOX – Protects shareholders and the general public from accounting errors and fraudulent practices in enterprises, and improves the accuracy of corporate disclosures.
Administrators have access to Exabeam-provided reports in Settings > Security Content > Exabeam Reports. Permission to access these reports must be granted by a user assigned the Administrator role.
Out-of-the-box Reports:
|
|
Only users with administrator privileges can view these reports unless they are shared amongst various roles.
These reports cannot be edited. However, you can make copies of reports to edit by you or roles you have shared the copy with.
Tags
Data Lake Analysts are able to see which report is mapped to which regulation, sort and search by tag. Tags provide the ability to group different types of objects together. They can also be used in searching and filtering. Within Data Lake there are hundreds of out-of-the-box reports that could map to multiple regulations. Analysts can edit tags that Exabeam has added to a report as well as add tags to reports that they have created. When reports are exported, the tags will be included as part of the export.
Data Lake Event Categorization
Data Lake supports multiple categorization attributes for each log or event type defined in the product. Different vendors use different fields and terms in their logs.
Categorizing events provides a consistent taxonomy for queries, reports, visualization, dashboard, search, and correlation rules. Our out-of-the-box compliance reports leverage this nomenclature.
For example, a log has the following value:
exa_activity_type: authentication/local_logon
This log will also be returned in the query:
exa_activity_type=authentication
Current categories are:
exa_category
exa_device_type
exa_activity_type
exa_outcome
Examples:
exa_activity_type = account-management/user/create
exa_device_type = operating-system/network/firewall
exa_outcome = success/allow
Import a Report
If you move from a proof-of-concept (POC) or User Accepting Testing (UAT) cluster to a production cluster, and you also want to move any reports you manually created using searches or visualizations, you must export and import them to the new cluster. You can import the report only if the clusters are of the same version or adjacent versions.
Import a report you manually created to move it between POC, UAT, and production clusters; or a report from a content package to get data and dashboards about external partners and vendors.
If you're moving between a POC, UAT, or production cluster, ensure that you have exported the report(s) you're moving. If you downloaded a content package in a
tar.gzformat, ensure that you untar it:tar -C /opt/exabeam -xvf <tarfile.tar.gz>
Navigate to the Reports page. (
).Click Import Report.
Select and upload the JSON file from your file system. The reports are sorted alphabetically.
Note
You can only import a Data Lake report exported from another cluster, or JSON files provided in an security content package.
Data Lake automatically creates dashboards from these reports. To view these dashboards, navigate to the Dashboards page. (
 ). Click LIBRARY, then click Saved Dashboards.
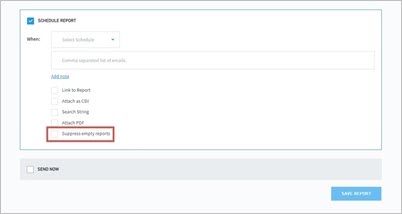
Suppress Empty Exabeam Data Lake Reports
Optimize Data Lakes output by suppressing reports that have empty content.
Navigate to the Reports page. (
)Find the report for which you want to suppress empty outputs, and click the Edit icon.
On the Report Details page, click SCHEDULE REPORT.
Click Suppress empty reports and then click Save Report.