- Exabeam Site Collector
- Exabeam Site Collector Network Ports
- Exabeam Site Collector Specifications
- Install Exabeam Site Collector
- Upgrade Exabeam Site Collector
- Advanced Exabeam Site Collector Customizations
- Supported Exabeam Site Collector Changes
- Configure Transport Layer Security (TLS) Syslog Ingestion
- Direct Kafka Input to Exabeam Site Collector
- Add a Secondary Syslog Destination
- Remove a Syslog Destination
- Filter Incoming Syslog Events in Exabeam Site Collector
- Filtering Outbound Logs in Exabeam Site Collector
- Metadata Collected by Site Collector and Supported Agents
- Add OpenVPN After Exabeam Site Collector Installation
- Supported Exabeam Site Collector Changes
- Troubleshoot for Exabeam Site Collector
- Scenario 1: Collector or its status does not appear in the console and no logs reach destination
- Scenario 2: Collector is healthy but no logs are transmitted or received
- Scenario 3: Exabeam Advanced Analyticsunable to pull LDAP data
- Scenario 4: Kafka Google Cloud Storage (GCS) collectors have not appeared on Data Lake
- Scenario 5: If logs are not uploaded to GCS where logs are not on Data Lake
- Scenario 6: Unable to accept incoming syslog, active directory context, Splunk logs, or Incident Responder integrations
- Scenario 7: Cannot send after transport endpoint shutdown
- Scenario 8: Too many arguments in command /tools/config.parser.sh
- Other scenarios
- Capture Site Collector Diagnostics Using Exabeam Support Package
- Install and Upgrade Exabeam Site Collector for On-premises and Legacy Deployments
- Prerequisites
- Install Site Collector for Exabeam Data Lake On-premises Deployments
- Installing Site Collector for Exabeam Advanced Analytics On-premises Deployments
- Upgrade Site Collector for Exabeam Data Lake On-premises Deployments
- Upgrade Site Collector for Exabeam Advanced Analytics On-premises Deployments
- Uninstall Exabeam Site Collector
- Migrate to the New-Scale Site Collectors Service
- A. Glossary of Terms
Troubleshoot for Exabeam Site Collector
Below are troubleshooting steps for common scenarios found in the Exabeam Site Collector.
In order to run commands given in this chapter, you must be able to log into site collector host and start a terminal session. You will initiate a screen session to prevent termination of your session.
screen -LS [yourname]_[todaysdate]
If the scenarios do not apply to your issue, please capture diagnostics data and contact Exabeam Customer for further assistance.
After installation, update, or during loss of data throughput, if the site collector does not appear in the Exabeam SaaS Status page or Exabeam Data Lake Collectors list (navigate to Settings > Collector Management > Collectors), verification must be run at the site collector host to ensure necessary services are running and there is throughput.
Run the following command to check all Exabeam Site Collector Services:
sudo /opt/exabeam/tools/sc-services-check.sh
Here is an excerpt from the response of a working site collector where Datadog and OpenVPN is not deployed:
Check all Site Collector services

Check Zookeeper service...
● zookeeper.service
Loaded: loaded (/etc/systemd/system/zookeeper.service; enabled; vendor preset: disabled)
Active: active (running) since ...
Main PID: 5887 (java)
CGroup: /system.slice/zookeeper.service└─5887 java -Xmx512M -Xms512M -server -XX:+UseG1GC -XX:MaxGCPauseMillis=20 -XX:InitiatingHeapOccupancyPercent=35 -XX:+ExplicitGCInvokesConcurrent -Djava.awt.headless=true -Xloggc:/opt/kafka/bin/../logs/zookeeper-gc.log -verb...Mar 09 18:28:17 centos7 zookeeper-server-start.sh[5887]: [2021-03-09 18:28:17,472] INFO Processed session termination for sessionid: 0x178183f22620001 (org.apache.zookeeper.server.PrepRequestProcessor)...

Check Kafka service...
● kafka.service
Loaded: loaded (/etc/systemd/system/kafka.service; enabled; vendor preset: disabled)
Active: active (running) since ...
Main PID: 6028 (java)
CGroup: /system.slice/kafka.service└─6028 java -Xmx4G -Xms4G -server -XX:+UseG1GC -XX:MaxGCPauseMillis=20 -XX:InitiatingHeapOccupancyPercent=35 -XX:+ExplicitGCInvokesConcurrent -Djava.awt.headless=true -Xloggc:/opt/kafka/bin/../logs/kafkaServer-gc.log -verbos...Mar 09 18:28:39 centos7 sh[6028]: [2021-03-09 18:28:39,206] INFO [Partition lms.kafka.topic-2 broker=1] lms.kafka.topic-2 starts at Leader Epoch 0 from offset 0. Previous Leader Epoch was: -1 (kafka.cluster.Partition)...

Check Logstash service...
● logstash.service
Loaded: loaded (/etc/systemd/system/logstash.service; enabled; vendor preset: disabled)
Active: active (running) since …
Main PID: 7244 (java)
CGroup: /system.slice/logstash.service└─7244 /bin/java -Xms4g -Xmx4g -cp /opt/logstash/logstash-core/lib/jars/commons-compiler-3.0.8.jar:/opt/logstash/logstash-core/lib/jars/google-java-format-1.1.jar:/opt/logstash/logstash-core/lib/jars/guava-19.0.jar:/opt/logs...
Mar 09 18:28:58 centos7 sh[7244]: transactional.id = null
Mar 09 18:28:58 centos7 sh[7244]: value.serializer = class org.apache.kafka.common.serialization.StringSerializer...

DataDog is not installed...
OpenVPN is not installed...

Check SC Forwarder service...
● exabeam-rsc-forwarder.service - exabeam-rsc-forwarder
Loaded: loaded (/etc/systemd/system/exab
Review the output from your site collector and to see if any required services have failed to load. Ensure that the parameters for each service shown in the response is correct. If you have services that failed to load, run diagnostics and send the output to Exabeam for further assistance. If no services failed to load, then determine whether there are network issues impeding data throughput.
If using OpenVPN, check the OpenVPN client logs for error messages, then check if the OpenVPN client is running on site collector server.
# check status of openvpn client
sudo systemctl status openvpn@<instanceID>

# check logs of openvpn client
sudo journalctl -fu openvpn@<instanceID>
Resolve the issues cited in the error messages. Logs should start appearing without an OpenVPN service restart.
If you have confirmed that the network is allowing traffic yet no logs are being sent or received at the configured destinations, run diagnostics and send the output to Exabeam for further assistance.
Firewall rules may not be applied properly (for example, those in SE Linux) for your environment. Run the following command:
firewall-cmd --zone=public --add-forward-port=port=389:proto=tcp:toport=389:toaddr=$<dns_server> --permanent
firewall-cmd --reload
Generate LDAP context again and the data should become available without restarting additional services.
If the above command still fails to resolve the issue, run the following alternative command:
firewall-cmd --add-forward-port=port=389:proto=tcp:toport=389:toaddr=$<dns_server> --permanent
firewall-cmd --reload
Note
Port 389, given in this example, is used for LDAP. It may be different for your organization. Please confirm with your organization's network configuration.
Verify if the Forwarder and Kafka-to-GCS managers are running.
# check status of exabeam kafka gcs1 log manager
sudo systemctl status exabeam-kafka-gcs1-log-manager

# check status of exabeam kafka gcs2 log manager
sudo systemctl status exabeam-kafka-gcs2-log-manager

# check status of exabeam regional site collector forwarder
sudo systemctl status exabeam-rsc-forwarder
Check the logs of these services for error messages.
# check logs of exabeam kafka gcs1 log manager
sudo journalctl -fu exabeam-kafka-gcs1-log-manager
# OR
sudo cat /opt/exabeam/beats/gcs1/manager/logs/exabeat

# check logs of exabeam kafka gcs2 collector with either method below:
sudo journalctl -fu exabeam-kafka-gcs2-collector
#  OR
sudo cat /opt/exabeam/beats/gcs2/worker/logs/kafkabeat

# check logs of exabeam regional site collector forwarder with either method below:
sudo journalctl -fu exabeam-rsc-forwarder
#  OR
sudo cat /opt/exabeam/rscforwarder/logs/rscforwarder.log
Ensure that Kafka-to-GCS collectors are running in Data Lake :
On the site collector server, check if services on Kafka-to-GCS collectors are running without issues.
# check status of exabeam kafka gcs1 collector
sudo systemctl status exabeam-kafka-gcs1-collector

#  check status of exabeam kafka gcs2 collector
sudo systemctl status exabeam-kafka-gcs2-collector
Check the logs of the Kafka-to-GCS collectors services for errors.
# check logs of exabeam kafka gcs1 collector with either method below:
sudo journalctl -fu exabeam-kafka-gcs1-collector
#  OR
sudo cat /opt/exabeam/beats/gcs1/worker/logs/kafkabeat

# check logs of exabeam kafka gcs2 collector with either method below:
sudo journalctl -fu exabeam-kafka-gcs2-collector
#  OR
sudo cat /opt/exabeam/beats/gcs2/worker/logs/kafkabeat
Verify collector configurations.
# check exabeam kafka gcs1 collector configuration
cat /opt/exabeam/beats/gcs1/worker/kafkabeat.yml

# check exabeam kafka gcs2 collector configuration
cat /opt/exabeam/beats/gcs2/worker/kafkabeat.yml
If the logs come to site collector Syslog endpoint, check if Syslog service is up and check Syslog logs for any errors, verify on the site collector server.
# check status of syslog
sudo systemctl status logstash

# check logs of syslog
sudo journalctl -fu logstash
If the logs reach the Kafka endpoint (beats collectors), confirm that Kafka and Zookeeper services are up and check logs for any errors on the site collector server.
# check status of kafka
sudo systemctl status kafka

# check status of zookeeper
sudo systemctl status zookeeper

# check logs of kafka
sudo journalctl -fu kafka

# check logs of zookeeper
sudo journalctl -fu zookeeper
Verify that the
firewalldservice is running and not disabled.firewall-cmd --state
During initial installation, you may encounter the message:
Starting Firewalld - [!] error (1): Failed to execute operation: Cannot send after transport endpoint shutdown
Apply the following command to try to enable throughput:
systemctl umask firewalld
During startup, you may encounter the following messages:
./tools/config.parser.sh: line 131: [: too many arguments
./tools/config.parser.sh: line 137: [: too many arguments
[Configuration package has been extracted to /etc/ssl/certs/exabeam striped wrapper folders] [Parse from config file at: /etc/ssl/certs/exabeam/info.yml]
To resolve this, replace the startup file with a fresh copy from the installation package.
Unpack the site collector authentication package locally.
Pack the files back into the archive with the same name.
Upload them to the site collector host and then run installation command again.
Clues to site collector performance issues may be found when inspecting the status of your collectors as well as Logstash logs. To gather information to help Exabeam Customer Success resolve your issue, run the site collector support package with the following command to collect local site collector logs to attach to your troubleshooting case:
sudo ./support-package.sh
Restart or View Metrics for a Site Collector in Data Lake
Note
A restart will work only for Exabeam SaaS or on-premises Data Lake . It is not available for Advanced Analytics .
In Exbeam Data Lake , navigate to Settings > Collector Management > Collectors.
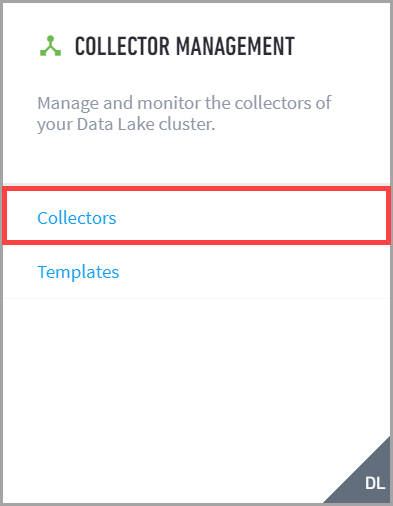
Click the More menu for the site collector record, and then select the state or view collector details from the ACTIONS menu.
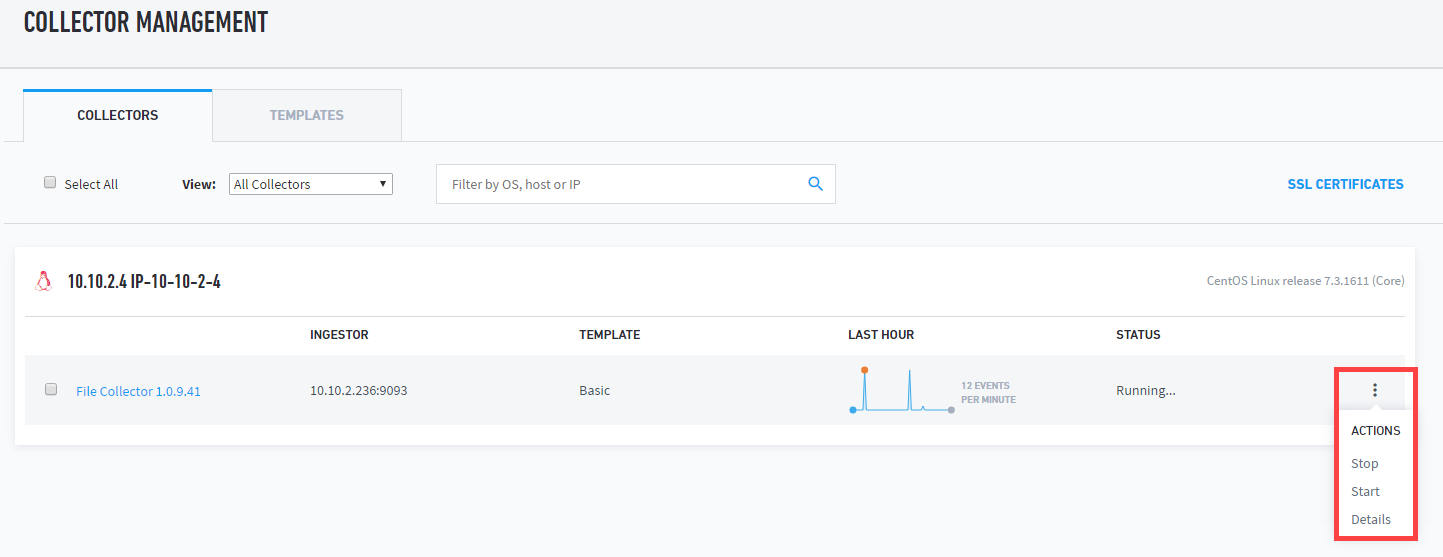
Restart the collector by selecting Stop and then Start.
To view performance metrics for the collector, select Details to open the Collector Details panel.
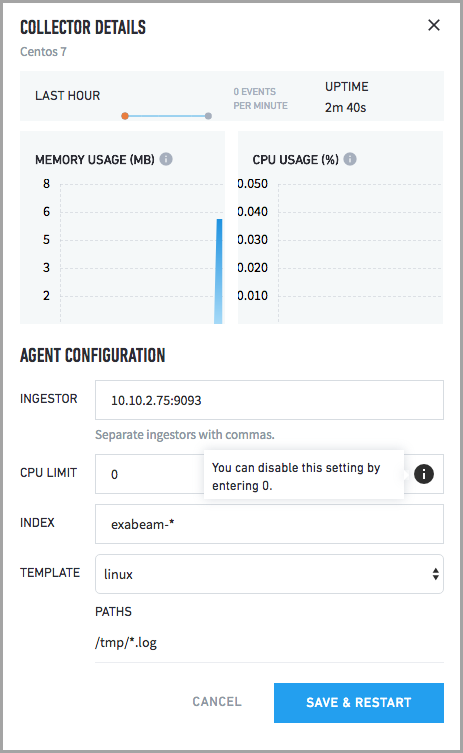
Click CANCEL to close the panel.
Inspect Logs
If restarting site collector services does not resolve the issues, additional information may be found in Logstash logs. The example below shows a typical Logstash log. When troubleshooting the site collector, review your logs and look for potential error messages:
Upload to GCS [2019-08-24T08:39:00,257][INFO ][logstash.outputs.googlecloudstorage] Uploading file to dl-format-topic-ops-dist-cybo5/format1_sfo-cybo3-lp1.exabeam.corp_2019-08-24T08-38-00.part000.1e2c933b-aa08-4520-a85b-a6b756f0bcc3.log.gz rotation (by default every 30 seconds or 5 mb compressed, whichever occurs first [2019-08-24T08:39:00,270][INFO ][logstash.outputs.googlecloudstorage] Rotated out file: /tmp/logstash-gcs-format2/format2_sfo-cybo3-lp1.exabeam.corp_2019-08-24T08-38-00.part000.63dd0d1a-2bcf-458e-935f-2de1cbd7d900.log.gz
Here are some of the possible ways to discover issues from the Logstash logs and how to resolved them:
Monitor logs for errors:
sudo journalctl -u logstash
If OpenVPN is not connected, restart the service:
sudo systemctl start openvpn@InstanceID
If using Google Cloud Storage (default), use the following commands be used to view the number of events pending upload to Google Cloud Storage:
sudo /opt/kafka/bin/kafka-consumer-groups.sh --bootstrap-server localhost:9092 --describe --group group-gcs-gcs1
sudo /opt/kafka/bin/kafka-consumer-groups.sh --bootstrap-server localhost:9092 --describe --group group-gcs-gcs1 | awk ‘{s+=$5}END{print s}'

sudo /opt/kafka/bin/kafka-consumer-groups.sh --bootstrap-server localhost:9092 --describe --group group-gcs-gcs2
sudo /opt/kafka/bin/kafka-consumer-groups.sh --bootstrap-server localhost:9092 --describe --group group-gcs-gcs2 | awk ‘{s+=$5}END{print s}'
If unable to accept incoming syslog or if Active Directory context, Splunk logs, or Exabeam Incident Responder integrations are not working, verify the
firewalldservice is running and not disabled by running the command below:firewall-cmd --state
Confirm messages sent to the site collector using syslog protocol arrive to the server (add tcpdump filters for source IP as needed or grep to look for a specific message):
tcpdump -nnvvAs0 -i any dst port 514
Confirm messages sent to the Site Collector using beats arrive to the server by running the command below (add tcpdump filters for a specific source IP, note that this traffic is encrypted):
tcpdump -nn -i any dst port 9093
Confirm messages are in Kafka:
For syslog and Windows log beats (Winlogbeat), use the following command to view new messages arriving in Kafka
sudo /opt/kafka/bin/kafka-console-consumer.sh --bootstrap-server localhost:9092 --topic lms.kafka.topic
If you want to inspect raw logs of site collector components, see files located in the following locations:
Component | Location |
|---|---|
Logstash |
|
External Kafka |
|
Forwarder |
|
Kafka |
|
GCS destination |
|
The Exabeam Customer Success team may require additional data to further assist in troubleshooting. Exabeam has provided a script to support capturing diagnostic information about your site collector. Please run the command based on your situation:
To collect data just after a site collector installation:
sudo /tmp/Exabeam_Site_Collector/bin/support-package.sh
To collect data from a running site collector: