Dashboards Features Introduced in 2025
June 2025
Feature | Description |
|---|---|
Increased Count Maximum for the Anomalies Dashboard | The maximum end of the Trigger Count filter has been increased to a value of 10,000 in the pre-built Anomalies dashboard. This increase allows more accurate anomaly trigger rate reporting. 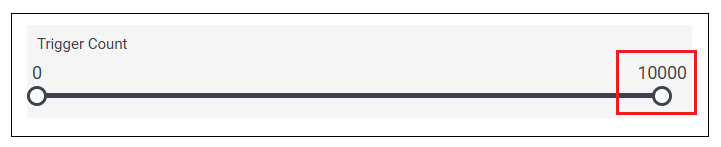 For more information, see Anomalies Dashboard in the Dashboards Guide. |
New Compliance Dashboards Available | The following pre-built dashboards are available so that analysts and management can monitor compliance-focused activity on a recurring basis. These dashboards can be used to look for anomalous behavior, system health, and environmental trends. They can also be used to produce reports and provide evidence to assessors and auditors as needed.
For more information about the pre-built compliance dashboards, see Compliance Dashboards in the Dashboards Guide. |
New Bulk Actions Available for Scheduled Reports | The following new bulk actions are now available for the Scheduled Reports tab:
For more information, see Configure and Manage Scheduled Reports in the Dashboards Guide. |
April 2025
Feature | Description |
|---|---|
Support for STIX/TAXII based Context Tables | You can now filter dashboard visualizations for threat intelligence data from both Exabeam-provided and STIX/TAXII-based sources. This functionality is made possible because the Context Management service now provides threat intelligence data from both prebuilt, curated sources and from external log sources that support the STIX/TAXII framework. NoteSTIX/TAXII context tables are available as part of a Cloud Collector Early Access program. During the early access period, you can access this functionality for STIX/TAXII context tables only if you participate in the program. To participate, see Sign Up for the Early Access Program, in the Cloud Collectors Administration Guide For more information, see Include Context Filtering in Visualizations in the Dashboards Guide. |
Updates to AI/LLM Pre-built Dashboards | The following updates have been made to AI/LLM pre-built dashboards:
For more information about the AI/LLM pre-built dashboards, see AI/LLM Dashboards in the Dashboards Guide. |
Improve Filtering a Visualization on a Context Table | Filter behavior has been improved when selecting a context table as a query filter for a visualization. You can now select a context table that contains no records and add it to the visualization query filter. However, the visualization will not display any results until at least one record is added to the context table. A new message has been added to alert you when the context table you select contains no records. 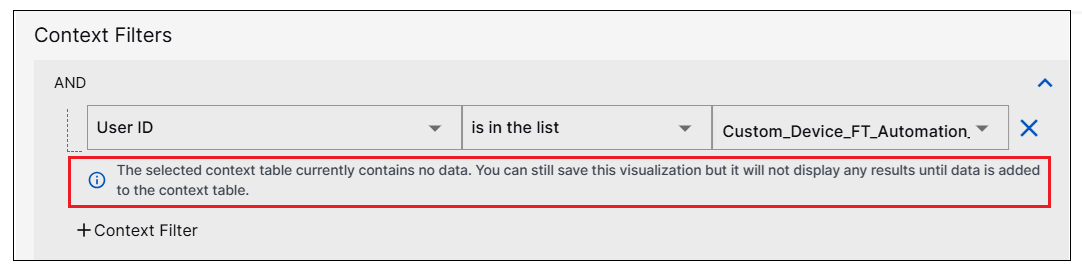 For more information, see Include Context Filtering in Visualizations in the Dashboards Guide. |
March 2025
Feature | Description |
|---|---|
New Scheduled Reports Tab | A new Scheduled Reports tab has been introduced in the Dashboards application. The new tab provides a centralized view of all the dashboard reports you have currently scheduled for delivery via email. From the new Scheduled Reports tab you can see which dashboards are scheduled for delivery, which recipients are scheduled to receive them, and on what schedule they will be delivered. You can also control the scheduled reports, with options to Run Now, Edit, Duplicate, or Delete. For more information about the new tab, see Navigate the Scheduled Reports Tab in the Dashboards Guide. |
February 2025
Feature | Description |
|---|---|
Auto-Creating a Threat Center Alert Visualization from a Natural Language Prompt | As part of Exabeam Nova and its set of AI-driven capabilities, the use of the natural language prompt for auto-creating a dashboard visualization has been expanded to an additional data model. You can now use the natural language prompt for the Threat Center Alerts data model. This enhancement means that you can leverage the natural language prompt in the Dashboard application to describe, in plain language, the Threat Center Alerts data you want to visualize. Based on this plain language prompt, the measures, dimensions, filters, and even the chart type are configured automatically. NoteThis auto-create option is currently available to create visualizations only for the Event Store Event data model and the Threat Center Alerts data model. You must be using Threat Center to access the Threat Center Alerts data model. If the automatically generated visualization does not produce the data you want to visualize, you can modify the visualization settings manually to produce exactly the desired results. For more information about auto-creating visualizations, see Auto-Create a Visualization from a Natural Language Prompt in the Dashboards Guide. |
January 2025
Feature | Description | ||
|---|---|---|---|
Support for Pivoting to Search for Rule Triggered Events | To support pivoting into Search for rule-triggered events that are represented in dashboards and visualizations, the Show Results in Search option is now available for those events. Using this option allows you to click on a specific area or data point in a visualization and pivot from Dashboards to the Search application. There you can drill down further to investigate the rule-triggered event. For information, see View and Interact with a Dashboard or View and Interact with a Visualization in the Dashboards Guide. | ||
Updated Audit Log Support for Dashboards | Audit log coverage has been updated for dashboards in the New-Scale Security Operations Platform. For clarity, all activity types for dashboards have been renamed from
For information, see Dashboards in Audit Logs in the Dashboards Guide. |