- Dashboards
- Navigation Overview
- View and Interact with Dashboards
- View and Interact with Visualizations
- User Management
- Configure and Manage Dashboards
- Create a Dashboard
- Add a Visualization to a Dashboard
- Add a Text Tile
- Modify a Dashboard Layout
- Add Dashboard Filters
- Manage Automatic Refresh Rates
- Create a Scheduled Report
- Make a Dashboard Public
- Export and Import Dashboards
- Edit Dashboard Filters
- Edit Dashboard Details
- Duplicate a Dashboard
- Delete a Dashboard
- Configure and Manage Visualizations
- Create a Visualization
- Auto-Create a Visualization from a Natural Language Prompt
- Create a Visualization from a Search Query
- Add Visualizations from the Library to a Dashboard
- Modify a Visualization
- Configure Visualization Query Filters
- Include Context Filtering in Visualizations
- Make a Visualization Public
- Export and Import Visualizations
- Duplicate a Visualization
- Remove a Visualization from a Dashboard
- Delete Visualizations from the Library
- Configure and Manage Scheduled Reports
- Pre-Built Dashboards
- Advanced Analytics Dashboards
- AI/LLM Dashboards
- Case Manager Dashboards
- Compliance Dashboards
- Correlation Rules Dashboards
- Event Store Dashboards
- Access Grant and Revoke Activity
- Account Logout Summary
- Account Management Activity
- Application Security Event Summary
- Authenticated User Accounts on Hosts
- AWS CloudTrail Summary
- Data Loss Prevention Activity – Host-Based
- Data Loss Prevention Activity – User-Based
- Data Loss Prevention Activity Summary
- Default Account Access
- Default Credential Usage and Change Activity
- Denied Web Access Activity
- Disabled User Account Summary
- Discovered Attacks by Source and Destination
- Endpoint Detection and Response
- Failed Application Logon Activity
- Failed Audit Logs Summary
- Failed Host Login Attempt Counts by Users
- Failed VPN Login Attempts and Remote Session Timeouts
- Firewall Activity
- Firewall and Router Device Interfaces
- Insecure Authentication Attempts
- IOC Statistics
- Log Delay Insights
- Microsoft 365 Summary
- Microsoft Windows Overview
- Network Applications by Traffic Volume
- Policy Activity Summary
- Ports Usage Trend
- Privileged Access
- Privileged Access – User-Based
- Project Collateral
- Protocols by Network Traffic
- Remote Session Overview
- Security Alert Summary – Impacted Hosts
- Security Alert Summary – Origin Hosts
- Security Alert Summary – Users
- Successful Application Logon Activity
- Successful Database Login Activity
- Successful Physical Access
- Top Attackers
- User Account Creation Summary
- User Account Lockout Activity
- Vendor Authentication Activity
- Windows Audit Failure Summary by Hosts
- Windows Audit Failure Summary by Users
- Windows User Privilege Elevation
- Zscaler HTTP Dashboard
- Security Operations Center Management Dashboards
- Threat Center Dashboards
- Pre-Built Visualizations
- Anomalies - Use Case & MITRE Coverage
- Anomalies by Rule Name
- Anomalies by Use Case
- Anomalies Count Over Time
- Anomaly Distribution by MITRE Tactic & Score
- Application Count
- Closed Incidents
- Correlation Rules by Severity
- Correlation Rules Triggered Over Time
- Detected Anomalies
- Host-Based DLP Alerts Count
- Incidents Created
- Incident Summary by Incident Type
- Number of Hosts with DLP Alerts
- SOC Incident Distribution
- Top 5 Host-Based DLP Alert Categories
- Top 5 Protocols in Host-Based DLP Alerts
- Top 10 Host-Based DLP Alert Types
- Top 10 Hosts with DLP Alerts
- Top Activities per Top 10 Applications
- Top Users per Top 10 Applications
- Trend of Application Security Events
View and Interact with Dashboards
To view a specific dashboard, navigate to the Dashboards tab, on the Dashboards homepage, and click on a dashboard row or tile to open it.
When you open a dashboard, you can interact with it in the following ways:
Edit the dashboard – Click Edit in the top right corner to make the dashboard available for editing. You can edit existing visualizations or filters. You can also do the following:
Add a visualization – Click Add Visualization to either add a visualization that already exists in the visualization library or to create a new visualization.
Add a new text tile – Click Add Text to create a new text tile for the open dashboard.
Add a filter – Click Add a filter to create a new filter that will be added to the open dashboard and will affect all of the visualizations on the dashboard.
For detailed information about working with dashboards, see Configure and Manage Dashboards.
View/Edit details – You can view or edit dashboard details, including a description, use cases, metadata tags, owner, and date created:
To view details, click the options menu icon
 , and select View details. A panel opens and displays dashboard details, as shown in the image below.
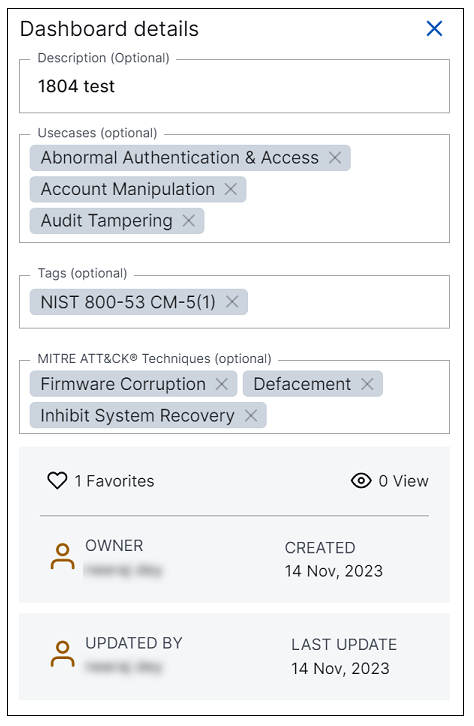
To edit details, first click Edit in the top right corner of the dashboard. Then click the options menu icon (
), and select Edit details. An editable version of the details panel opens. For more information about editing the details, see Edit Dashboard Details.
Set dashboard refresh settings – You can set the dashboard to refresh at automated intervals. To configure the refresh rate, click Edit in the top right corner of the dashboard. Then click the options menu icon (
 ), and select Refresh settings. A Settings dialog box opens.
You can configure a refresh rate that applies to the entire dashboard. You can also apply individual refresh rates to specific visualization tiles on the dashboard. If you set a different rate for a visualization, the individual tile setting overrides the dashboard setting. For more information about setting refresh rates, see Manage Automatic Refresh Rates.
Schedule dashboard email delivery – You can schedule regular deliveries of email with a snapshot of the dashboard in either PDF format or in a raw data CSV file. To schedule deliveries, click the options menu icon (
), and select Schedule delivery. A Schedules dialog box opens. Click New to create a new schedule. For more information about scheduling email deliveries of a dashboard, see Create a Scheduled Report.Tip
To view a list of all the currently scheduled reports, navigate to the Scheduled Reports tab from the top of the Dashboards landing page. On the Schedule Reports tab you can view and control all of the reports you have scheduled for delivery, including who receives them, how often, and in what format. For more information, see Navigate the Scheduled Reports Tab.
Download a dashboard – Click the options menu icon (
), and select Download. In the File Name field, enter a descriptive name for the downloaded file. In the Format field, you can opt to download a snapshot of the dashboard in a PDF format or download the raw dashboard data in a CSV file.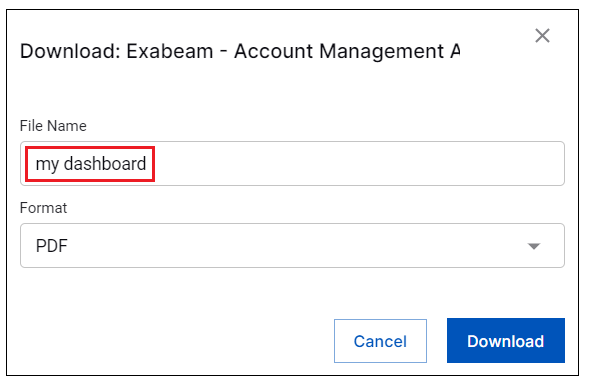
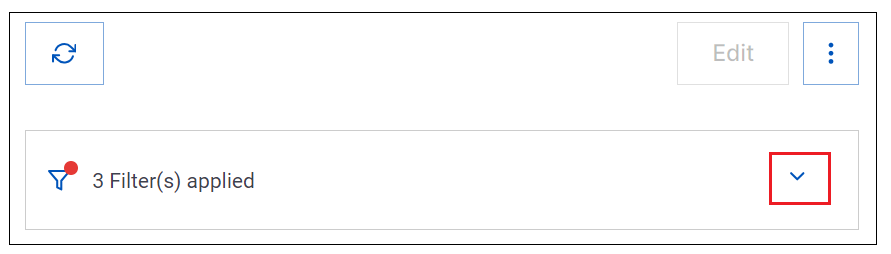
Refresh the dashboard display – Click the refresh icon (
 ) in the upper left to manually refresh the dashboard display.
Filter the dashboard – You can edit existing dashboard filters or add new ones as listed below. For information about editing filters, see Edit Dashboard Filters.
Access existing filters – If the dashboard already has existing filters, click the dropdown arrow on the right to access the filters.
Edit existing filters – You can edit an existing filter by changing or removing its existing filter criteria. You can also click the plus icon (
 ) to the right of a criteria field to add a new OR criteria to the filter. When you finish editing existing filters, click Apply to save your changes. These filters apply to all of the visualizations in the dashboard.
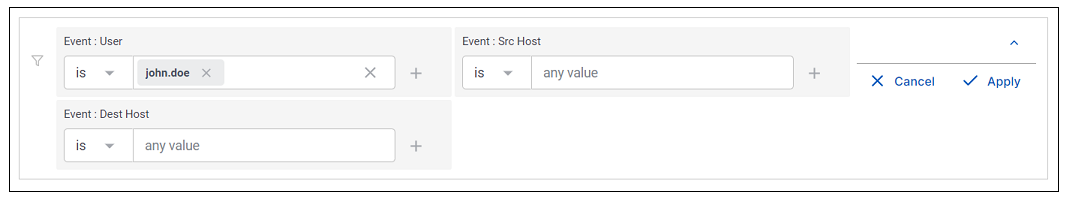
Add new filters – You can add new filters only by editing the dashboard. Click Edit in the top right and select Add a filter.
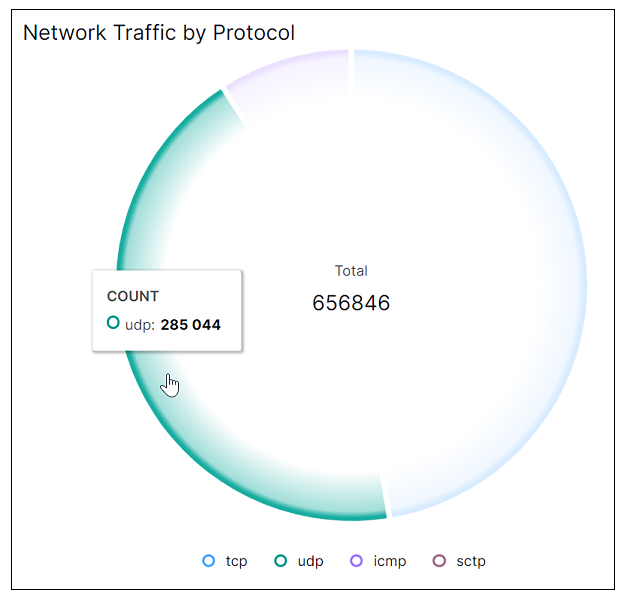
View data details represented by individual chart parameters – To view the numbers and other information represented by the different elements in a visualization graph, move your cursor over them. The information is displayed in tooltips, as shown in the example below.
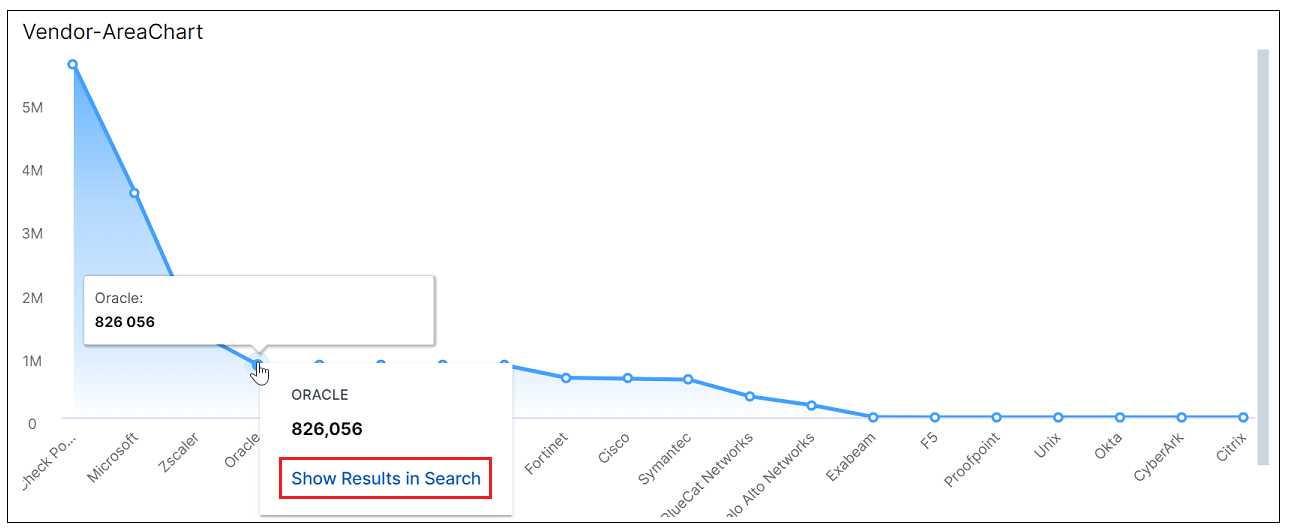
Drill into results and pivot to Search – To drill down into a visualization chart and view the represented events in the Search service, click on a chart area or data point. Then select Show Results in Search. The Search service opens in a new tab and the search field is populated with a query string for viewing the appropriate events. Click Search to view the results in the Search service.
Change the dashboard layout – To move a visualization tile, click on it and drag to a new location. To resize a tile, click the bottom right corner and resize it. For more information, see Modify a Dashboard Layout.
Perform actions on visualizations – There are several actions you can perform on individual visualizations that are included on the open dashboard. Click Edit in the top right corner of the dashboard to put it into edit mode. Then click the options icon (
) in the corner of a specific visualization tile and select any of the following options:Edit – Click to open the visualization in edit mode. For more information, see Modify a Visualization.
Hide Title – Click to hide the tile title. To redisplay it, click Show Title.
Duplicate Tile – Click to create a duplicate copy of the visualization on the same dashboard. For more information, see Duplicate a Visualization.
Add to Library – Click to add a visualization to the visualization library (available only if it's not yet in the library).
Unlink – Click to to unlink a visualization on the dashboard from the one in the visualization library (available only if it's already in the library).
Delete – Click to delete a visualization from the dashboard. This action does not delete a visualization from the visualization library, if it is in the library.