Dashboards Features Introduced in 2023
November 2023
Feature | Description |
|---|---|
Introducing Two New Prebuilt Dashboards | Two new pre-built dashboards are now available: |
October 2023
Feature | Description |
|---|---|
New Prebuilt Dashboard for Zscaler | The new pre-built Zscaler HTTP traffic dashboard provides a view of Zscaler Internet activity in your organization with details about:
|
September 2023
Feature | Description |
|---|---|
Dashboard Use Case and MITRE ATT&CK® Technique Tags | In addition to your own custom dashboard tags, you can now apply use case and MITRE ATT&CK® technique info tags to your dashboards. The new tags provide a taxonomic system for organizing and finding your dashboards. Use case tags enable you to classify your dashboards by the information that they're designed to gather and/or detect, such as privileged access activity or data exfiltration. Likewise, with MITRE ATT&CK® technique tags, you can classify your dashboards by the attack techniques they're designed to monitor.  To add these tags when you create new dashboards, see Create a Dashboard. To add these tags to your existing dashboards, see Edit Dashboard Details. |
August 2023
Feature | Description |
|---|---|
Visualizations from Queries in the Search Application | You can now quickly turn your queries in the Exabeam Search application into visualizations on new or existing dashboards. For more information, see Create a Visualization from a Search Query.  |
Introducing Four New Pre-Built Dashboards | The following pre-built Event Store dashboards are now available: |
Visualization Drill-Downs with Search | For a clear view of the events represented in your visualizations, the drill down feature has been transformed to display the events in the Search application.  Search is opened in a new tab with the search bar populated with a query string for viewing the appropriate events. Click Search to view the results.  For related information, see View and Interact with Dashboards. |
July 2023
Feature | Description |
|---|---|
Custom Field Visualizations | Custom fields added to parsers in Log Stream are now available to you in Dashboards for building visualizations. To view custom fields and add them to your visualizations, expand Event: Custom Parser Fields in the Data Field panel of the visualization design view. 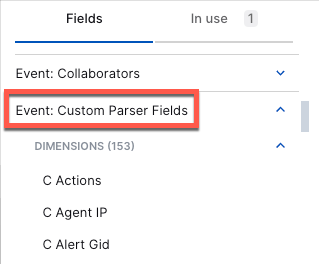 For information on adding fields (dimensions) to your visualizations, see Create a Visualization. NoteNewly created custom fields in Log Stream may take up to 90 minutes to appear in Dashboards. |
CIDR Notation Support on IP Address Filters | IP address filtering has been enhanced to include support for CIDR notation, which enables you to specify ranges of IP addresses for filtering. To enter CIDR blocks in IP filters, select the is in CIDR block(s) or is not in CIDR block(s) operator.  For information on applying filters to your visualizations, see Create a Visualization.. |
June 2023
Feature | Description |
|---|---|
Filtering with Custom Context Tables | In addition to data from threat intelligence services and identity providers, you can now filter your visualizations with data from custom context tables created in Context Collectors.  For information on adding context table filters to your visualizations, see Create a Visualization. |
Introducing Twelve New Pre-Built Dashboards | Twelve new pre-built dashboards are now available: |
May 2023
Feature | Description |
|---|---|
Dashboard Exporting and Importing | You can now export and import your custom and pre-built dashboards as  For more information, see Export and Import Dashboards. |
Introducing 12 New Pre-Built Dashboards | Twelve new pre-built dashboards are now available: |
April 2023
Feature | Description |
|---|---|
Custom Fields with Sum, AVG, Min, and Max Functions | You can now aggregate numeric dimensions (such as Attachment Count and Rule Count) into custom fields by applying the following functions to them: sum, average, minimum, or maximum. These custom fields can be used in your visualizations in the same way as regular fields. 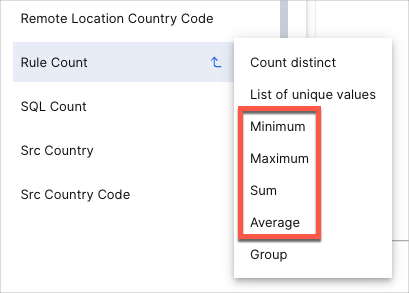 For more information on creating custom fields from a dimension, see step 5 in Create a Visualization. |
Custom Fields with Data Grouping | Data grouping provides another way to create custom fields for your visualizations by enabling you to group different values from a dimension based on specified conditions. For example, if you want a chart to break down email addresses by work and personal addresses, you can do so by creating groups from the Email Address dimension, as shown by the grouping configuration in the following dialog box: 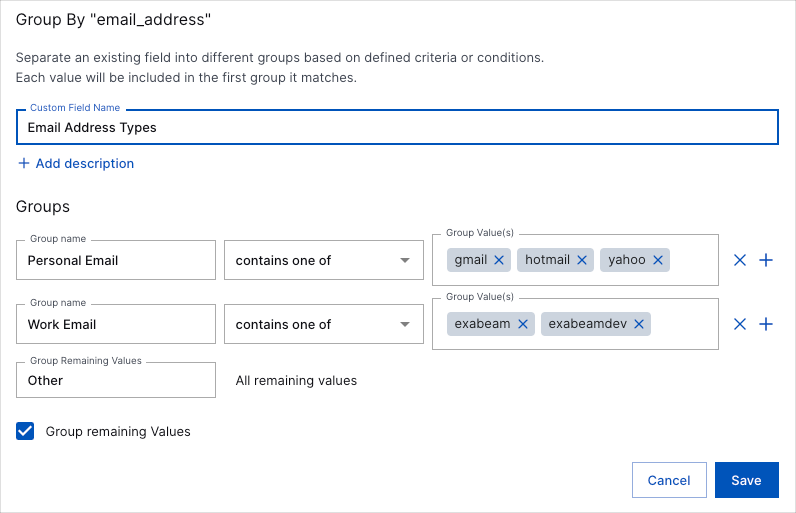 Custom fields based on grouping work well with pie and bar charts. The following is a pie chart representing the groups defined in the previous dialog box: 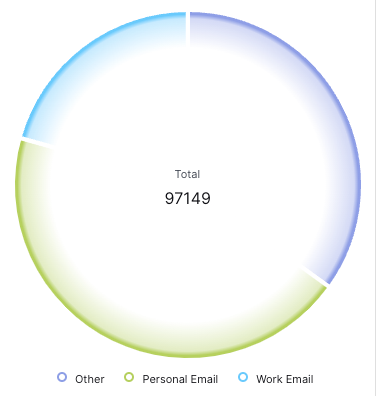 For more information on creating custom fields from a dimension, see step 5 in Create a Visualization. |
Expanded Sorting Options | Visualizations: For additional control over your visualizations, you can now sort their data on any of the columns in the design view. Sorting is especially useful for bar and column charts. Click the heading of the column that you want to sort the data by. Click the arrow icon to change between ascending 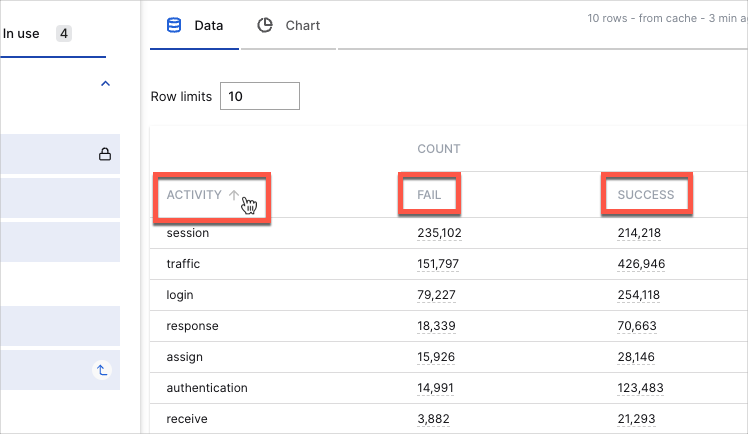 For more information on sorting visualizations, see step 6 in Create a Visualization. Tables: You can now dynamically sort dashboard tables by any of their columns, in either ascending or descending order. To change the sorting in a table, click the heading of the column that you want to sort by. Click the arrow icon to change between ascending 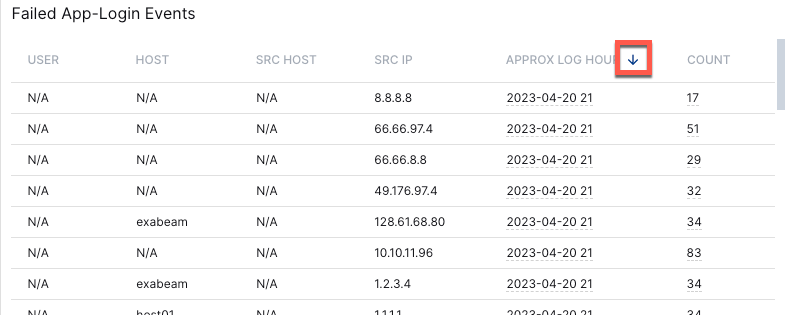 |
Dashboards License Enforcement | Your Dashboards view has been streamlined to include only the customization features and pre-built dashboards supported by your license. To find out if your license supports custom dashboards and view which pre-built dashboards are available to you, see the Visibility section in the Exabeam Security Operations Portfolio Licenses table. |
March 2023
Feature | Description |
|---|---|
Enhanced Dashboard Filter Conditions | You can now create filter groups and combine filter phrases with AND and OR operators, enabling you to build more advanced queries and further refine the data in your visualizations.  For more info, Create a Visualization. |
Context Table Filtering Support | For a better view of the threat landscape, you can now filter your visualizations for matching keys in your context tables.  For more info, see Create a Visualization. |
Introducing Three New Pre-Built Dashboards | Three new pre-built dashboards are now available: |
February 2023
Feature | Description |
|---|---|
Secured Resources Support | Secured Resources is an New-Scale Security Operations Platform role-based tool for enforcing data governance policies by allowing users to access only the data that they need to perform their jobs. To start defining data visibility for your Dashboards user roles, see Secured Resources in the Exabeam Security Operations Platform Administration Guide. |
Introducing Two New Pre-Built Dashboards | Two new pre-built dashboards are now available: |
January 2023
Feature | Description |
|---|---|
Introducing Five New Pre-Built Dashboards | To help you comply with regulatory requirements (CJIS, HIPAA, ISO 27001, NIST, PCI, PMC, SOX, and TSC SOC2), five new pre-built dashboards are now available:
|
Event Store License Enforcement and Filter Updates |
|

