Service Health and Consumption Features Introduced in 2023
November 2023
Feature | Description | |
|---|---|---|
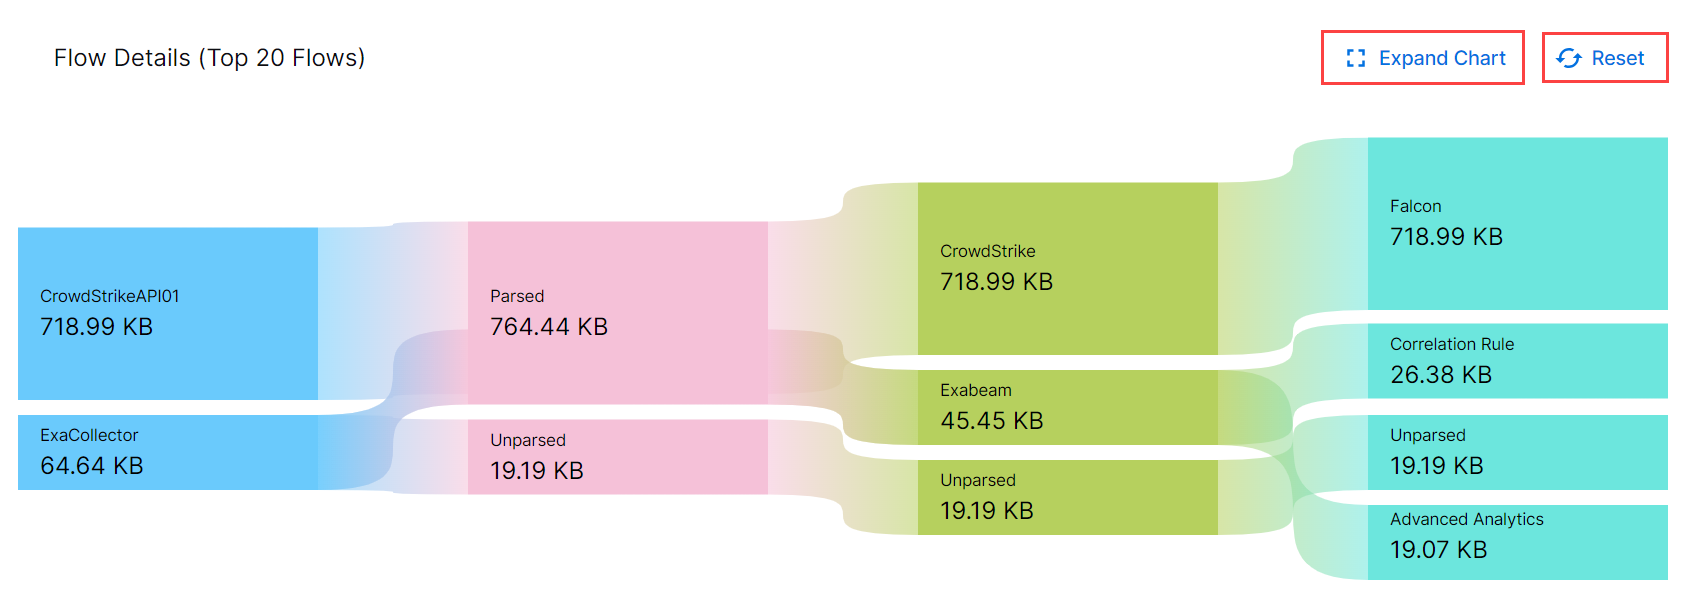
Enhanced Visibility for Sankey Charts | For enhanced visibility and filtering, the Sankey charts on the Consumption Details page now provide you with an Expand Chart option. This allows you to open the flow details in a new full-screen window in which you can filter the chart details based on vendors, products, collectors, and parsing status columns. Using the Reset option you can restore the default chart view and using the Close button you can exit the full-screen window view.
| |
Parsed Event Exploration from Service Health and Consumption | You can now explore additional details for parsed events by pivoting from the Consumption Details page in Service Health and Consumption to Search. On the Consumption Details page, in the Vendor Overview section you can now generate a prepopulated Search query for viewing details of parsed events using the View logs in search option. This routes you to the Search application and automatically applies filters that match the rows in the Vendors Overview section.
| |
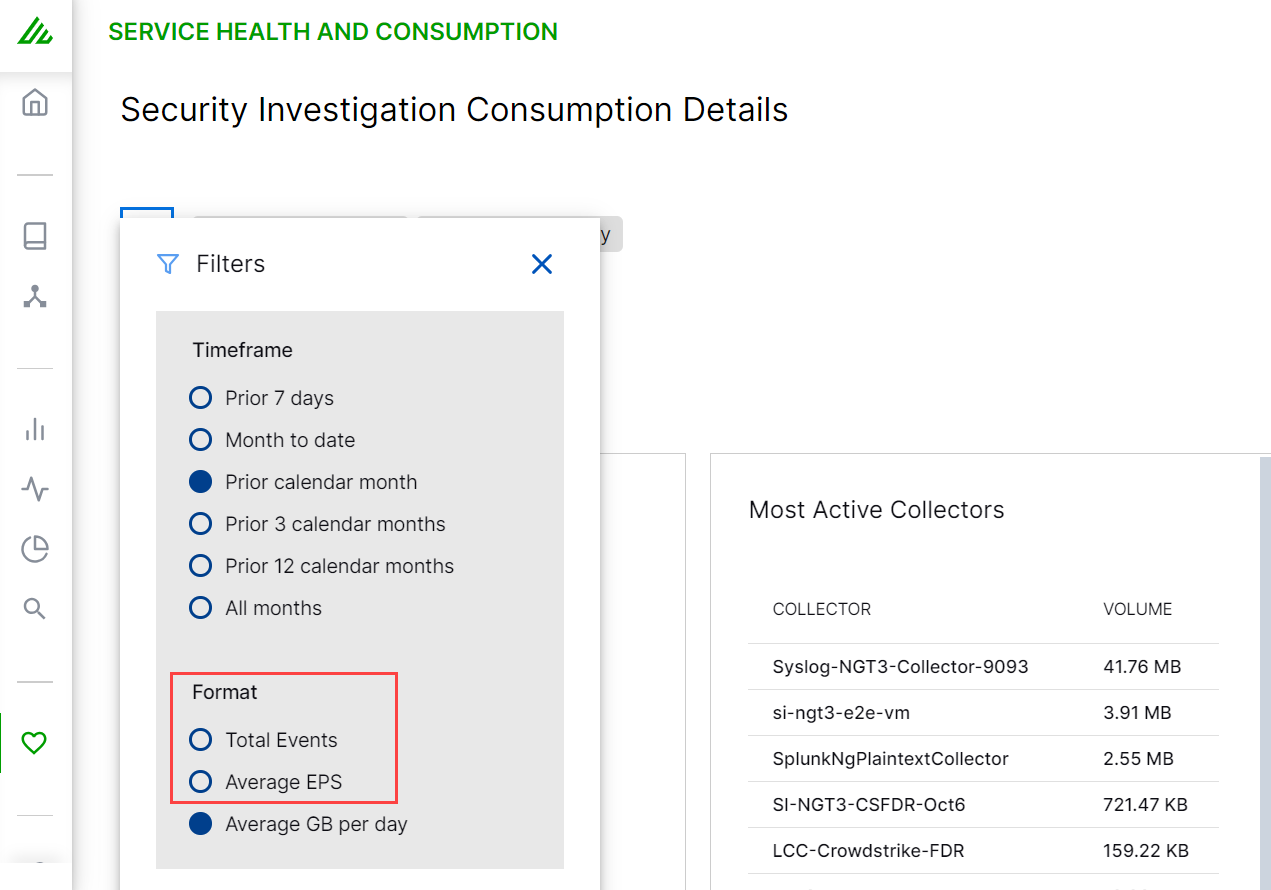
Format Filters for Consumption Details: Total Events and Average EPS | You can now use the Format filters: Total Events and Average EPS for Consumption Details dashboards as applicable.
|
October 2023
Feature | Description | |
|---|---|---|
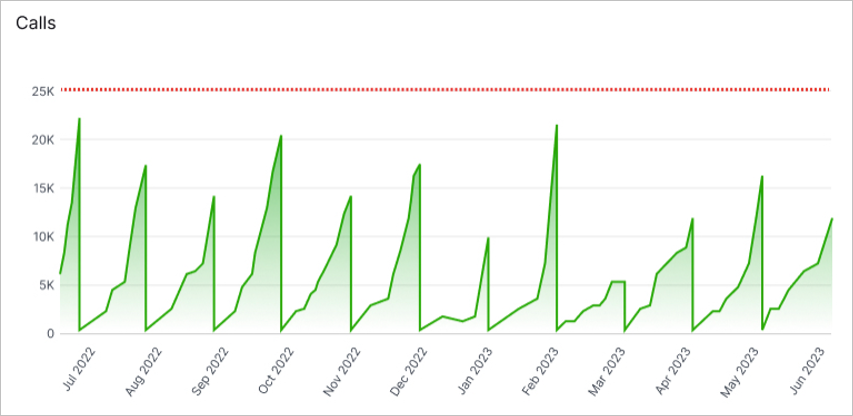
API Consumption Visibility | To provide visibility into your API call data consumption alongside your licensed API data allotment, an API Consumption line chart has been added to the License View page. Use this chart to monitor API consumption trends for potential changes in your data needs.
Also, for additional info on your API consumption, such as your top API endpoints and keys, you can refer to the new API Consumption Details page. | |
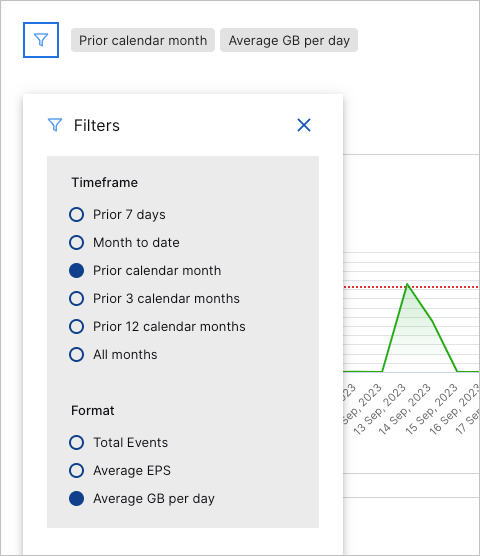
Revised Consumption Filter Timeframes | On the License View page, the filter timeframe options for consumption charts (excluding the Long-Term Consumption chart) have been modified to align with the monthly billing cycle. The updated timeframes will help you better assess your monthly data needs.
|
September 2023
Feature | Description |
|---|---|
Vendor Event Trends | For more insight into the activities of the different vendors and products on your network, you can now view their trends over chosen time frames for total events, average events per second (EPS), and average data volume (in GB) per day. 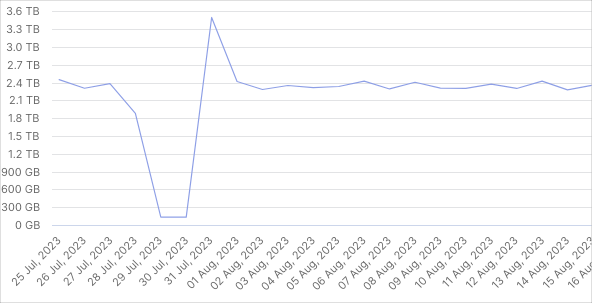 For more information, see Consumption Details. |
Correlation Rule Consumption | On the License View page, a tile has been added for you to monitor the number of correlation rules that you have enabled out of the total number of correlation rules available. 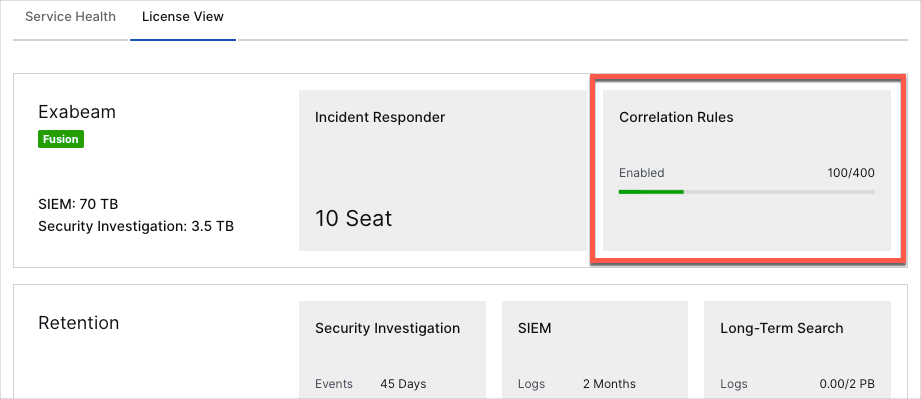 |
August 2023
Feature | Description | |
|---|---|---|
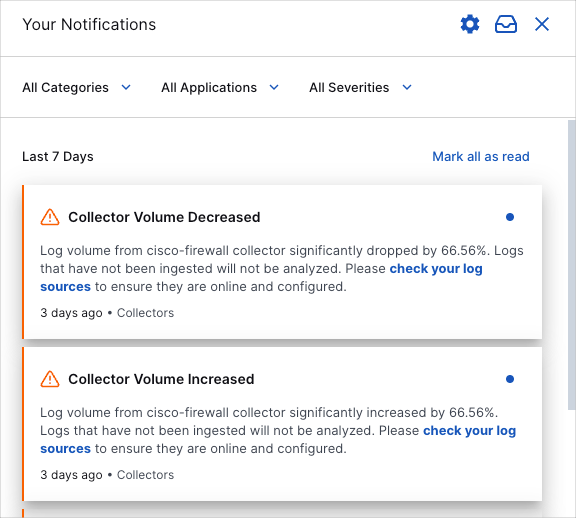
Significant Collector Increase and Decrease Notifications | To keep you informed about the health and configuration needs of the individual collectors in your system, in-app and email notifications are now available to alert you when there are significant increases and decreases in collector log volumes.
For more information, see Significant Collector Increase and Decrease Notifications. | |
Context Management Health Charts | You can now monitor the overall processing health of your context tables from the Processing Health Details page. In addition, you can monitor the health of your Context Management service from the Applications Health Details page.  |
June 2023
Feature | Description |
|---|---|
StatusPage History of Past Outages and Incidents | On the Applications Health Details page, you can now gain insights into past application performance issues via StatusPage report integration. If you find a past health issue on an application's uptime graph (as indicated by a yellow or red bar), click the bar to open the Incident Details pop-up window, where you can view the time length of the outage and access links to the relevant StatusPage incident reports. 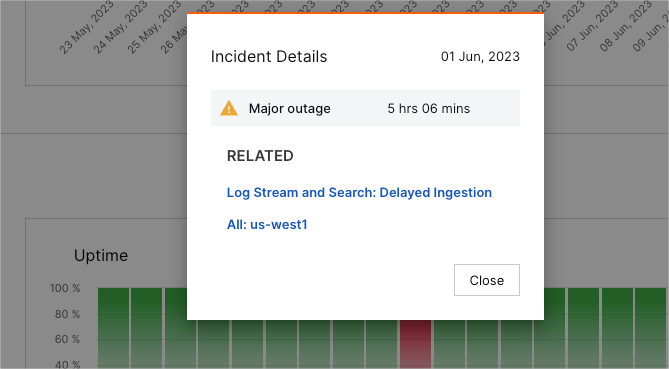 For more information, see Applications Health Details. |
May 2023
Feature | Description |
|---|---|
Long-Term Search Consumption Trends | To help you manage your Long-Term Search retention needs, you can now monitor your Long-Term Search consumption trends. View the column chart to track the volume of data being consumed and purged each day and compare the volume of consumed data with the amount of purchased data available. You can also use the global retention setting to adjust the length of time that data is retained. 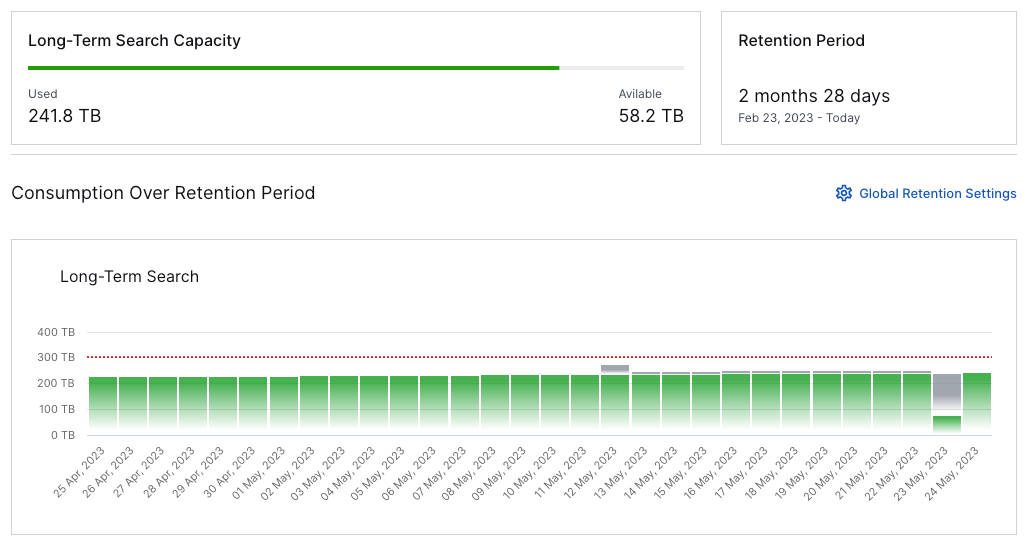 For more information, see License View in the Service Health and Consumption Guide. |
April 2023
Feature | Description |
|---|---|
New Health Alerts with Status Links | If health issues arise in your Exabeam deployment, you will now receive a notifications on the Service Health page with links to the relevant status pages for the issues you are experiencing.  If a health issue has been detected within your deployment, the notification includes a My Status link that directs you to a status page with details on your issue(s). If your deployment is affected by known regional issues, the notification includes a Global Status link that directs you to a Status.io page to keep you informed of outages and maintenance activities. |
March 2023
Feature | Description |
|---|---|
New Data Formats for Consumption Details | In addition to viewing consumption details data in the Average GB per day format, you can now view the Total Events and Average EPS (events per second). 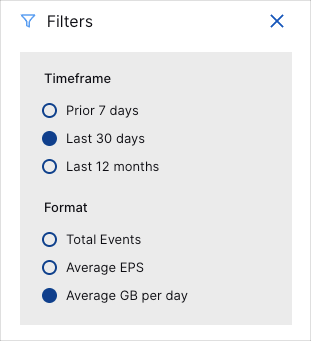 For information on changing between formats, see Consumption Details in the Service Health and Consumption guide. |
Export Consumption Details Data | You can now export the data in the consumption details table to a CSV file. For more info, see Consumption Details in the Service Health and Consumption guide. 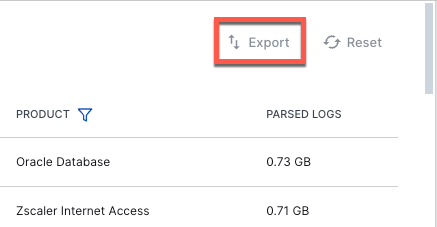 |

