- Service Health and Consumption Overview
- Service Health
- License View
- Notifications and Alerts
Consumption Details
The Service Health and Consumption app provides detailed information to help you monitor the amount of data consumed by your Exabeam products. To view consumption details, open the License View tab and then click the More <product> Health Details for the product that you want to investigate. The consumption details page displays the average amount of data ingested per day, and further breaks down the data by collectors and vendors.
Timeframe and Format Filters
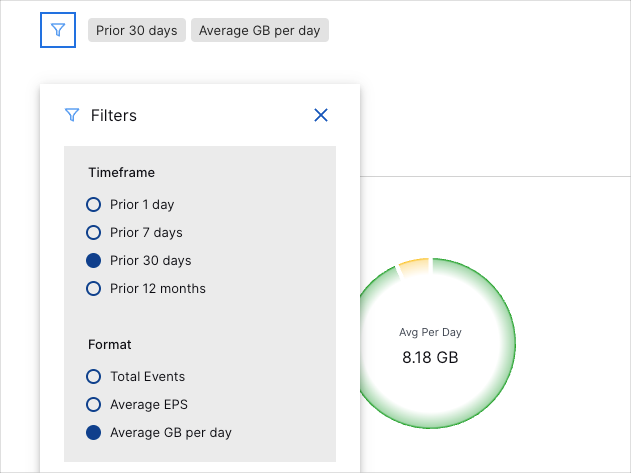
Consumption details dashboards include a timeframe filter that applies to all charts on the dashboard. The following timeframe settings are available:
Prior 1 day: This option displays data from the previous day (12:00 AM to 11:59 AM UTC).
Prior 7 days – Displays data from the previous seven days. For example, if you were viewing the dashboards on July 8th, you would see data from July 1st through July 7th. Dates are based on UTC time.
Prior 30 days: Displays data from the previous 30 days. For example, if you were viewing the dashboards on March 31st, you would see data from March 1st through March 30th. Dates are based on UTC time.
Prior 12 calendar months – Displays monthly data totals (or average EPS or GB per day if applicable) from the last 12 calendar months. For example, if you were viewing the dashboards during the month of October 2023, this option would display data from October 2022 through September 2023.
In addition to the timeframe settings, you can select from the following data formats:
Total Events
Average EPS (events per second)
Average GB per day
The default filter settings are Last 30 days. and Average GB per day. To change the settings, on the upper-left side of the dashboard, click the filter icon and then select from the Timeframe and Format options as needed.
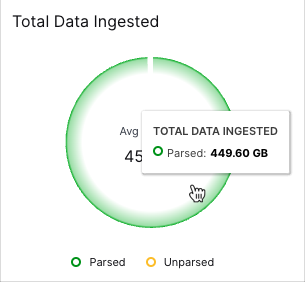
Total Data Ingested
This pie chart displays the average amount of data ingested per day and visualizes the amount that is parsed and unparsed. To see the actual values represented in the chart, move your pointer over the slices.
Most Active Collectors
This table lists your most active collectors by data ingestion volume.
Most Active Vendors
This table lists the most active vendors by volume of received data.
Flow Details (Top 20 Flows)
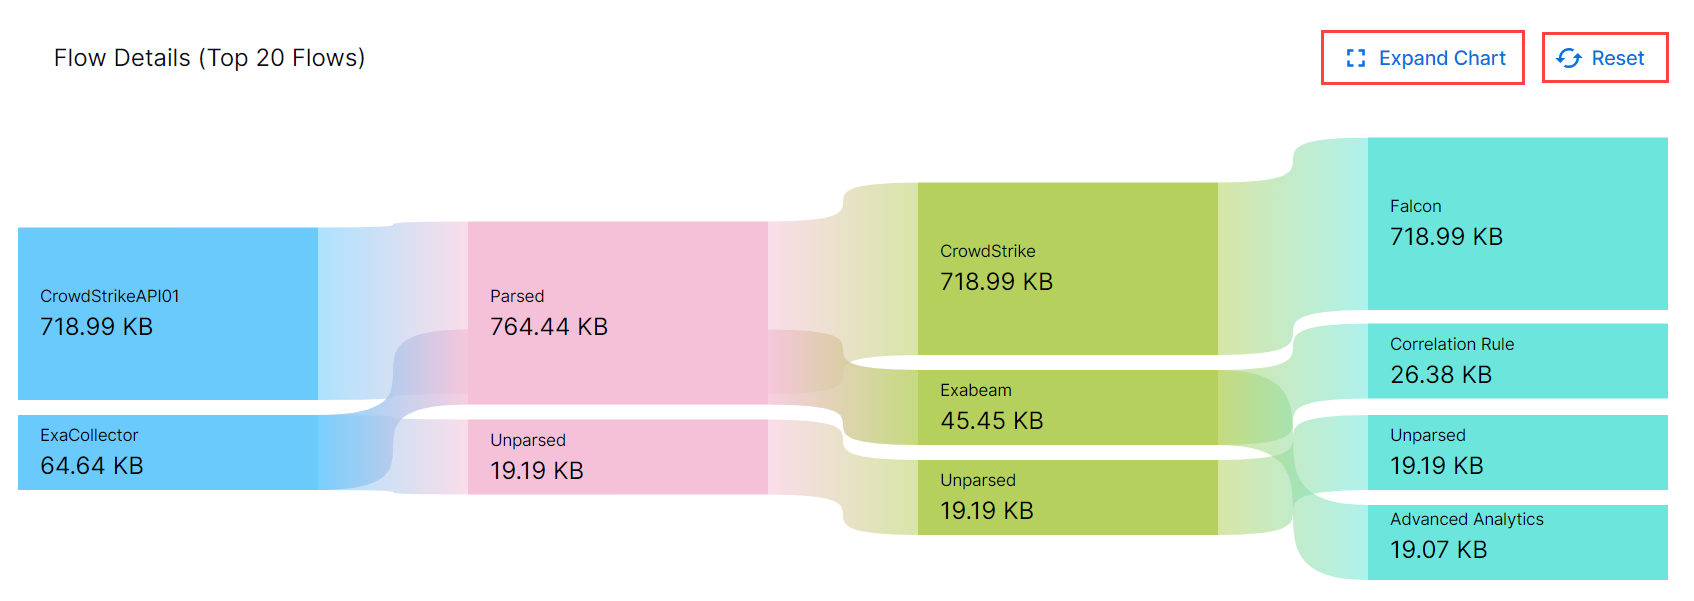
This Sankey chart represents the average daily data ingestion from the top 20 log sources, and the processing flow of the parsed and unparsed data to the appropriate vendors and vendor products. Move your pointer over the chart to highlight the processing flows.
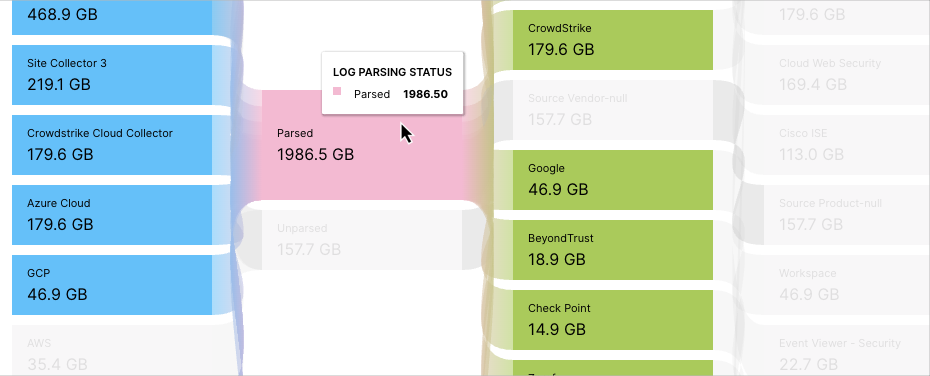 |
To view the flow details in an expanded full-screen window, click Expand Chart. In the expanded view, you can filter the Sankey chart details based on vendors, products, collectors, and parsing status columns by clicking the columns. To restore the chart to its default view, click Reset. To exit the full-screen window, click the close icon.
Vendors Overview
The Vendors Overview provides basic information on the vendor data collected by Exabeam. For more insight into the activity of vendors and their products, you can view their ingestion trends for total events, average events per second (EPS), and average data volume (in GB) per day.
For more information, see the following topics:
View Vendor Trends
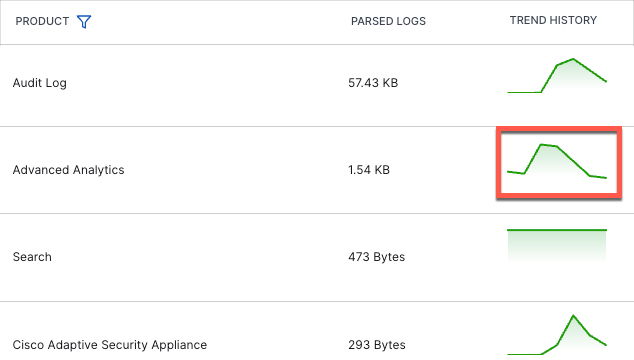
For each product, the Service Health and Consumption app provides a sparkline graph of data consumption over time.
From the Service Health and Consumption app, select SIEM Consumption Details > License View > SIEM Consumption Details.
Scroll to the Vendors Overview section.
In the Vendors Overview table, click the Trend History graph for the vendor that you want to view.
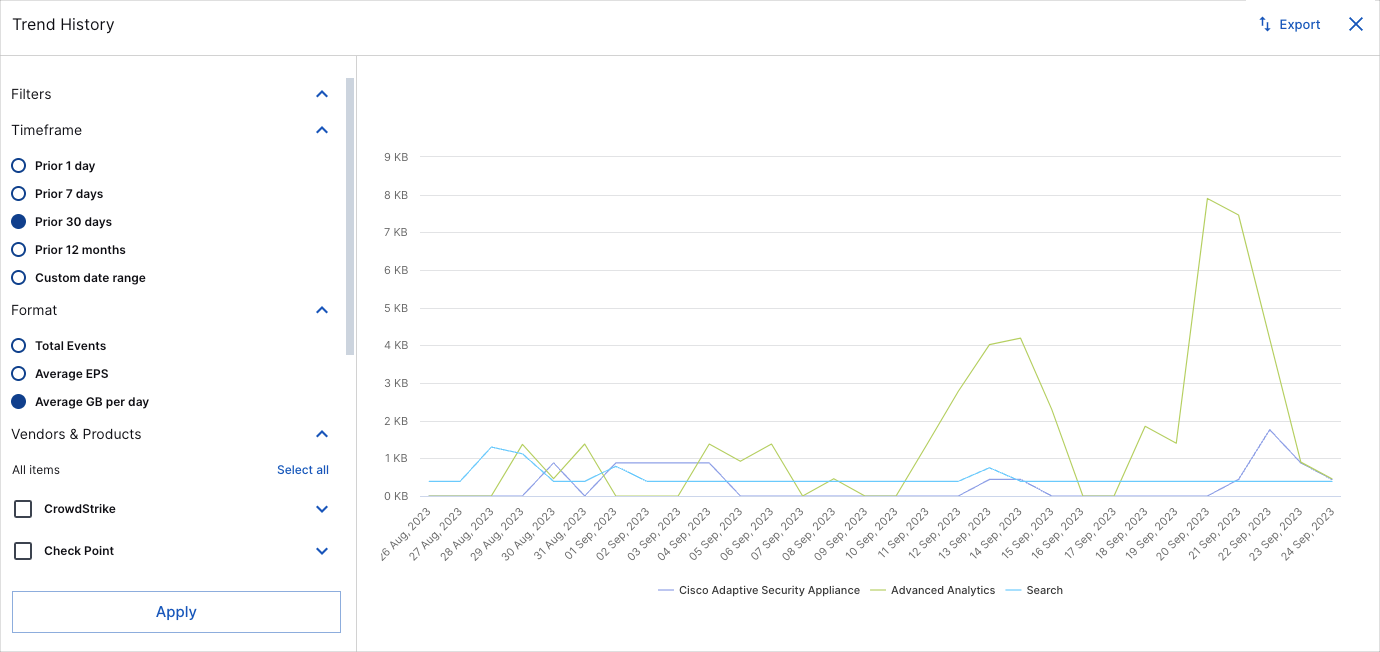
The Trend History window opens.
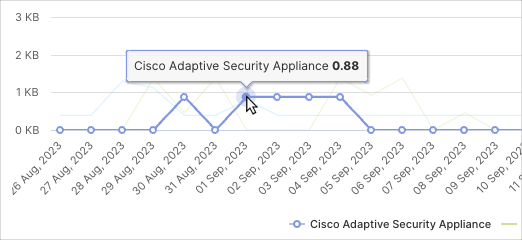
To view significant data points in the trend graph, move your pointer over the graph lines and hover on the data points.
(Optional) To reconfigure the chart filters, do any of the following and then Apply your changes:
To view the available Filters (Timeframe and Format) and Vendors & Products filter options, click the expand icons
 .
.Select a different Timeframe and/or Format.
To view the trends of additional vendors, select the checkboxes for the vendors that you want to add to the chart.
To add or remove individual vendor products from the chart, select the vendor's expand icon
 and then select or clear the product checkboxes.
(Optional) To export the data in the Trend History chart to a CSV file, click Export.
Filter the Vendors
If needed, you can filter the results for specific vendors.
Click the filter icon
 for the column that you want to filter
Select the dimensions that you want to include in the data results.
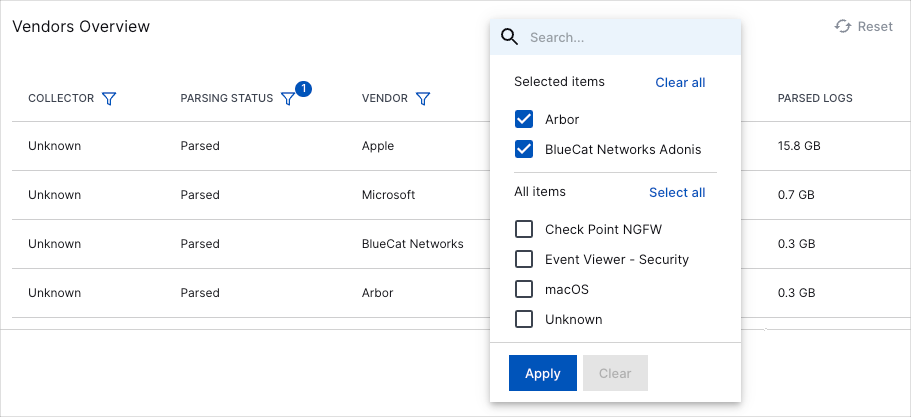
Click Apply.
Note
To remove all filters from the table, click Reset.
Export Vendor Information
If needed, you can export vendor information from the Service Health and Consumption app in comma-separated values (CSV) format.
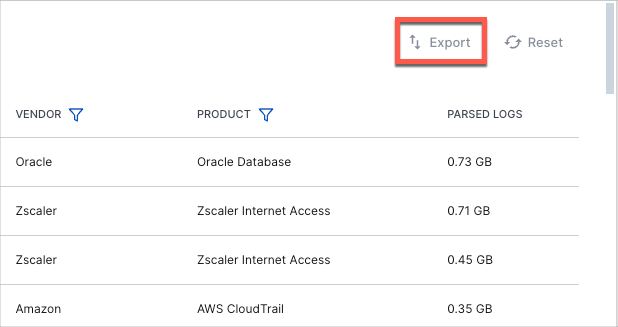
From the top of the table, click Export.
View Logs in Search
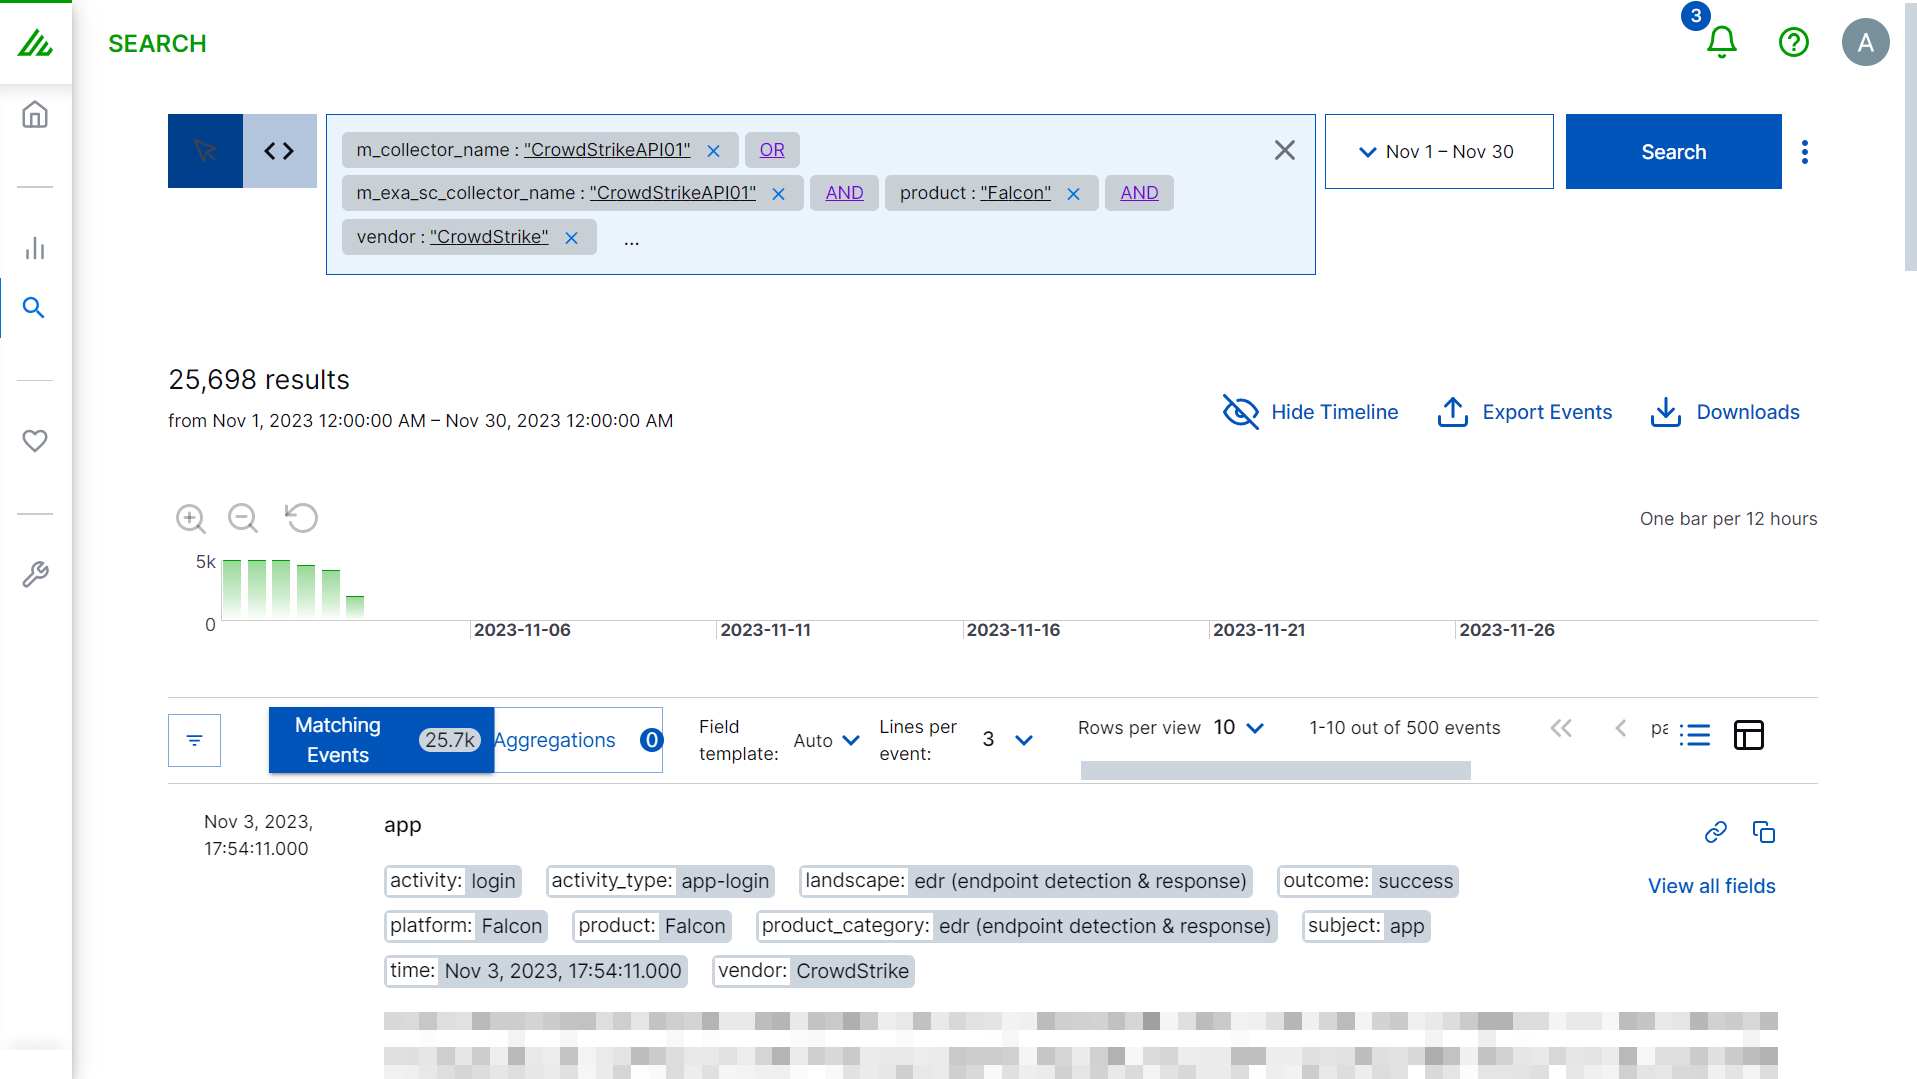
To view details of parsed and unparsed logs for a collector instance, in the Vendors Overview section, by clicking View logs in search, you can pivot from consumption details dashboards to filtered search in Search application.

After you click View Logs in Search, the filters for vendor, product, and collector name are automatically applied for the given timeframe in the prepopulated Search query. To view the log details, click Search. For the collector instance that you selected, the Search application displays details of :
parsed and unparsed events for the SIEM Consumption Details dashboard.
parsed events for the Security Investigation Consumption Details dashboard.
