- Service Health and Consumption Overview
- Service Health
- License View
- Notifications and Alerts
Applications Health Details
To view current and recent health information on the different applications in your deployment, open the Service Health tab, and then, above the Applications Uptime chart, click Applications Health Details. If an application's health chart indicates that service has been impacted at any point, you can access the corresponding Status Page incident reports for insights into what happened.
 |
Time Range Filter

The Applications Health Details dashboard has a time range filter that applies to all charts on the page. The filter's default setting is last 30 days. The following filter settings are available:
Prior 1 day: This option displays data from the previous day (12:00 AM to 11:59 AM UTC).
Prior 30 days: Displays data from the previous 30 days. For example, if you were viewing the dashboards on March 31st, you would see data from March 1st through March 30th. Dates are based on UTC time.
To change the filter setting, on the upper-left side of the dashboard, click the filter icon and select a timeframe from the menu.
Total Uptimes

The single value bar charts show the average uptime over the selected time range for the different applications. Green graph bars indicate that services were running OK during their time periods. If services have been impacted, the graph turns red; when service impacts are minor, the graph turns yellow. You can see when the health issues occurred in the Uptime column chart to the right (see Uptime Trends).
Uptime Trends

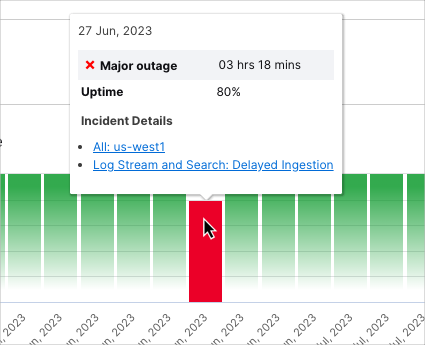
The Uptime bar charts display the rise and fall of application uptimes over the selected time range. For major service outages, the graph bars turn red; for partial outages, the graph bars turn yellow. From the chart timeline you can determine if there are current issues that needs to be addressed, or if there have been previous issues. If there are previous issues, you can access the StatusPage incident reports on them for insights into what happened.
To access the StatusPage report(s) for a health issue (as indicated by a yellow or red graph bar), click the bar to open the Incident Details pop-up window. From this window you can view the time length of the outage and the headings of the related incident reports. To view a report in its entirety in a new browser tab, click the heading link.
