- Exabeam Data Lake Architecture Overview
- Exabeam Product Deployment in On-premises or Virtual Environments
- Administrator Operations
- User Management
- Exabeam Data Lake Role-based Access Control
- Exabeam Data Lake Object-based Access Control
- Exabeam Data Lake Secured Resources Overview
- Third-Party Identity Provider Configuration
- Audit Log Management in Data Lake
- Common Access Card (CAC) Authentication
- Set Up LDAP Server
- Set Up LDAP Authentication
- Azure AD Context Enrichment
- Adding a User to Exabeam Data Lake
- User Password Policies
- User Engagement Analytics Policy
- Exabeam Threat Intelligence Service
- Threat Intelligence Service Prerequisites
- Connect to Threat Intelligence Service through a Proxy
- View Threat Intelligence Feeds
- Threat Intelligence Context Tables
- View Threat Intelligence Context Tables
- Assign a Threat Intelligence Feed to a New Context Table
- Create a New Context Table from a Threat Intelligence Feed
- Using Threat Intelligence Service with Data Lake
- Check ExaCloud Connector Service Health Status
- Index Management
- Parser Management
- Forwarding to Other Destinations
- Syslog Forwarding Management in Exabeam Data Lake
- Syslog Forwarding Destinations
- Configure Log Forwarding Rate
- How to Forward Syslog to Exabeam Advanced Analytics from Exabeam Data Lake
- How to Forward Syslog from Exabeam Data Lake to Non-Exabeam External Destinations
- Exabeam Data Lake Selective Forwarding using Conditions
- How to Configure Exabeam Data Lake Log Destinations for Correlation Rule Outcomes
- Forward Exabeam Data Lake Incident to Exabeam Incident Responder
- Syslog Forwarding Management in Exabeam Data Lake
- Cluster Operations
- Cross-cluster Search in Exabeam Data Lake
- Prerequisites for Exabeam Data Lake Cross-cluster Search
- Remote Cluster Management for Exabeam Data Lake Cross-cluster Search
- Register a Remote Cluster in Exabeam Data Lake for Cross-cluster Search
- Exabeam Data Lake Cross-cluster Health Monitoring and Handling
- How to Enable/Disable/Delete Exabeam Data Lake Remote Clusters for Cross-cluster Search
- Exabeam Data Lake Remote Cluster Data Access Permissions for Cross-cluster Search
- System Health Page
- A. Technical Support Information
- B. List of Exabeam Services
- C. Network Ports
- D. Supported Browsers
System Health Page
System Health can be used to check the status of critical functionality across your Data Lake system. Navigate to the System Health page from the Settings tab at the top right corner of any page. System Health monitors various back-end processes of Data Lake and assists Exabeam engineers with troubleshooting. Graphs and tables on the page visually represent the health status for all of the key systems, as well as indexes and the appliance, so you are always able to check statuses at a glance and track health over time.
Proactive and On-Demand System Health Checks
System Health is used to check the status of critical functionality across your system and assists Exabeam engineers with troubleshooting. Exabeam provides visibility on the backend data pipeline via Health Checks. Graphs and tables on the page visually represent the health status for all of the key systems, as well as indexes and the appliance, so you are always able to check statuses at a glance and track health over time.
Proactive health checks run automatically and periodically in the background.
On-demand health checks can be initiated manually and are run immediately. All newly gathered health check statuses and data is updated in the information panes on the page. All proactive and on-demand health checks are listed on the Health Checks page. Proactive health checks are visible by any user in your organization. Only users with administrator permission can reach the page.
 |
When a health check is triggered, a notification message is displayed in the upper right corner of the UI. Select the alert icon to open a side panel that lists the alerts and provides additional detail. A panel listing all notifications is expanded.
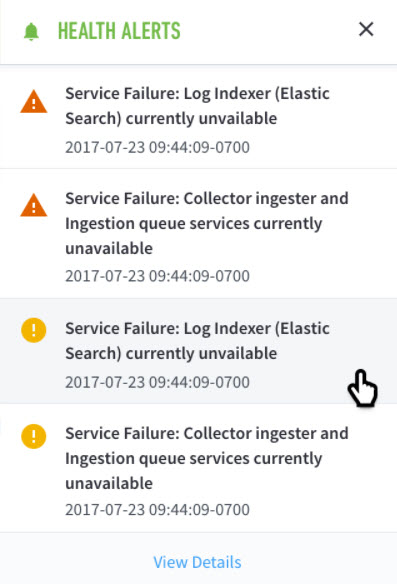 |
These alerts are also listed under the Health Alerts tab in the System Health page. In general:
Warning: There is an issue that should be brought to the attention of the user.
Critical: Immediate action is recommended. In all cases, if an alert is raised on your system, please contact Exabeam Customer Success.
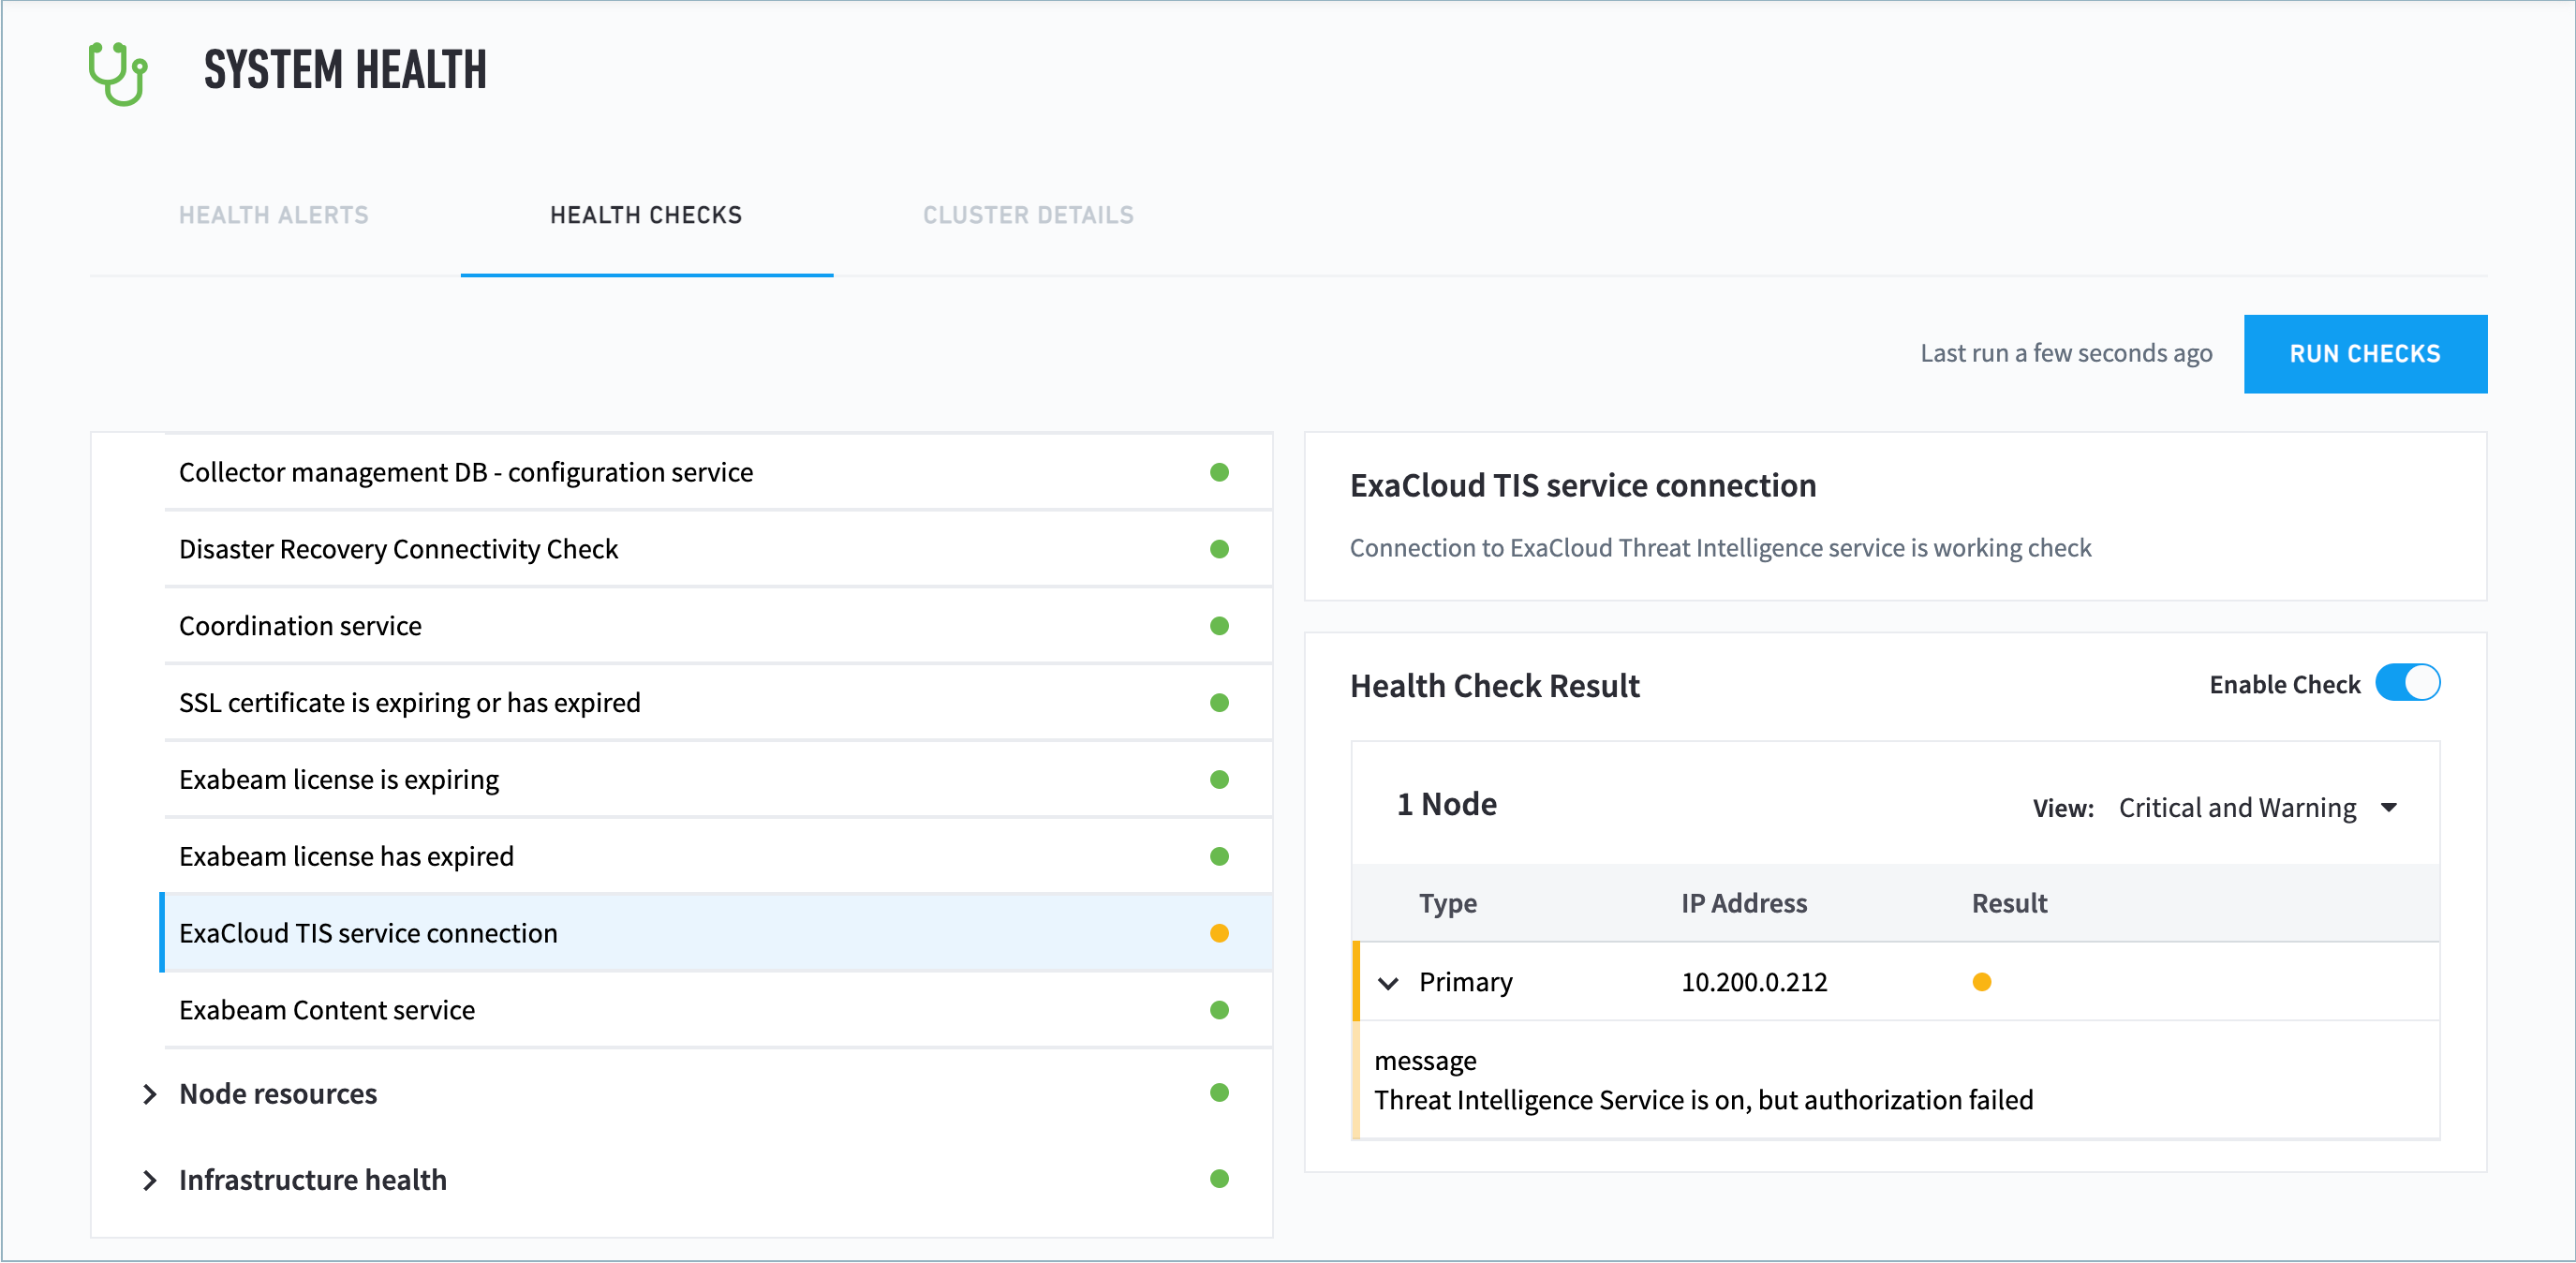
To reach the Health Checks page, navigate to the System Health page from the Settings tab at the top right corner of any page, then select the Health Checks tab.
Health check categories are:
Service Availability – License expiration, database, disaster recovery, Web Common application engine, directory service, aggregators, and external connections
Node Resources – Load, performance, and retention capacity
Service Availability (Incident Processors and Repositories) - IR, Hadoop, and Kafka performance metrics
Data Lake Specific Health Checks
Service Availability (Context Processors and Repositories) - API server, connectors, and collectors
Log storage - Log repository health and utilization
Ingestion Limit - Ingestion queue health and performance
Data Lake Archive - Archive health
Data Lake Migrations - Migration task status
Data Lake Index creation - Last index creation task status
Data Lake Index merge - Merge task status
Data Lake Log Forwarding - Log forwarding task health
Data Lake Index Reindex - Reindex task status and performance
 |
How to Configure System Health Alert Notifications
System health alert notifications can be configured for delivery to recipients via email or Syslog.
Navigate to the Settings > Notifications > Setup Notifications. This will be where all of your email and Syslog notifications are listed. If you have not yet set up any notifications, this page will be empty. This is where you can configure health alerts to be sent via Email and/or Syslog. You can set up the details of the SMTP server for email notifications and Syslog destination server for alerts to be sent via Syslog.
Data Lake Cluster Health Status
There are components unique to Data Lake that impact health status of clusters overall. It is important to distinguish which part is involved in Data Lake's performance. Health statuses indicate:
Status Color | State | Interface Services | Ingestion | Storage |
|---|---|---|---|---|
Green | Healthy | All services performing as expected:
| Ingestion lag is lesss than 30 minute | No significant performance issue |
Yellow | Operational with degraded performance | All services operational with minor performance impact | Ingestion lag is greater than 30 minutes | No significant performance issue |
Red | Severely degraded performance | One or more service is not operating | Ingestion lag is more than 60 minutes and less than 50% of incoming events per second (EPS) is processed | Storage performance is impacted |
Note
To further protect Data Lake performance, Exabeam implemented circuit breakers to quash excessively heavy queries. For example, a query that returns billions of results does not reflect a useful search. Circuit breakers would be tripped to cancel such a query to avoid it from drawing Data Lake resources.
How to View Exabeam Data Lake Cluster Status
Elasticsearch is the data repository engine in Data Lake . Exabeam provides specific monitoring to its inner workings to assist you with optimization and determining when and how to apply preventive measures.
The Cluster Status breaks down the shard status in each Data Lake cluster and will tell you if the cluster is re-balancing. If the number of unassigned shards is increasing or constant, then the status will likely be a yellow warning.
You can view the health of your data repositories by navigating to Settings > System Health > Cluster Details.
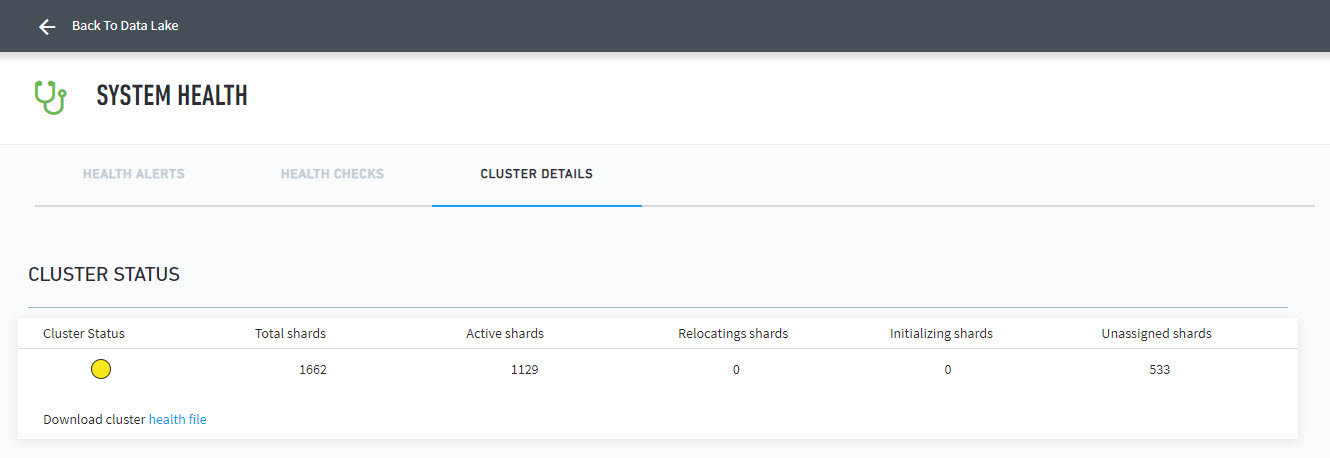 |
The status is indicated with the following:
Good = Healthy condition
Warning = There is an issue that should be brought to the attention of the user.
Critical = Immediate action is recommended.
Scroll down the Cluster Details page to view ElasticSearch status and information.
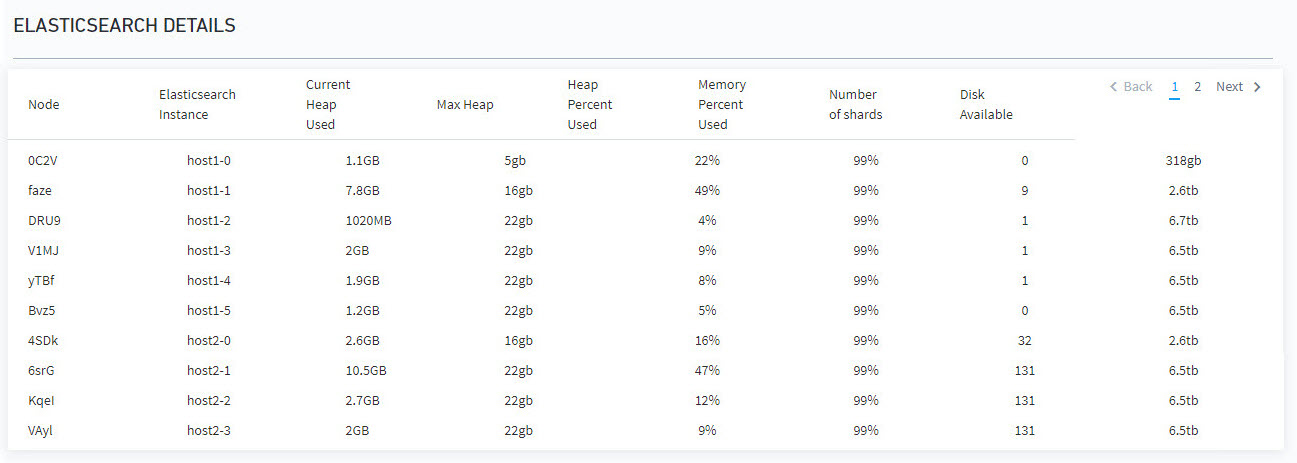
Cluster Details
This table breaks down the memory and number of shards per node. The percentage of memory used here is an important metric and should not go higher than 80%. This will also tells you if there are too many shards in the cluster.
 |
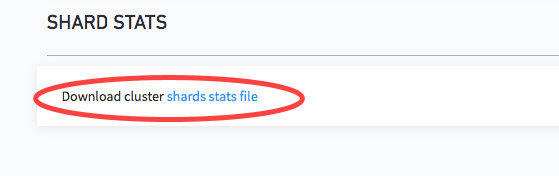
Shard Stats
Statistical information for shards in your clusters can outputted to a file for further examination. Go to the Shard Stats panel and then click shard stats file to export a shards information file.
 |
Get to Know the Exabeam Data Lake Indexing Metrics Tab
The status of indexes reflects the health of data ingestion for your clusters. You can reach the Indexing Metric tab by navigating to Settings > System Health > Indexing Metrics.
The Indexing Metrics tab is broken into three sections:
Data Lake Flow
The Log Ingestor consumes events from the log collectors as well as any syslog data sent from other sources. The Log Ingestor provides flow control and pushes the logs to the Log Indexer.
The Ingestion Rate shows the number of logs being added to the processing queue per second (logs coming into the platform).
The Processing Lag shows the total number of logs waiting to be processed.
The Processing Rate shows the number of logs being processed each second.
The Indexer is a component of the Log Processor and is the piece that is responsible for parsing and enriching before indexing and storing the logs in a distributed search cluster.
At the top right you can select the time-frame over which you want to see the metrics. The below example shows the metrics for the past 15 minutes.
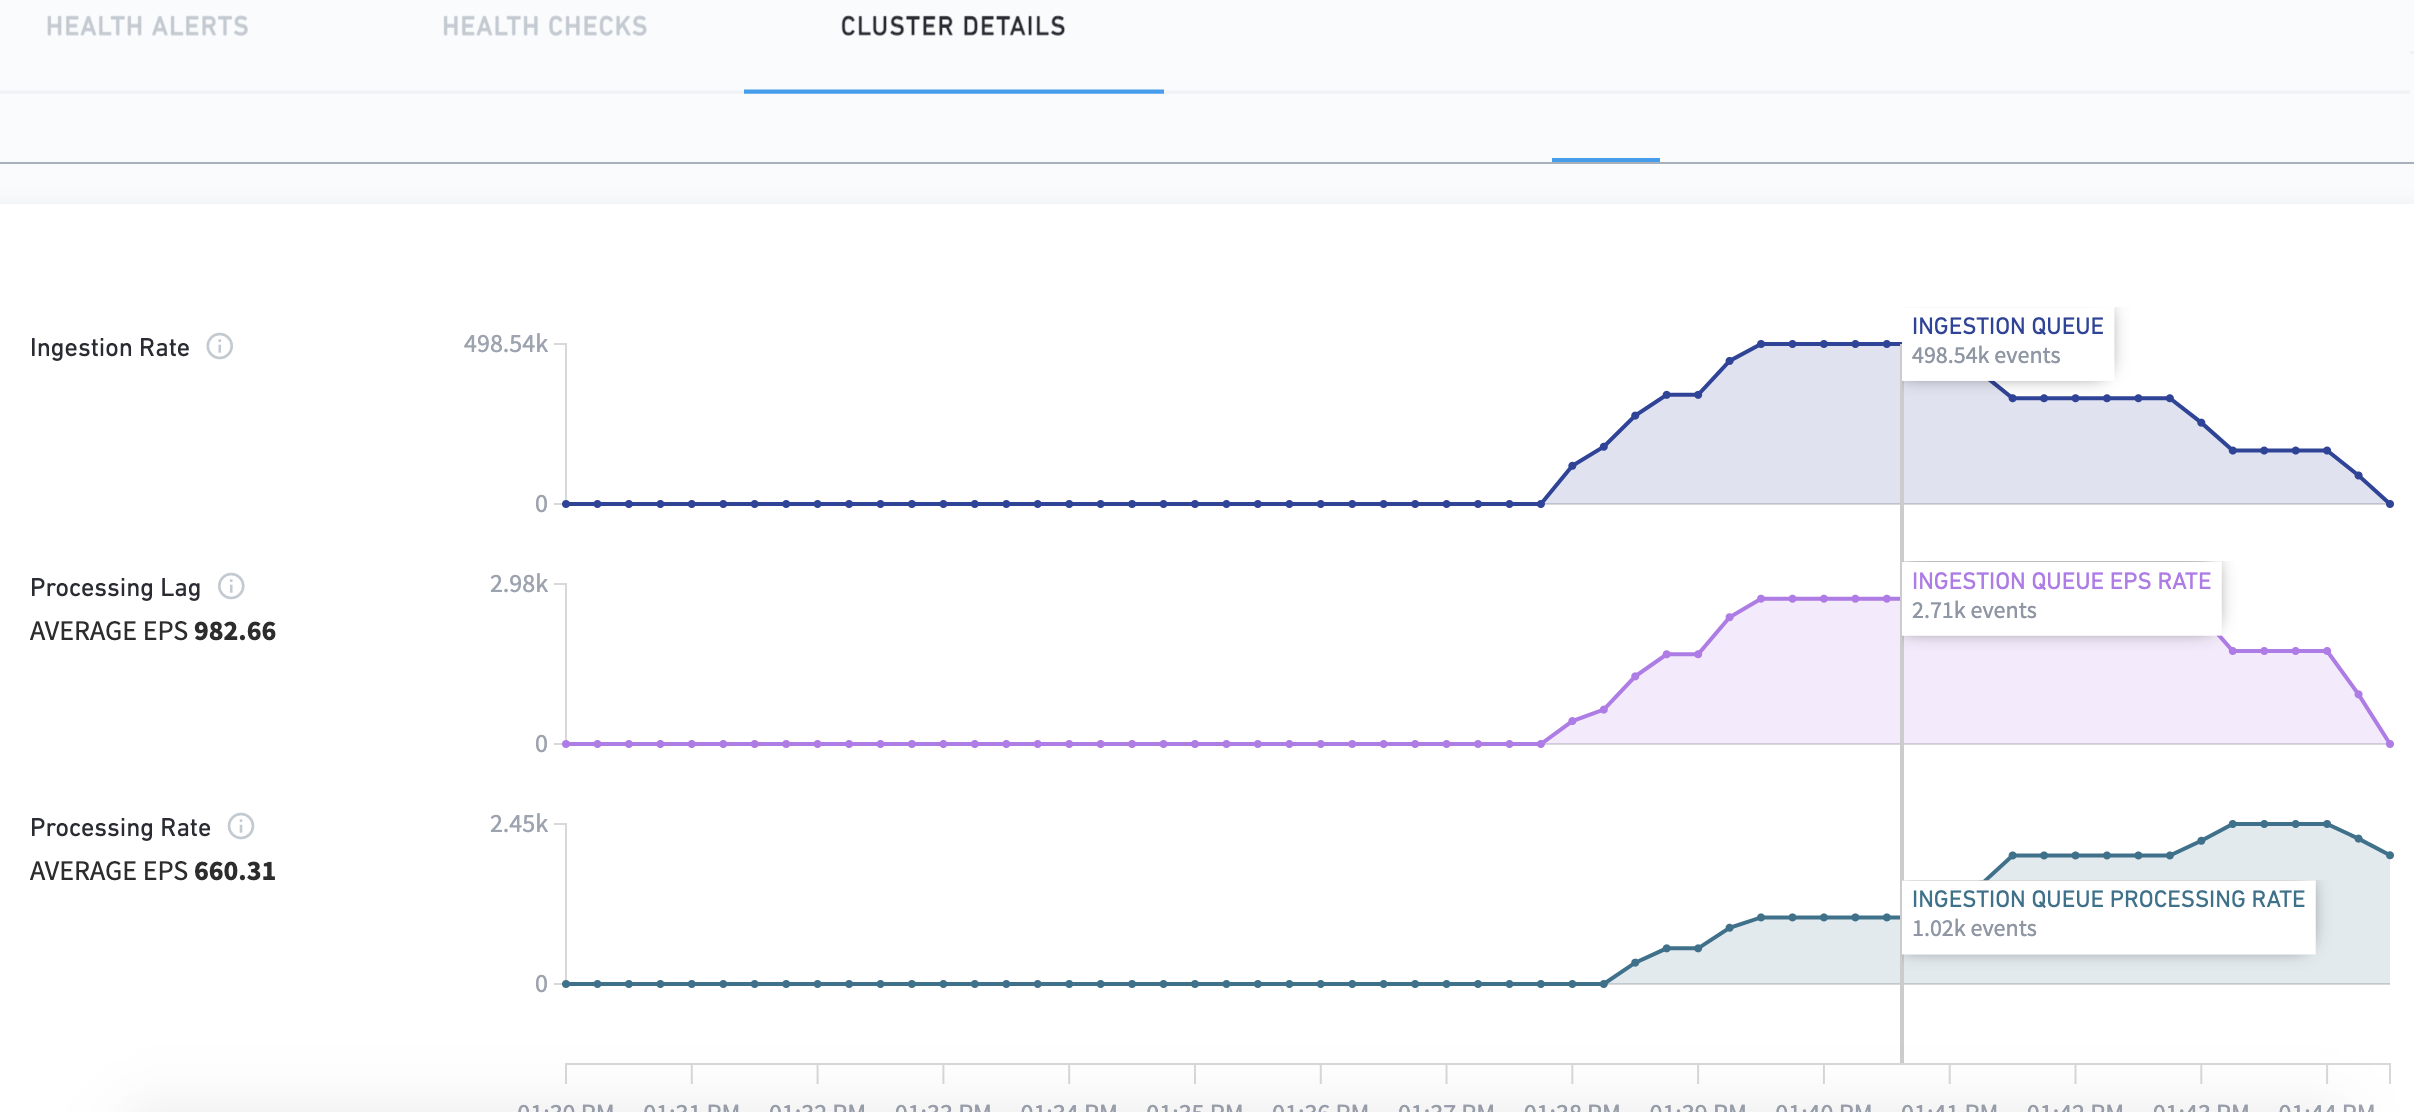
If you hover over the graph with your mouse, a line indicating a 1 minute interval appears. This reflects the number of events for each system within that minute.
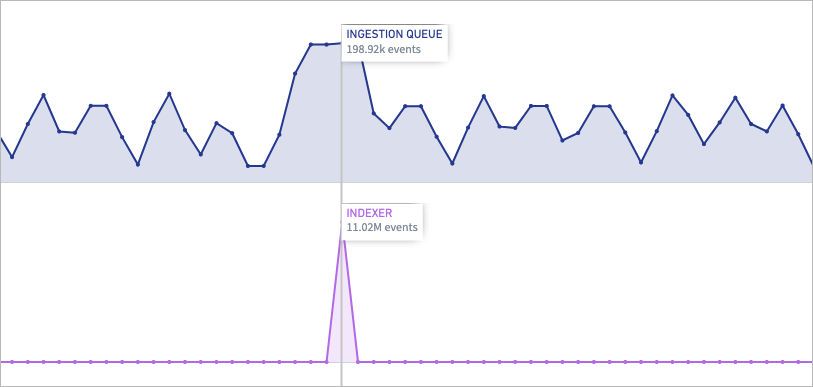 |
Note
There is a 2-4 minute delay in plotting events to the ingestion queue.
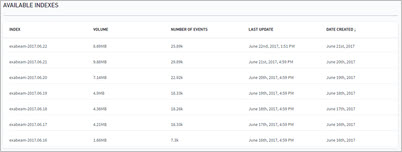
Available Indexes
Logs are stored in a distributed search cluster and indexed for many types of searches. These can be structured, unstructured, geographic, metric, etc. in real-time. Data Lake stores all of the logs for each day in separate indexes, as indicated by the date in the name.
Under the Available Indexes section are lists all of the system's indexes along with the date that index was created, the volume of data contained in that index, the number of events in that index, and when the Volume and Event data was last updated.
 |
Note
The Volume field displays the compressed index size on disk for storage planning. This differs from the total consumption of daily ingested logs used for billing.
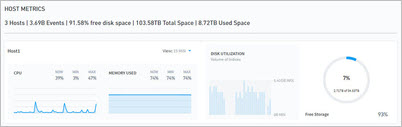
Host Metrics
The Host Metrics panel shows the disk metrics of each host, including CPU, memory usage, used and available Storage. You can view CPU and memory usage over time by changing the View at the top right of the panel.
 |