- Log Stream Overview
- Parser Manager
- Parsers Overview
- View Parser Details
- Create a Custom Parser
- Import Sample Logs
- Define a Subset of the Sample Logs
- Add Conditions
- Add Basic Parser Information
- Extract Event Fields
- Extract Mapped JSON Fields
- Select JSON Fields from a List of Key/Value Pairs
- Select Tokenized JSON Fields from the Values in the Sample Log
- Manually Enter JSON Path Expressions
- Reorder Mapped JSON Fields
- Review the Matching JSON Fields and Values
- Add Logic to JSON Field Extraction
- Expressions for Parser Field Extractions and Enrichment Mapping
- Array Log Sample
- Extract Fields Using Regular Expressions
- Reserved Fields
- Extract Mapped JSON Fields
- Add Event Builder Rules
- Review and Save Parser
- Manage Existing Custom Parsers
- Tokenize Non-Standard Log Files
- Customize a Default Parser
- Duplicate a Parser
- Enable or Disable Parsers
- Parser Updates
- Live Tail
- Enrichments
- Event Filtering
Event Filtering
Note
License Requirement
Currently, the Event Filtering tab is available only if you have the New-Scale Analytics license.
The Event Filtering tab in the Log Stream application provides access to filter which events you want to route to the New-Scale Analytics detection engine or to the Attack Surface Insights application. Events are consumed by various downstream services and applications based on a set of defined detection rules. But in some cases, it can be beneficial to more finely tune which events or types of data are leveraged for detection or for Attack Surface Insights. This type of filtering can reduce the cost of processing events that have no security value, reduce the number of false positives, and reduce the generation of unnecessary alerts.
Event filtering is based on the enrichment rule framework. Two default enrichment rules are provided that tag ingested events based on the filtering parameters defined on the Event Filtering tab. To find these enrichment rules, navigate to the Enrichments tab in Log Stream. In the table of enrichment rules, click the filter icon ( ) in the Type column header and select Event Selection.
When the two enrichment rules are enabled, they tag events with a field called m_tags that can include the values Discard BEAM or Discard EM. These tags are applied to events based on how you edit the filtering and routing information on the Event Filtering tab. On the Event Filtering tab, you select the vendors and products that you want to route to either the detection engine or the Attack Surface Insights application. The Event Selection enrichers are updated based on this filtering so that the discard tags are not applied to events that include the selected vendors and products.
The default behavior for these tags is the following:
Discard BEAM– By default, this tag is applied to all ingested events. It instructs the New-Scale analytics detection engine to discard those events without using them to trigger any alarms or detections. When you unselect vendors and products in the Detection Engine section of the Event Filtering tab, you instruct the analytics engine to process events that contain that information.Discard EM– By default, this tag is not applied to any ingested events and, therefore, all incoming events are processed in the Attack Service Insights application. When you select vendors and products in the Attack Surface Insights section of the Event Filtering tab, you instruct the Attack Surface Insights application not to process events that contain that information.
Navigating the Event Filtering Tab
The filtering and routing capabilities for each engine are separated on the page. Filtering and routing for the Detection Engine is in the top section. Filtering and routing for Attack Surface Insights is on the bottom.
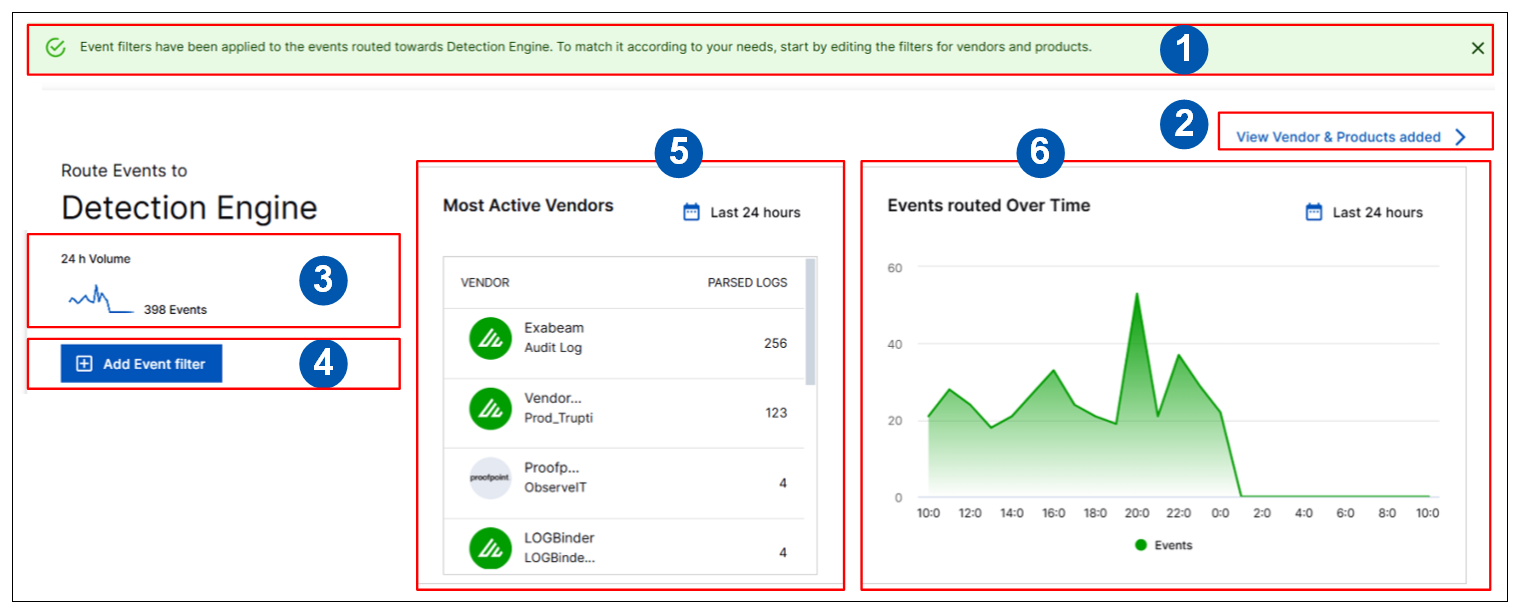
Each section includes the panels of information shown in the image below and described in the corresponding numbered points:

Event Filter Notification – This note indicates whether any event filtering has been implemented. If a filter has been applied, events related to specific vendors or products are being routed to the detection engine or to Attack Surface Insights.
View Vendor and Products Added – Click this link to open a panel that lists which vendors and products are selected for routing to the detection engine or Attack Surface Insights. For more information, see Defining Event Filters.
24 Hour Volume – This thumbnail graph shows how many events, in the last 24 hour period, have been routed to the detection engine or Attack Surface Insights, based on the vendor/product filtering applied.
Add Event Filter – Click this button to open a dialog box to add or edit event filtering. For more information, see Defining Event Filters.
Most Active Vendors – This panel shows which vendors and products, over a specified period of time, have routed events to the detection engine or Attack Surface Insights. The list is organized in descending order from the most active (based on the volume of parsed logs) to the least active. You can scroll through the list and click on items to view the full product and vendor names. By default, the panel shows data for the last 24 hours but you can click the calendar icon (
 ) to change the time period to show data for the last 7 or 30 days.
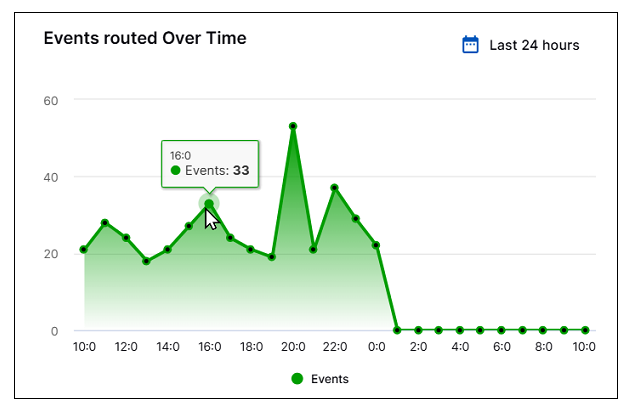
Events Routed Over Time – This graph shows the number of events, over a specified period of time, that have been routed to the detection engine or Attack Surface Insights. When you hover your cursor over the graph, the time points become visible on the graph itself. Hover over a specific point to see the number of events routed at that point in time. By default, the panel shows data for the last 24 hours but you can click the calendar icon (
 ) to change the time period to show data for the last 7 or 30 days.
Defining Event Filters
To define event filtering, use the procedure below to select which vendors and products you want to include in the filter. When events are ingested that include the selected vendors and products, those events are routed to the detection engine or to the Attack Surface Insights. application.
Open Log Stream and click the Event Filtering tab at the top.
On the Event Filtering tab, use one of the following methods to open the Add Event Filters dialog box:
Click the Add Event Filter button under the 24 Hour Volume graph on the left.
Click the View Vendor and Products Added link on the right. When the list panel opens, click the Edit Filter link at the top.
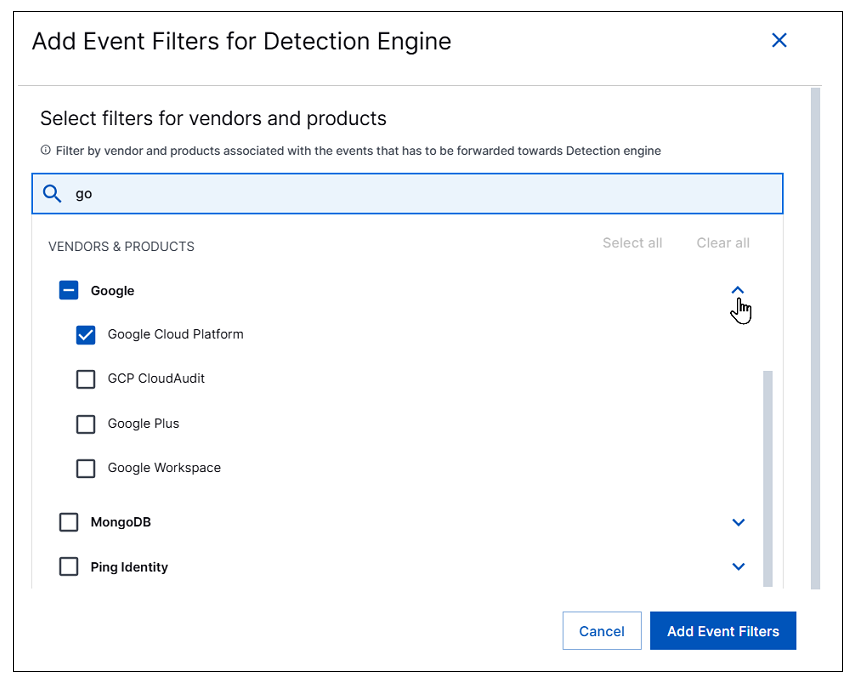
The Add Event Filters dialog box displays a list of vendors and their products that can be selected to filter events for routing to the detection engine or Attack Surface Insights.

Select the vendors and products you want to include in the filter. You can interact with the list to make selections as follows:
Use the search bar to find a specific vendor or product quickly in the long list.
Click the check box next to a vendor to add the vendor and all of its listed products to the filter.
Click the arrow to the right of a vendor to expand it and select a specific product without selecting the vendor itself or other listed products.
Click Select all to add all of the listed vendors and products to the filter.
Click Clear all to remove all vendor and product selections.
When you have selected all the desired vendors and products, click Add Event Filters. Your event filter is updated.
You can verify the updates to the event filter in the following ways:
On the Event Filtering tab, click the View Vendor and Products Added link. A panel opens and displays a list of the updated vendors and products included in the filter. When events are ingested that include data related to the selected vendors and products, those events are routed to the detection engine or Attack Surface Insights for processing.
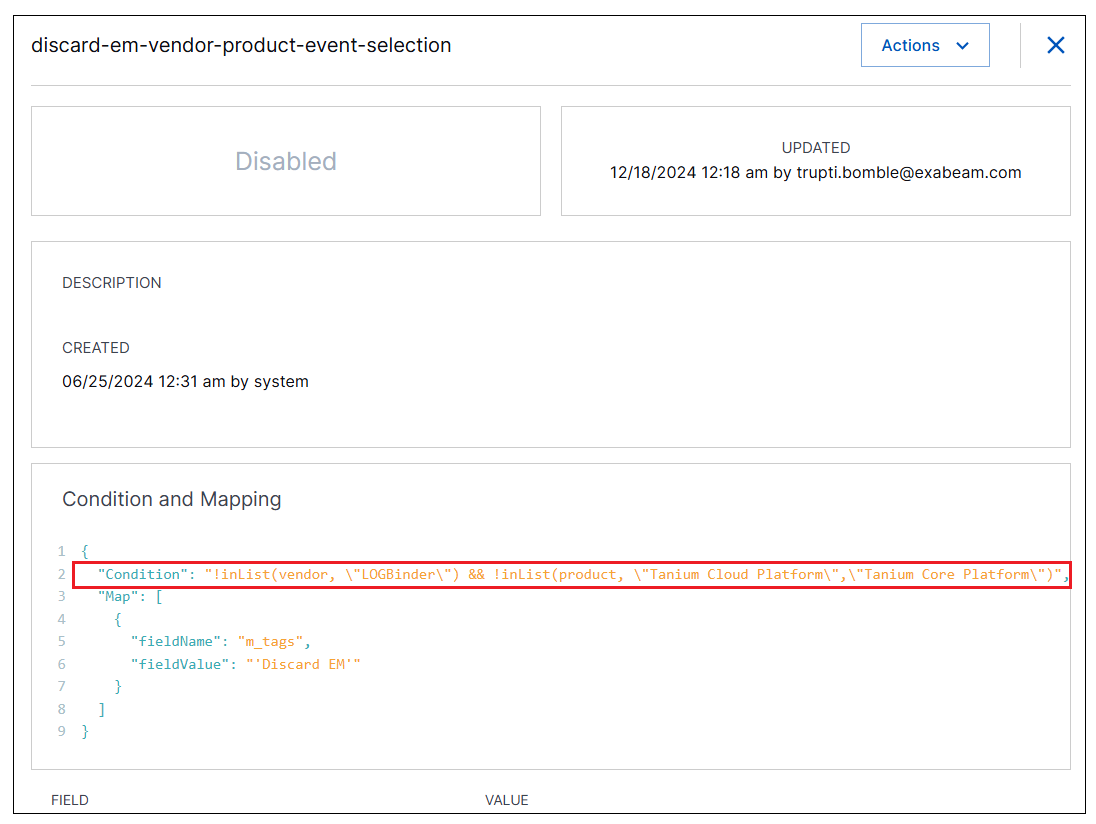
Navigate to the Enrichments tab in Log Stream. In the table of enrichment rules, click the filter icon (
 ) in the Type column header and select Event Selection. For the enrichment rule that corresponds to the event filter you are updating, click the options menu (
 ) on the right and select View Details. A details pane opens where you can examine the Condition parameter to ensure that all of the vendors and products you selected for event filtering are listed. When events are ingested that do not include the selected product or vendor data, they are tagged with the
 m_tagsfield and are not routed to the detection engine or Attack Surface Insights.
