- Log Stream Overview
- Supported Vendors and Products
- Parser Manager
- Parsers Overview
- View Parser Details
- Create a Custom Parser
- Import Sample Logs
- Define a Subset of the Sample Logs
- Add Conditions
- Add Basic Parser Information
- Extract Event Fields
- Extract Mapped JSON Fields
- Select JSON Fields from a List of Key/Value Pairs
- Select Tokenized JSON Fields from the Values in the Sample Log
- Manually Enter JSON Path Expressions
- Sample JSON Path Expressions for Manual Entry
- Reorder Mapped JSON Fields
- Review the Matching JSON Fields and Values
- Add Logic to JSON Field Extraction
- Expressions for JSON Parser Field Extractions and Enrichment Mapping
- Extract Fields Using Regular Expressions
- Reserved Fields
- Extract Mapped JSON Fields
- Add Event Builder Rules
- Review and Save Parser
- Manage Existing Custom Parsers
- Tokenize Non-Standard Log Files
- Customize a Default Parser
- Duplicate a Parser
- Enable or Disable Parsers
- Parser Updates
- Live Tail
- Enrichments
- Event Filtering
Parser Health Status
The parser health panels, on the Parsers Overview tab of the Log Stream home page, display the health of all enabled parsers in two different ways: in real time and over a selected period of time.
Enabled Parser Health Status
The Enabled Parser Health Status panel displays the health, at this time, of all enabled parsers.
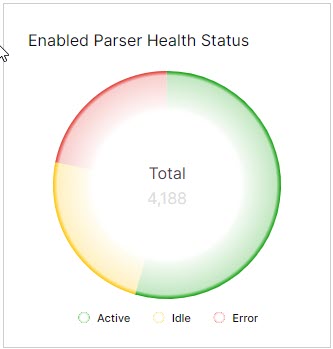
Hover your cursor over the green, red, or yellow parts of the graph to view the total number of Active , Error , or Idle parsers.
Active — parsers that have been triggered by the parsing engine at least once in the last 24 hours.
Error — parsers that have encountered an exception during parsing.
Idle — parsers that have not been triggered in the last 24 hours.
Note
Use the buttons below the graph (Active, Idle, Error) to filter the parsers represented in the graph. This selection will also be reflected in the parser listing below.
Parser Health Status Over Time
The Parser Health Status Over Time panel displays the health of all enabled parsers over a specified period of time.
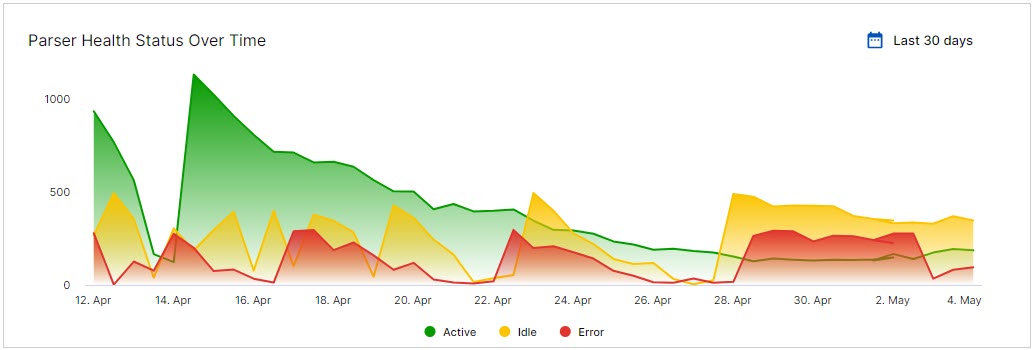
Click the calendar icon ( ) to select a period of time from the drop down menu.
Note
Use the buttons below the graph (Active, Idle, Error) to filter the parsers represented in the graph. This selection will also be reflected in the parser list below.
Individual Parser Health Status
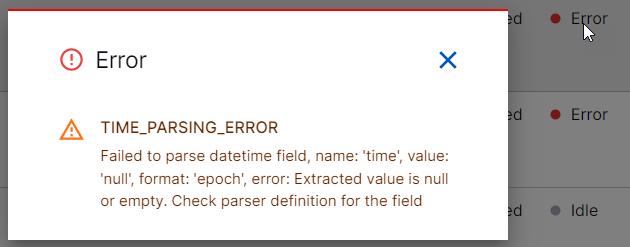
In the parser list, the health status for every parser is listed in the HEALTH column.
If a parser is in Error status, click the status to view the details of the error.