- Log Stream Overview
- Parser Manager
- Parsers Overview
- View Parser Details
- Create a Custom Parser
- Import Sample Logs
- Define a Subset of the Sample Logs
- Add Conditions
- Add Basic Parser Information
- Extract Event Fields
- Extract Mapped JSON Fields
- Select JSON Fields from a List of Key/Value Pairs
- Select Tokenized JSON Fields from the Values in the Sample Log
- Manually Enter JSON Path Expressions
- Reorder Mapped JSON Fields
- Review the Matching JSON Fields and Values
- Add Logic to JSON Field Extraction
- Expressions for Parser Field Extractions and Enrichment Mapping
- Array Log Sample
- Extract Fields Using Regular Expressions
- Reserved Fields
- Extract Mapped JSON Fields
- Add Event Builder Rules
- Review and Save Parser
- Manage Existing Custom Parsers
- Tokenize Non-Standard Log Files
- Customize a Default Parser
- Duplicate a Parser
- Enable or Disable Parsers
- Parser Updates
- Live Tail
- Enrichments
- Event Filtering
View Parser Details
To view the details of any parser:
On the Parsers Overview tab of the Log Stream home page, click the
 menu of the parser you want to view, and then select View Details.
The Parser Details page opens. You can interact with the parser in the following ways:
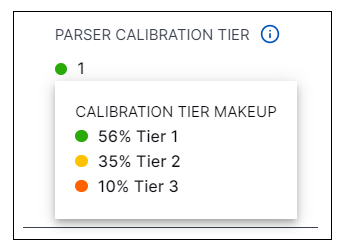
On the Details panel, you can view information about parser calibration tiers in the top portion of the page. The system calculates an individual calibration tier for each log message as it's parsed. The Parser Calibration Tier value shows an aggregated calibration tier for all of the log messages parsed in the last 24 hours by the parser whose details you are viewing. Click on the value itself to display a Calibration Tier Makeup, which shows what percentage of the parsed logs achieved each calibration tier.
For example, in the image below, 56% of the logs parsed by the selected parser in the past 24 hours had a calibration tier of 1. 35% had tier 2 and 10% had tier 3. For information about what each tier means, see Parser Calibration Tiers.

Click the Fields tab to view all of the fields this parser will attempt to extract.
Click the Extraction Preview tab to view the extracted fields and values for the most recently ingested log lines.
Click the Configuration Fields tab to view the
parser.confand theevent_builder.conffiles.Note
For information about how multiple logs can be stitched together to build a single event, see Multi-Log Event Building.
Click the Activity Log tab to view all activity associated with this parser, including updates and enablements.
Note
If the parser is in error status, the error and details will be shown at the top of the page.

Click the
 icon to dismiss the details panel and return to the parser listing.
Note
On the Parser Details page, use the options at the top of the page to execute any of the following actions on the parser: Customize, Duplicate, Disable, Disable by Vendor, Export, or View logs in Live Tail.
