- Log Stream Overview
- Supported Vendors and Products
- Parser Manager
- Parsers Overview
- View Parser Details
- Create a Custom Parser
- Import Sample Logs
- Define a Subset of the Sample Logs
- Add Conditions
- Add Basic Parser Information
- Extract Event Fields
- Extract Mapped JSON Fields
- Select JSON Fields from a List of Key/Value Pairs
- Select Tokenized JSON Fields from the Values in the Sample Log
- Manually Enter JSON Path Expressions
- Sample JSON Path Expressions for Manual Entry
- Reorder Mapped JSON Fields
- Review the Matching JSON Fields and Values
- Add Logic to JSON Field Extraction
- Expressions for JSON Parser Field Extractions and Enrichment Mapping
- Extract Fields Using Regular Expressions
- Reserved Fields
- Extract Mapped JSON Fields
- Add Event Builder Rules
- Review and Save Parser
- Manage Existing Custom Parsers
- Tokenize Non-Standard Log Files
- Customize a Default Parser
- Duplicate a Parser
- Enable or Disable Parsers
- Parser Updates
- Live Tail
- Enrichments
- Event Filtering
Add Basic Parser Information
In the Add Basic Info section:
Enter the Parser Name. Every customer parser must have a unique name. The name is used to identify and trace the parser as it's used in the Analytics Engine.
Note
Only letters, numbers, dashes and low dashes are allowed.
Note
Exabeam has standardized the parser naming convention for default parsers, ensuring that parser names are consistent across Exabeam products. We encourage the use of these standards when naming custom parsers. For more information, see Parser Naming Conventions.
Under Events, click Select events. Select all of the events (either alert or app) that apply to your custom parser, and click Select events.
Note
For more information about any of the listed events, click View Details.
Under Time Format, select a a main time format that best matches how dates and times are formatted in the sample logs. When the format you select matches the dates and times in the sample logs, they are highlighted in yellow under Sample Log Lines.
Note
In Advanced Analytics, identifying the time format helps to map the dates and times in the log to a Unix timestamp that is displayed in Advanced Analytics Smart Timeline™ events. Information about the log management system is useful metadata that documents how the log was formatted coming into the Analytics Engine.
In Data Lake, the parsed time field is matched with the defined
timeFormatto create theunixTimestampwhich is then populated asexa_rawEventTimein Data Lake.Under Alternative Time Formats, select one or more time formats to form an ordered list of other time formats that the parser can consider.
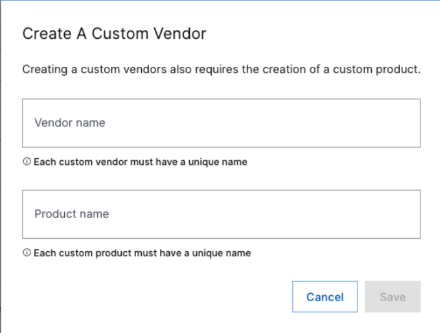
Under Vendor, select the vendor that generated the logs you imported.
Note
To add a custom vendor, click + New Vendor at the bottom of the list, and specify the custom Vendor name and Product name for your custom vendor.
Under Product, select the product that generated the logs.
Click Next.
The Extract Event Fields page appears.