- Log Stream Overview
- Parser Manager
- Parsers Overview
- View Parser Details
- Create a Custom Parser
- Import Sample Logs
- Define a Subset of the Sample Logs
- Add Conditions
- Add Basic Parser Information
- Extract Event Fields
- Extract Mapped JSON Fields
- Select JSON Fields from a List of Key/Value Pairs
- Select Tokenized JSON Fields from the Values in the Sample Log
- Manually Enter JSON Path Expressions
- Reorder Mapped JSON Fields
- Review the Matching JSON Fields and Values
- Add Logic to JSON Field Extraction
- Expressions for Extraction Conditions
- Array Log Sample
- Extract Fields Using Regular Expressions
- Extract Mapped JSON Fields
- Add Event Builder Rules
- Review and Save Parser
- Manage Existing Custom Parsers
- Tokenize Non-Standard Log Files
- Customize a Default Parser
- Duplicate a Parser
- Enable or Disable Parsers
- Live Tail
- Enrichments
- Event Filtering
Analyze and Troubleshoot
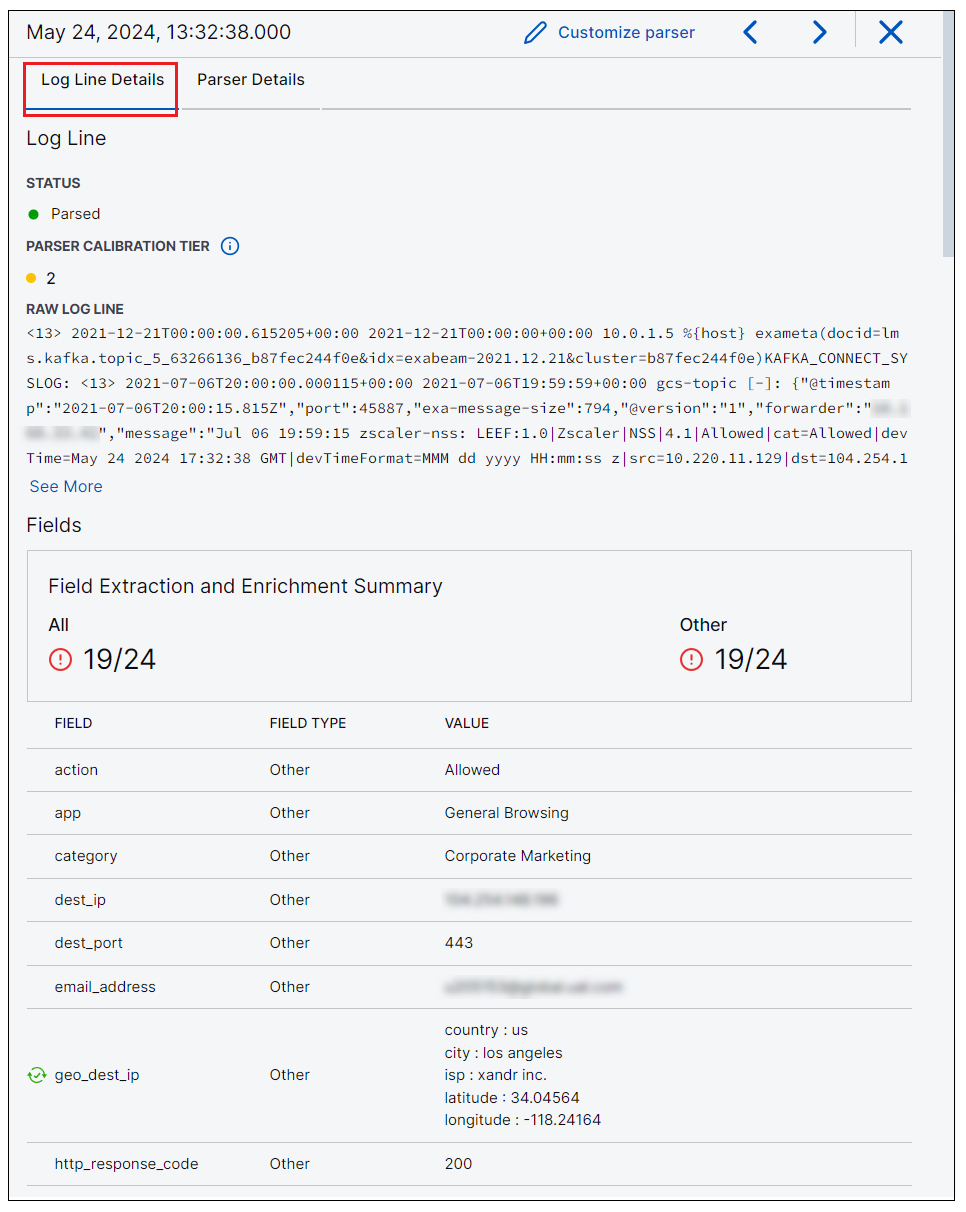
To analyze a log in Live Tail, click Pause to stop the streaming display. Scroll to a log and click the options icon  on the far right of the log row, and select View Details. A details panel opens on the right where you can view the Log Line Details tab or the Parser Details tab.
Note
View details is only available when the stream is paused.
The Log Line Details tab includes a Field Extraction and Enrichment Summary along with the raw log data. You can analyze the information to help troubleshoot the parser that processed the selected log.
 |
Tip
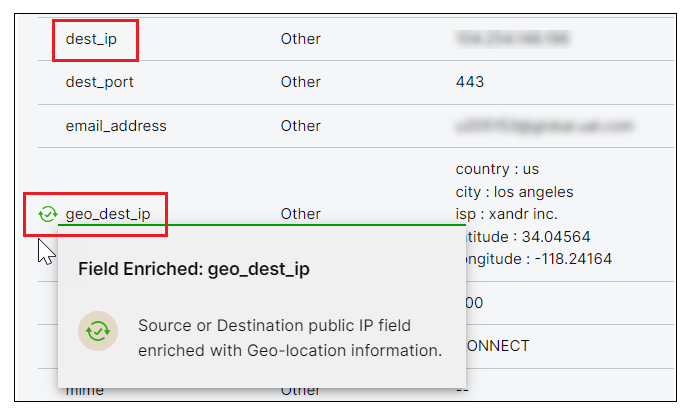
Next to any field that contains enriched data, an enrichment indicator icon is displayed (for example:  ). Note that the list of extracted fields contains both the source field and the enriched field. Click the enrichment indicator icon next to the enriched field to display an enriched field tooltip. The tooltip explains the type and source of the enriched data.
 |
The Parser Details tab includes information about the parser that processed the selected log. It includes the parser name, calibration tier, and a list of the CDI fields that have been parsed.
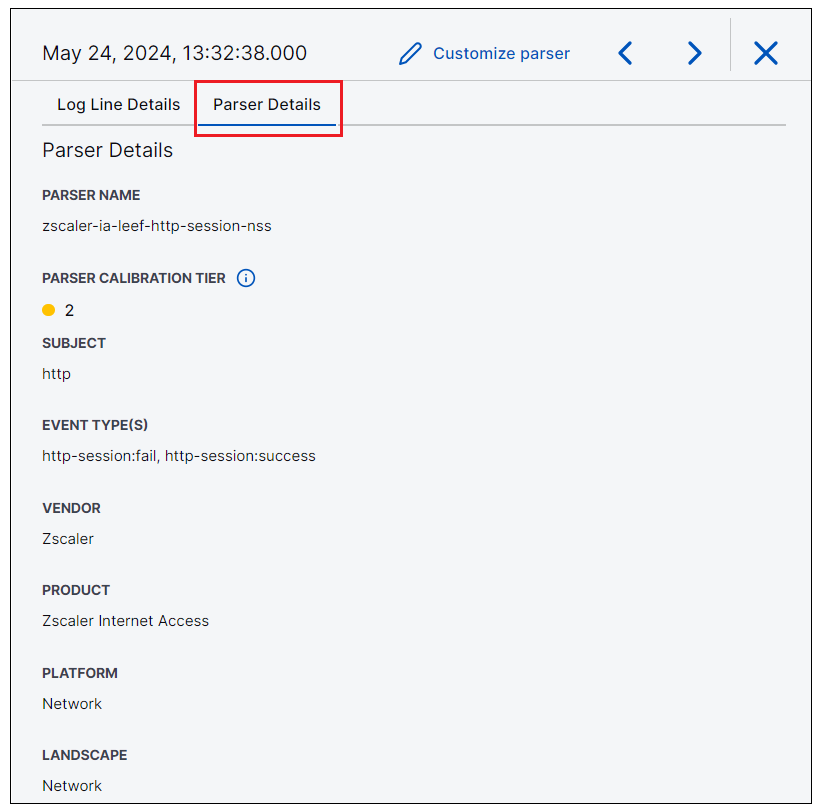 |
If you want to customize the default parser from which this Live Tail view is built, click Customize parser. The Extract Fields section of the Customize Parser page displays, loaded with the log line you were just viewing. See Customize a Default Parser for more information.