- Get Started with Threat Detection Management
- Analytics Rules
- Analytics Rule Classifications
- Create an Analytics Rule
- Manage Analytics Rules
- Tune Analytics Rules
- Find Analytics Rules
- Share Analytics Rules
- Troubleshoot Analytics Rules
- Analytics Rules Syntax
- Advanced Analytics Rule Syntax vs. Analytics Rule Syntax
- Logical Expressions in Analytics Rule Syntax'
- String Operations Using Analytics Rule Syntax
- Integer Operations Using Analytics Rule Syntax
- Time Operations Using Analytics Rule Syntax
- Network Operations Using Analytics Rule Syntax
- Context Operations Using Analytics Rule Syntax
- Entity Operations Using Analytics Rule Syntax
- Correlation Rule Operations Using Analytics Rule Syntax
- Analytics Engine Status
- Correlation Rules
- Threat Scoring
Analytics Engine Status
Determine the state and health of the analytics engine by monitoring analytics engine status.
View the status of the analytics engine under Engine Status:
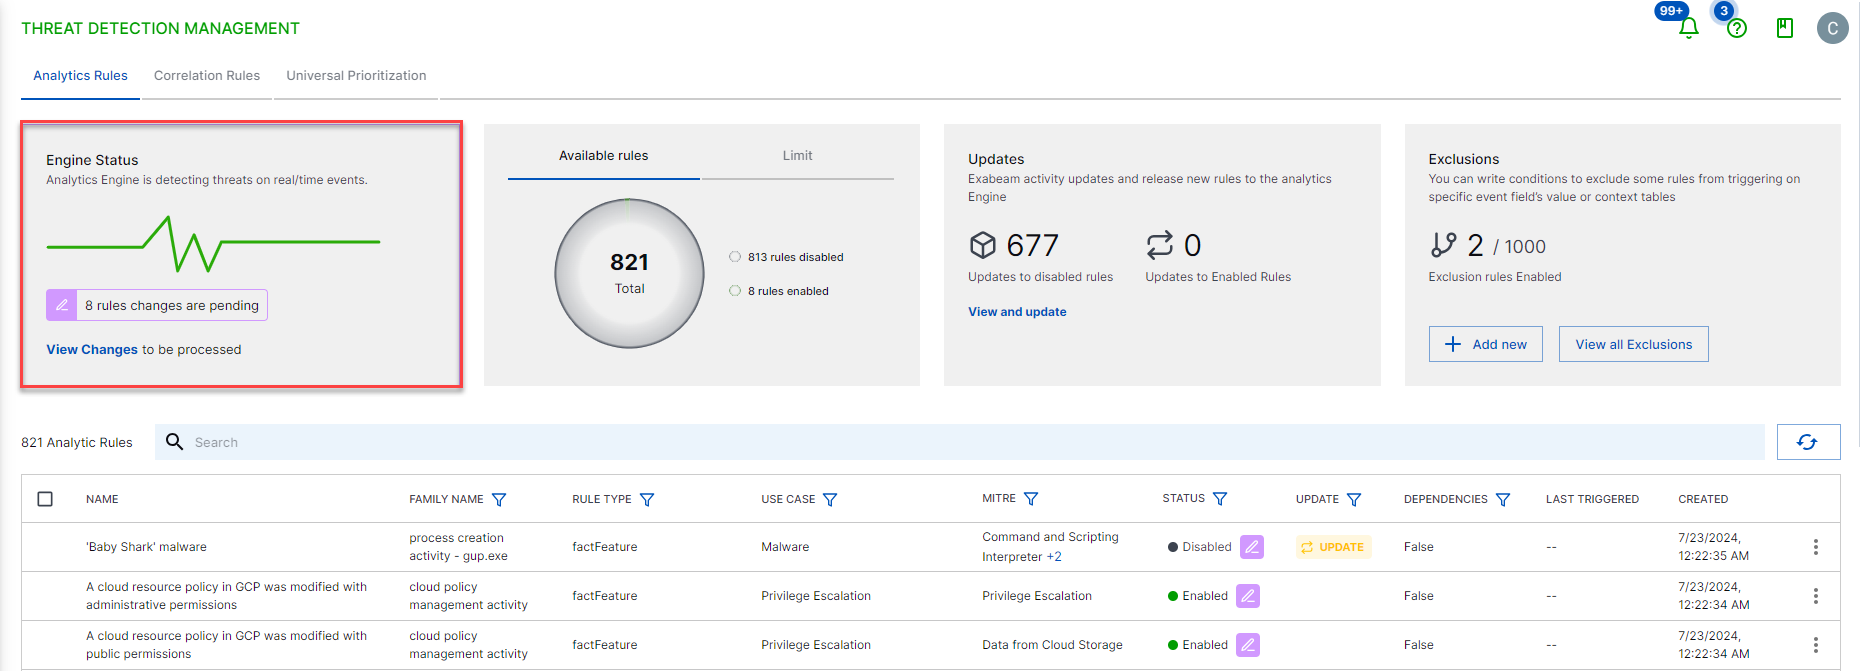
The analytics engine displays one of the following statuses:
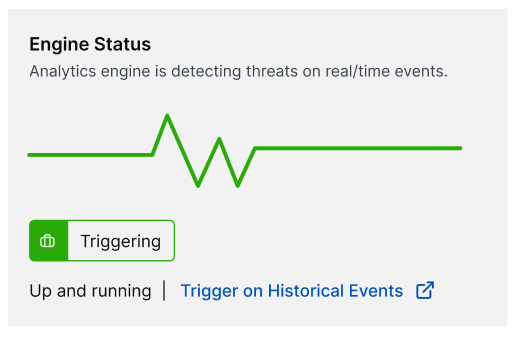
Triggering – The analytics engine is actively detecting threats in incoming events.
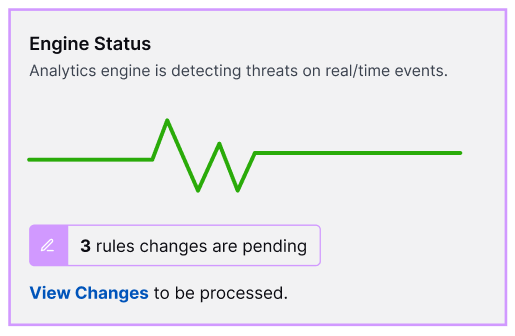
Pending changes – The analytics engine is actively detecting threats based in incoming events but has pending rule changes. To review and apply the rules changes, click View Changes.
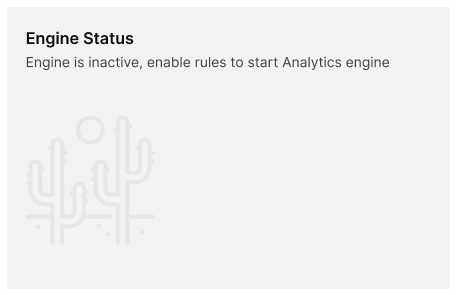
Inactive – There are no active analytics rules the analytics engine can use to evaluate incoming events. To start detecting threats, enable one or more analytics rules.
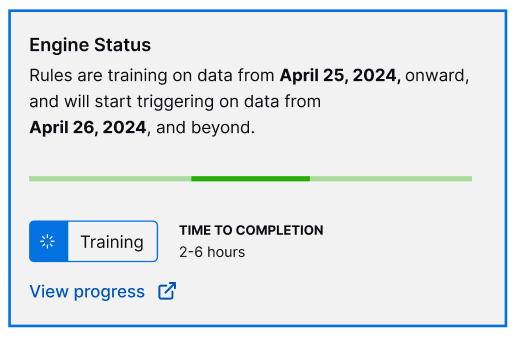
Training – The analytics engine is in a training period, assessing historical data to establish baselines. You can view its progress and how much time is left before the training period is completed.
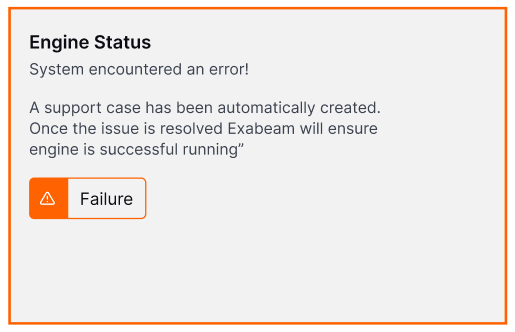
Failure – The analytics engine has encountered an error and is not operational. The error was reported to Exabeam Support. After the issue is resolved, the analytics engine reprocesses and goes through a training period.
