- Case Manager i56 Release Notes
- What's New
- Known Issues
- Issues Fixed in Case Manager i56.5 (General Availability)
- Issues Fixed in Case Manager i56.6
- Issues Fixed in Case Manager i56.7
- Issues Fixed in Case Manager i56.8
- Issues Fixed in Case Manager i56.9
- Issues Fixed in Case Manager i56.10
- Issues Fixed in Case Manager i56.11
- Issues Fixed in Case Manager i56.12
- Get Started with Case Manager
- Configure Case Manager Settings
- Investigate a Security Incident
- Manually Create an Incident
- Edit an Incident
- Delete an Incident
- Manually Assign an Incident to a Queue, Assignee, Priority, or Status
- Manually Add an Entity
- Manually Add an Artifact
- Delete an Entity or Artifact
- Add Advanced Analytics Evidence to a Case Manager Incident
- Manage Tasks During an Investigation
- Send Messages from an Incident
- Filter Incidents
- Search for an Incident
- Sort Incidents
- Export Incidents
Case Manager Metrics
View graphs, charts, and diagrams about how Case Manager is performing in Metrics.
The Metrics page is a dashboard of graphs, charts, diagrams, and other visualizations that reflect Case Manager's current state and environment. It measures and assesses how security operations and events are performing. To navigate to Metrics, in the navigation bar, select METRICS.
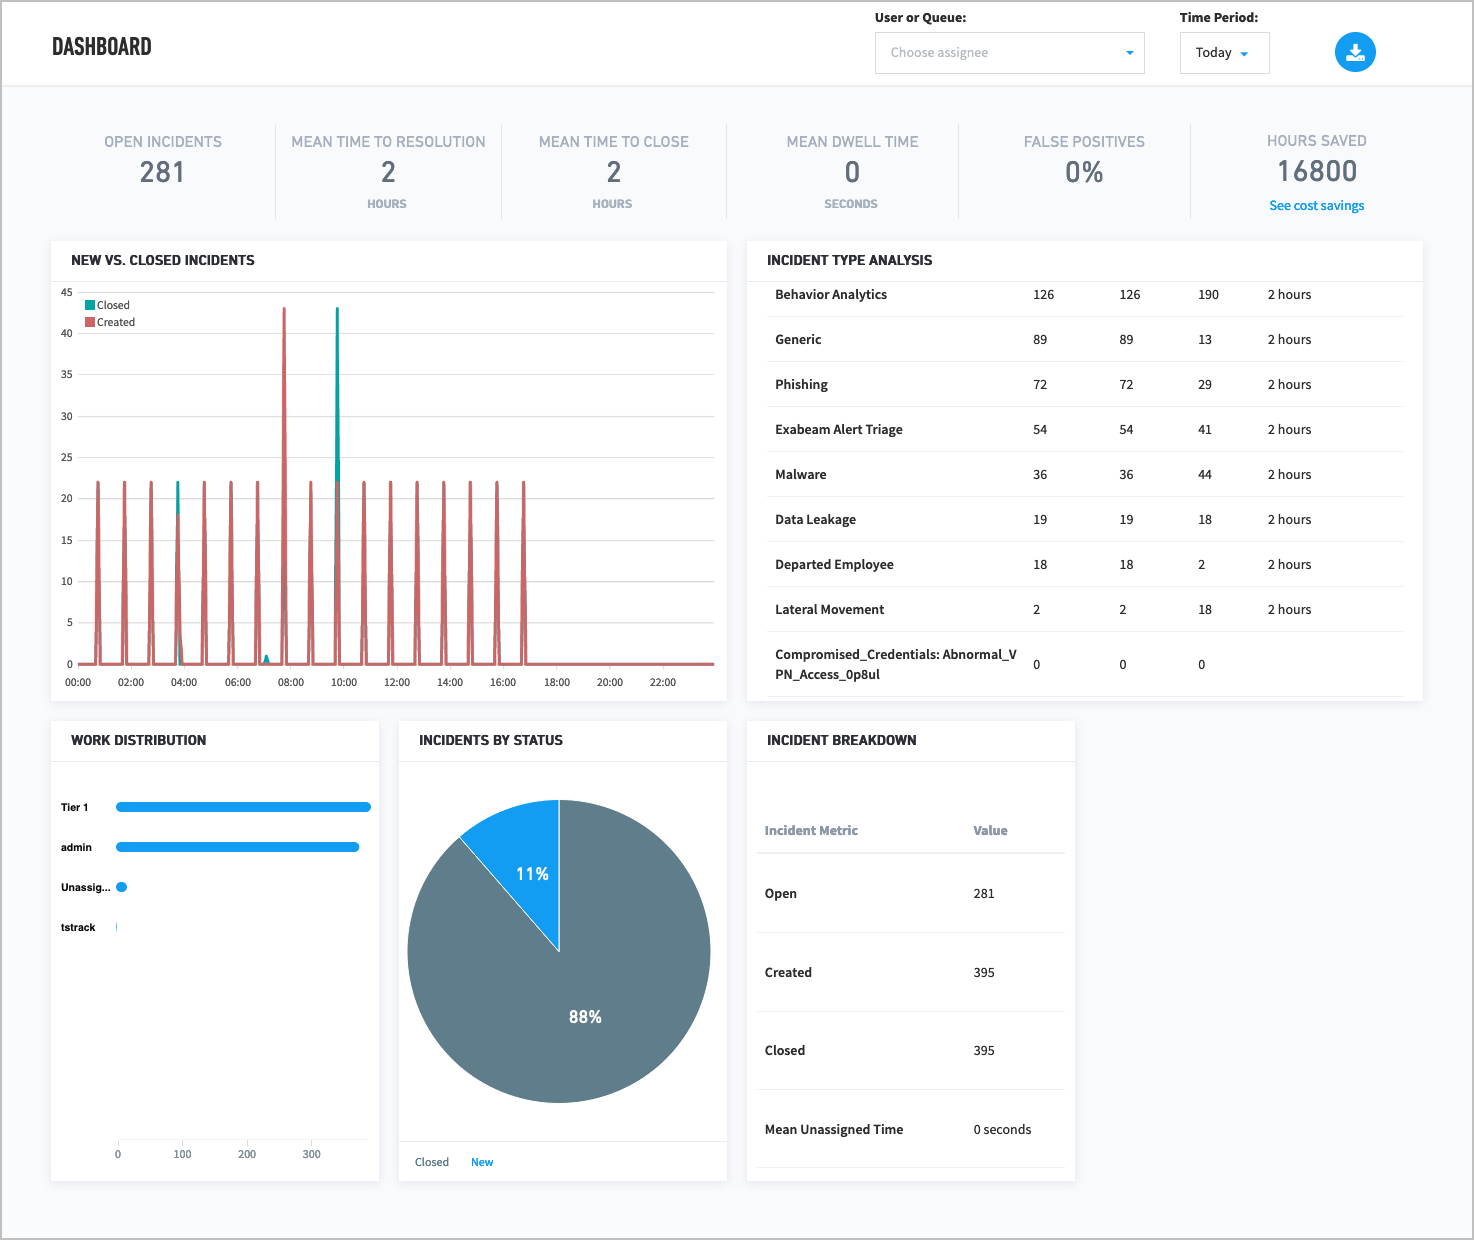 |
Filter the Metrics dashboard by incident assignee and time period. If you select a time period, it is applied across all charts.
Every time you refresh the page, the metrics also refresh. If you delete an incident, it is no longer calculated in the metrics.
View visualizations about:
Open Incidents - The number of incidents for which the status is not Closed or Closed-False Positive.
Mean Time to Resolution - The current mean (average) time to resolve all closed incidents in your environment. The time taken to resolve an incident is measured in hours from the incident's Creation Time to Closed Time. The mean time to resolution is defined by the formula:
Equation 1.where RT is the mean time to resolution, h is the number of hours between an incident's Creation Time and Closed Time, and n is the total number of incidents resolved.
Mean Time To Close - The current mean (average) time taken to close all of the currently closed incidents in your environment. The time taken to close an incident is measured in hours from the incident's Event Start Time to Closed Time. Mean time to close is defined by the formula:
Equation 2.where CT is the mean time to close, h is the number of hours between an incident's Event Start Time and Closed Time, and n is the total number of incidents closed.
Mean Dwell Time - The current mean (average) dwell time for all incidents. Dwell time is measured in hours from the incident's Event Start Time to Creation Time. Mean dwell time is defined by the formula:
Equation 3.where DT is the mean dwell time, h is the number of hours between an incident's Event Start Time and Creation Time, and n is the total number of incidents detected and responded to.
False Positives - The percentage of false positive incidents found in Incident Responder.
Hours Saved - Approximates how much Incident Responder worked equivalent to manual people hours based on the type of incident, average response time, and number of incidents processed.
New vs Closed Incidents - A timeline view of how many incidents were created vs closed on a given day.
Incidents by Type - A grid that breaks down incidents by their type. Hover over a date to view data specific to that date.
Work Distribution - Total incidents assigned to each team member; reflects how incidents and workload are allocated across the SOC team.
Incidents by Status - A percentage pie chart that breaks down the total incidents by their current status - New, In Progress, Pending, Resolved, Closed.
Mean Time to Resolution Table - Mean time to resolution based on incident type. The time taken to resolve an incident is measured in hours from the incident's Creation Time to Closed Time. The mean time to resolution is defined by the formula:
Equation 4.where RT is the mean time to resolution, h is the number of hours between an incident's Creation Time and Closed Time, and n is the total number of incidents resolved.
Incident Breakdown - The number of open incidents, created incidents, closed incidents, and the average time that an incident remains unassigned to a user.
To download the current dashboard as a PDF, click download  . The PDF contains data for all visualizations.