- Dashboards
- Navigation Overview
- View and Interact with an Open Dashboard
- View and Interact with an Open Visualization
- User Management
- Configure and Manage Dashboards
- Create a Dashboard
- Add a Visualization to a Dashboard
- Add a Text Tile
- Modify a Dashboard Layout
- Add Dashboard Filters
- Manage Automatic Refresh Rates
- Create a Scheduled Report
- Make a Dashboard Public
- Export and Import Dashboards
- Edit Dashboard Filters
- Edit Dashboard Details
- Duplicate a Dashboard
- Delete a Dashboard
- Configure and Manage Visualizations
- Create a Visualization
- Auto-Create a Visualization from a Natural Language Prompt
- Create a Visualization from a Search Query
- Add Visualizations from the Library to a Dashboard
- Modify a Visualization
- Configure Visualization Query Filters
- Include Context Filtering in Visualizations
- Make a Visualization Public
- Export and Import Visualizations
- Duplicate a Visualization
- Remove a Visualization from a Dashboard
- Delete Visualizations from the Library
- Configure and Manage Scheduled Reports
- Pre-Built Dashboards
- Advanced Analytics Dashboards
- AI/LLM Dashboards
- Case Manager Dashboards
- Compliance Dashboards
- Correlation Rules Dashboards
- Event Store Dashboards
- Access Grant and Revoke Activity
- Account Logout Summary
- Account Management Activity
- Application Security Event Summary
- Authenticated User Accounts on Hosts
- AWS CloudTrail Summary
- Data Loss Prevention Activity – Host-Based
- Data Loss Prevention Activity – User-Based
- Data Loss Prevention Activity Summary
- Default Account Access
- Default Credential Usage and Change Activity
- Denied Web Access Activity
- Disabled User Account Summary
- Discovered Attacks by Source and Destination
- Endpoint Detection and Response
- Failed Application Logon Activity
- Failed Audit Logs Summary
- Failed Host Login Attempt Counts by Users
- Failed VPN Login Attempts and Remote Session Timeouts
- Firewall Activity
- Firewall and Router Device Interfaces
- Insecure Authentication Attempts
- IOC Statistics
- Log Delay Insights
- Microsoft 365 Summary
- Microsoft Windows Overview
- Network Applications by Traffic Volume
- Policy Activity Summary
- Ports Usage Trend
- Privileged Access
- Privileged Access – User-Based
- Project Collateral
- Protocols by Network Traffic
- Remote Session Overview
- Security Alert Summary – Impacted Hosts
- Security Alert Summary – Origin Hosts
- Security Alert Summary – Users
- Successful Application Logon Activity
- Successful Database Login Activity
- Successful Physical Access
- Top Attackers
- User Account Creation Summary
- User Account Lockout Activity
- Vendor Authentication Activity
- Windows Audit Failure Summary by Hosts
- Windows Audit Failure Summary by Users
- Windows User Privilege Elevation
- Zscaler HTTP Dashboard
- Security Operations Center Management Dashboards
- Threat Center Dashboards
- Pre-Built Visualizations
- Agentic AI - Result
- Agentic AI - Violations
- Agentic AI by App ID
- Agentic AI Usage by Host
- Agentic AI Users - Blicked/Allowed
- Anomalies - Use Case & MITRE Coverage
- Anomalies by Rule Name
- Anomalies by Use Case
- Anomalies Count Over Time
- Anomaly Distribution by MITRE Tactic & Score
- Application Count
- Closed Incidents
- Correlation Rules by Severity
- Correlation Rules Triggered Over Time
- Detected Anomalies
- Host-Based DLP Alerts Count
- Incidents Created
- Incident Summary by Incident Type
- Number of Hosts with DLP Alerts
- SOC Incident Distribution
- Top 5 Host-Based DLP Alert Categories
- Top 5 Protocols in Host-Based DLP Alerts
- Top 10 Host-Based DLP Alert Types
- Top 10 Hosts with DLP Alerts
- Top Activities per Top 10 Applications
- Top Users per Top 10 Applications
- Trend of Application Security Events
Configure Visualization Query Filters
Visualization query filters can be used to tailor the information displayed in the visualization. You can configure a time range filter to show only data from a specific time period. You can configure other filters, or combinations of filters, to specify aspects of dimensions included in the visualization, like certain types of users or activities. Depending on how complex your filter needs to be, you can group filter conditions together with AND or OR operators.
To configure query filters on a visualization:
With the visualization open in edit mode, click the expand arrow (
 ) on the Filters heading at the top of the right hand panel. The Filters panel fully expands to show two sections: Required Filters and Query Filters.
Note
Required Filters cannot be removed.
The Approx Log Time filter is a required filter for visualizations based on the Event Store data model. It is automatically applied to these visualizations with a default setting of in the last 2 days. As a field, the Approx Log Time is the time that an event was triggered, and this internal filter is designed to avoid slow loading times that can happen with larger queries.
You can change this time range filter setting to anything within your licensed retention period, but it is not recommended. Instead, you can override it by adding an Approx Log Time filter at the dashboard level and setting it to any time range that you need. For information on creating dashboard filters, see Add Dashboard Filters.
In the Query Filters heading, click the expand arrow (
 ), if necessary, to open the Query Filter section.
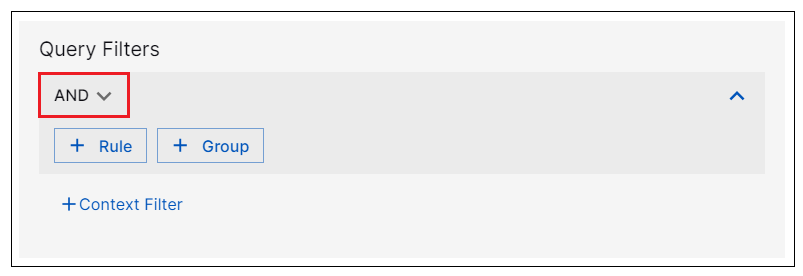
Depending on the query you want to create, select the AND, OR, NOT AND, or NOT OR operator from the drop-down menu on the left. This operator defines the relationship between each of the rule conditions within a group. The default operator is AND.

To add your first query condition, click + Rule. When the new condition row opens, define the query condition as follows:
Select a field name from the Field drop down menu. You can start type in the field to find the desired field name.
Select an operator from the menu in the middle of the condition row.
Note
The list of operators available for specific data type fields is being updated in phases to be consistent with those available across Exabeam New-Scale applications. Most recently, support for the following operators has been removed when creating new filters with IP data type fields:
starts with,ends with,does not start with,does not end with. Existing visualizations that are filtered using these operators on IP data type fields will not change. However, it's recommended that you update them with supported operators when you encounter them.If applicable, enter a value in the text field on the right of the condition row. If you enter multiple values, they are connected by an OR.

To add another condition, click + Rule again to add another row and define a new condition with field name, operator, and value.
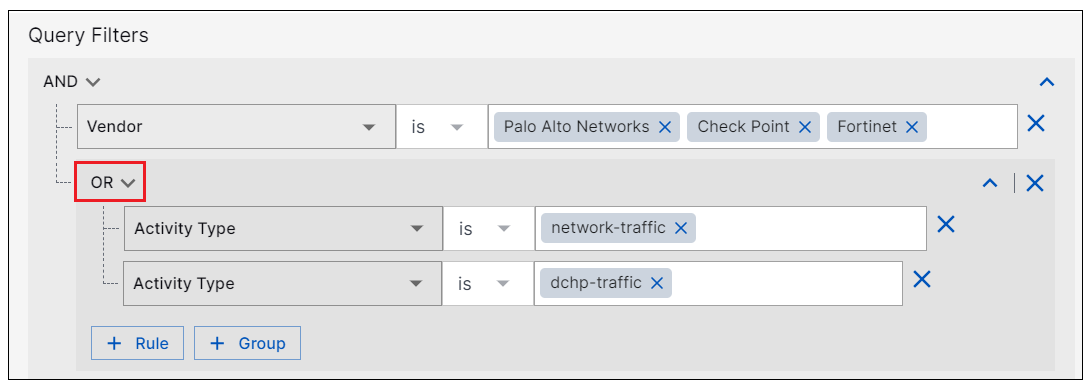
To add a new group of condition rules, click + Group. A new condition group is added to the Query Filters panel.
Depending on how you want the rule conditions in the new group to be connected to each other, select the AND, OR, NOT AND, or NOT OR operator from the drop-down menu on the left. The default operator is AND.

Click + Rule and define the conditions for each rule you want to add to the new group. You can add multiple groups of conditions. To remove a condition or a group, click the delete icon (
 ) next to it.
When you have built all of the filter conditions you need, you can review the filter as a query string. Click the collapse arrow (
 ) in the top right corner of the Query Filters panel. To view the filter conditions, click the expand arrow (
 ).
).
If you want to apply a context filter to your visualization, click the + Context Filter option at the bottom of the Query Filters panel and then click the expand arrow to open a condition row. You can add up to two context filters to the end of the filter panel and they must be connected by an AND relationship to the other filter conditions. To define context filters, enter the following information for each context filter you add:
Context Field – A field that is assigned as the key attribute in a context table.
Operator – Select the appropriate option depending on whether you want to search for data that is or is not present in the context table.
Context Table – Select the name of the context collector that you want to include in the visualization filter.

For more information about including context tables in a query filter, see Include Context Filtering in Visualizations.
When you finish building your query filters, click the Run Data button on the left to see if the filters produce the desired results in the data your visualization displays.
To save the query filters, click Save or Add, depending on how you opened the visualization for editing.
