- Dashboards
- Navigation Overview
- View and Interact with an Open Dashboard
- View and Interact with an Open Visualization
- User Management
- Configure and Manage Dashboards
- Create a Dashboard
- Add a Visualization to a Dashboard
- Add a Text Tile
- Modify a Dashboard Layout
- Add Dashboard Filters
- Manage Automatic Refresh Rates
- Create a Scheduled Report
- Make a Dashboard Public
- Export and Import Dashboards
- Edit Dashboard Filters
- Edit Dashboard Details
- Duplicate a Dashboard
- Delete a Dashboard
- Configure and Manage Visualizations
- Create a Visualization
- Auto-Create a Visualization from a Natural Language Prompt
- Create a Visualization from a Search Query
- Add Visualizations from the Library to a Dashboard
- Modify a Visualization
- Configure Visualization Query Filters
- Include Context Filtering in Visualizations
- Make a Visualization Public
- Export and Import Visualizations
- Duplicate a Visualization
- Remove a Visualization from a Dashboard
- Delete Visualizations from the Library
- Configure and Manage Scheduled Reports
- Pre-Built Dashboards
- Advanced Analytics Dashboards
- AI/LLM Dashboards
- Case Manager Dashboards
- Compliance Dashboards
- Correlation Rules Dashboards
- Event Store Dashboards
- Access Grant and Revoke Activity
- Account Logout Summary
- Account Management Activity
- Application Security Event Summary
- Authenticated User Accounts on Hosts
- AWS CloudTrail Summary
- Data Loss Prevention Activity – Host-Based
- Data Loss Prevention Activity – User-Based
- Data Loss Prevention Activity Summary
- Default Account Access
- Default Credential Usage and Change Activity
- Denied Web Access Activity
- Disabled User Account Summary
- Discovered Attacks by Source and Destination
- Endpoint Detection and Response
- Failed Application Logon Activity
- Failed Audit Logs Summary
- Failed Host Login Attempt Counts by Users
- Failed VPN Login Attempts and Remote Session Timeouts
- Firewall Activity
- Firewall and Router Device Interfaces
- Insecure Authentication Attempts
- IOC Statistics
- Log Delay Insights
- Microsoft 365 Summary
- Microsoft Windows Overview
- Network Applications by Traffic Volume
- Policy Activity Summary
- Ports Usage Trend
- Privileged Access
- Privileged Access – User-Based
- Project Collateral
- Protocols by Network Traffic
- Remote Session Overview
- Security Alert Summary – Impacted Hosts
- Security Alert Summary – Origin Hosts
- Security Alert Summary – Users
- Successful Application Logon Activity
- Successful Database Login Activity
- Successful Physical Access
- Top Attackers
- User Account Creation Summary
- User Account Lockout Activity
- Vendor Authentication Activity
- Windows Audit Failure Summary by Hosts
- Windows Audit Failure Summary by Users
- Windows User Privilege Elevation
- Zscaler HTTP Dashboard
- Security Operations Center Management Dashboards
- Threat Center Dashboards
- Pre-Built Visualizations
- Agentic AI - Result
- Agentic AI - Violations
- Agentic AI by App ID
- Agentic AI Usage by Host
- Agentic AI Users - Blicked/Allowed
- Anomalies - Use Case & MITRE Coverage
- Anomalies by Rule Name
- Anomalies by Use Case
- Anomalies Count Over Time
- Anomaly Distribution by MITRE Tactic & Score
- Application Count
- Closed Incidents
- Correlation Rules by Severity
- Correlation Rules Triggered Over Time
- Detected Anomalies
- Host-Based DLP Alerts Count
- Incidents Created
- Incident Summary by Incident Type
- Number of Hosts with DLP Alerts
- SOC Incident Distribution
- Top 5 Host-Based DLP Alert Categories
- Top 5 Protocols in Host-Based DLP Alerts
- Top 10 Host-Based DLP Alert Types
- Top 10 Hosts with DLP Alerts
- Top Activities per Top 10 Applications
- Top Users per Top 10 Applications
- Trend of Application Security Events
Modify a Visualization
There are multiple ways to begin editing an existing visualization, depending on where you start from, and whether or not the visualization is already included in the visualization library or on any dashboards.
Access the visualization you want to modify in one of the following ways:
Not included on a dashboard – If the visualization is not yet part of any dashboards, navigate to the Visualizations tab. Depending on your viewing mode, locate the row or tile of the visualization you want to edit and either click it or click the options menu icon (
 ) and select Edit Visualization. The visualization opens directly into edit mode. Skip Step 2 and continue with Step 3.
Included on a dashboard – If the visualization is already included on one or more dashboards you can access the visualization for editing from either the Visualizations tab or from within a specific dashboard:
From the Visualizations tab – Locate the row or tile of the visualization and do one of the following:
Click to open it and then click the Edit button. A selection dialog box opens. Continue with Step 2.
Click the options menu icon (
 ) and select Edit Visualization. A selection dialog box opens. Continue with Step 2.
From within a dashboard – Click Edit to enter the dashboard edit mode. Locate the tile of the visualization on the dashboard, click the options menu icon (
 ) in the top right corner of the tile, and select Edit. A selection dialog box opens. Continue with Step 2.
In the selection dialog box, choose one of the methods below to handle editing a visualization that is included on one or more dashboards. To see a list of the dashboards the visualization is linked to, click Show linked dashboards icon (
 ) at the bottom of the dialog box.
Edit on all dashboards – Edit the visualization so that it's updated on all of the dashboards it's linked to. Click this option and the visualization opens in edit mode.
Copy and edit – Make a copy of the visualization and update the copy. Click this option and a copy of the visualization opens in edit mode. The original visualization is not affected by any subsequent editing.
Unlink and edit – Unlink the visualization from some or all of its linked dashboards before updating. Click this option and a new dialog box lists all of the dashboards the visualization is included on. Click Unlink next to each dashboard you want to remove the visualization from. Then click Continue to Edit. The visualization opens in edit mode.

When the visualization is open in edit mode, you do any of the following:
Edit the title – Edit the title in the top left corner of the visualization.
Edit measures – On the left side of the dialog box, click Edit in the upper right corner of the Measures panel.
When you expand the Measures panel, it contains two sections. The In Visualization section shows the measures you've selected for inclusion in the visualization. The Available Measures section provides categories of available measures to choose from. The measure categories are similar to the categories of fields you are used to seeing in the Basic Search service. They include: a set of Recommendation measures, Common fields, Custom fields, and metadata. When you hover over an available field, a tooltip is displayed that includes the field's Common Information Model name and a description. You can also use the Search field to help you find a specific measure.
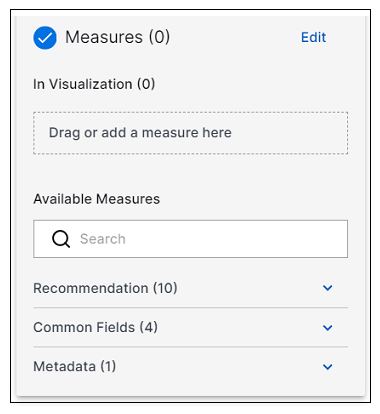
In the Measures panel, you can:
Click the expand (
 ) and collapse (
 ) arrows to navigate the lists of available measures, or use the Search field to find a measure field quickly.
Tip
If you use the Search field to locate measures, don't forget to remove the search term when you look for the next measure.
Click the plus icon (
 ) on an available measure to add it the the visualization. The number next to In Visualization will increment as you add measures.
Click the delete icon (
 ) next to a selected measure to remove it from the visualization.
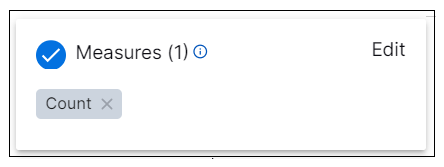
Click Edit in the upper right corner to collapse the panel. It will display the selected measures and you can still click to remove a specific measure.
Edit dimensions – On the left side of the dialog box, click Edit in the upper right corner of the Dimensions panel.
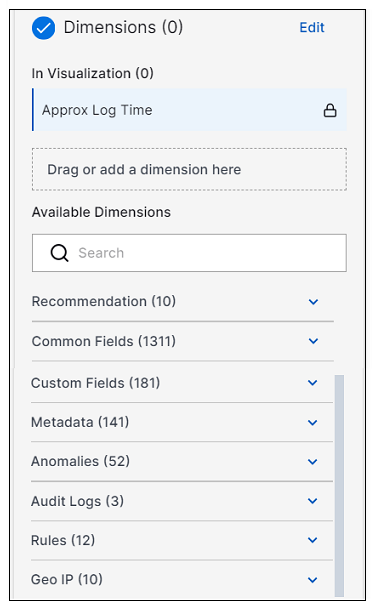
When you expand the Dimensions panel, it contains two sections. The In Visualization section shows the dimensions you've selected for inclusion in the visualization. The Available Dimensions section provides categories of available dimensions to choose from. The dimension categories are similar to the categories of fields you are used to seeing in the Basic Search service. They include: a set of Recommendation dimensions, Common Fields, Custom Fields, Metadata, Anomalies, Audit Logs, Rules, and Geo IP. When you hover over an available field, a tooltip is displayed that includes the field's Common Information Model name and a description. You can also use the Search field to help you find a specific dimension.
Tip
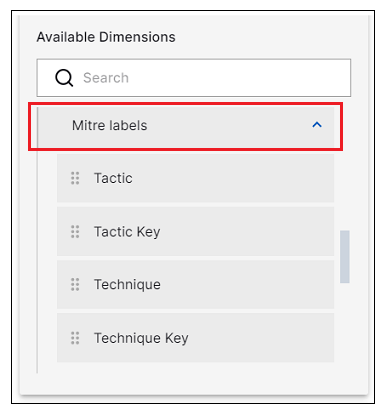
In some categories of dimensions, such as Rules and Geo IP, certain dimensions can be expanded to find additional dimensions. For example, under Rules, you can find Mitre labels, which can be expanded to show additional more specific dimensions such as Tactic and Technique.
In the Dimensions panel, you can:
Click the expand (
 ) and collapse (
 ) arrows to navigate the lists of available dimensions, or use the Search field to find a dimension field quickly.
Tip
If you use the Search field to locate dimensions, don't forget to remove the search term when you look for the next dimension.
Click the plus icon (
 ) on an available dimension to add it the the visualization. The number next to In Visualization will increment as you add measures.
Tip
Select only the dimensions you want to display in the visualization. If you want to filter on a dimension that you do not want to display, do not select it as a dimension. Instead set a filter, as shown in Edit Filters below.
Click the pivot icon (
 ) to designate a dimension as a pivot field in the visualization. To remove the pivot from a dimension, click the pivot icon again.
Click the delete icon (
 ) next to a selected measure to remove it from the visualization.
Click Edit in the upper right corner to collapse the panel. It will display the selected measures and you can still click to remove a specific measure.
Note
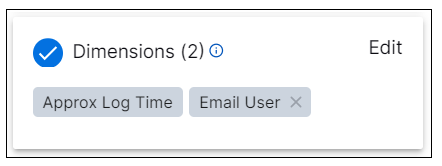
If you selected the Event model type, in Step 2, to start your visualization, the Approx Log Time is automatically included as a filter set for 2 days. You can change the filter but not delete it. Other model types do not include this log time filter by default, but you can add it.
There are a some optional steps you can take when working with dimensions:
Create a custom measure from a dimension field – While the dimension is still in the Available Dimensions list, move your cursor over the dimension and click the options icon (
 ). Select one of the available aggregation functions to be applied to the dimension: Count distinct, List of unique values, Minimum, Maximum, Sum, Average. The custom measures are added to the In Visualization section of the Measures tab.
Note
Minimum, Maximum, Sum, and Average are available only for numeric dimensions, such as Rule Count or Attachment Count.
Create a custom data group from a dimension field – While the dimension is still in the Available Dimensions list, move your cursor over a dimension and click the options icon (
 ). Select the Group option. The Group By dialog box opens. Add a Custom Field Name for the new group. In the Groups section, define the conditions you want to use to group the data. For example, in the image below, the
 email_addressdimension is being grouped by personal vs work email addresses. Any remaining activity will be grouped under other. When you've defined the groups, click Save. The custom data group is added to the In Use tab under Custom fields.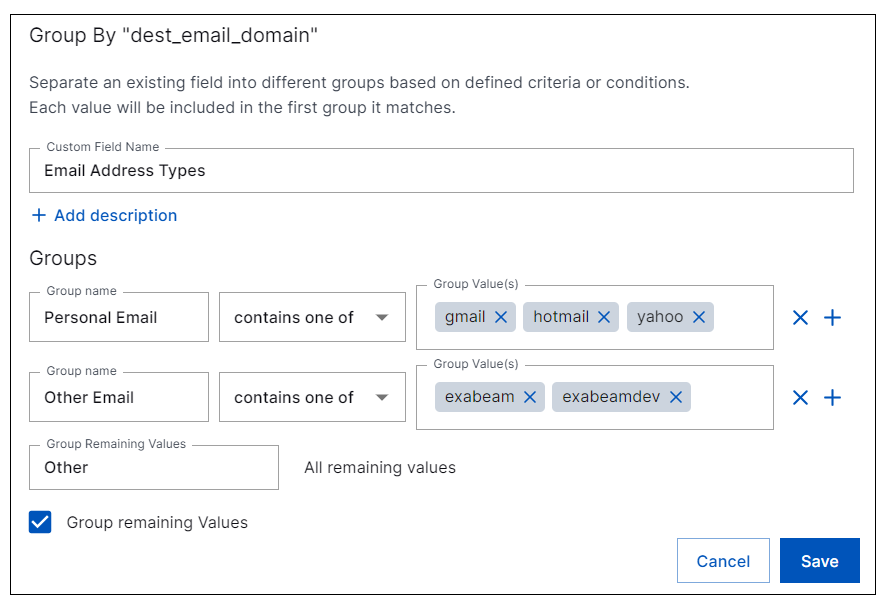
Edit filters – To add filters to the visualization, click the expand icon (
 ) on the far right side of the Filters panel. For more information about creating filters or using context filters, see Configure Visualization Query Filters.
Edit the data table – You can opt to interact with the data table in the following ways:
Change the number of data rows displayed – Click in the Row limits box and change the number of rows you want to display.
Change the sort order of the data – To control the way data appears in a visualization, you can sort the data in any column in the data table. Click the column header to toggle between ascending and descending order.
View and copy the data in a SQL query format – To view the data table in a SQL format, click the SQL icon (
 ) in the top right corner of the data table. A SQL dialog box opens. At the bottom of the dialog box, click Copy. You can then paste the SQL data into an application or file of your choice.
Edit the chart – To edit the visualization chart, click the Chart tab at the top of the main panel. Choose a chart type that is appropriate for the data you are visualizing. Keep in mind the following when working with charts:
It can be helpful to click through the different chart types to preview how they appear. If the data you have selected is not compatible with a specific chart, a message is displayed to indicate the type of dimensions and metrics needed to use it.
For a map chart, the visualization must include a Country Code dimension.
For bar and column charts, you can opt to change the series positioning. Click the settings icon (
 ) and then select the desired series positioning: Grouped, Stacked, or Stacked Percentage.
To view the results of your modifications, click
 Run Data button on the left, below the Dimensions panel.
 Click Save to save the visualization changes.
