
- Dashboards
- Navigation Overview
- User Management
- View and Interact with an Open Dashboard
- View and Interact with an Open Visualization
- Configure and Manage Dashboards
- Create a Dashboard
- Add a Visualization to a Dashboard
- Add a Text Tile
- Modify a Dashboard Layout
- Add Dashboard Filters
- Manage Automatic Refresh Rates
- Create a Scheduled Report
- Make a Dashboard Public
- Export and Import Dashboards
- Edit Dashboard Filters
- Edit Dashboard Details
- Duplicate a Dashboard
- Delete a Dashboard
- Configure and Manage Visualizations
- Create a Visualization Using the Basic Method
- Auto-Create a Visualization from a Natural Language Prompt
- Create a Visualization from a Search Query
- Add Visualizations from the Library to a Dashboard
- Modify a Visualization
- Configure Visualization Query Filters
- Include Context Filtering in Visualizations
- Make a Visualization Public
- Export and Import Visualizations
- Duplicate a Visualization
- Remove a Visualization from a Dashboard
- Delete Visualizations from the Library
- Configure and Manage Scheduled Reports
- Pre-Built Dashboards
- Advanced Analytics Dashboards
- AI/LLM Dashboards
- Alert Dashboards
- Case Manager Dashboards
- Compliance Dashboards
- Correlation Rules Dashboards
- Event Store Dashboards
- Access Grant and Revoke Activity
- Account Logout Summary
- Account Management Activity
- Application Security Event Summary
- Authenticated User Accounts on Hosts
- AWS CloudTrail Summary
- Data Loss Prevention Activity – Host-Based
- Data Loss Prevention Activity – User-Based
- Data Loss Prevention Activity Summary
- Default Account Access
- Default Credential Usage and Change Activity
- Denied Web Access Activity
- Disabled User Account Summary
- Discovered Attacks by Source and Destination
- Endpoint Detection and Response
- Failed Application Logon Activity
- Failed Audit Logs Summary
- Failed Host Login Attempt Counts by Users
- Failed VPN Login Attempts and Remote Session Timeouts
- Firewall Activity
- Firewall and Router Device Interfaces
- Insecure Authentication Attempts
- IOC Statistics
- Log Delay Insights
- Microsoft 365 Summary
- Microsoft Windows Overview
- Network Applications by Traffic Volume
- Policy Activity Summary
- Ports Usage Trend
- Privileged Access
- Privileged Access – User-Based
- Project Collateral
- Protocols by Network Traffic
- Remote Session Overview
- Security Alert Summary – Impacted Hosts
- Security Alert Summary – Origin Hosts
- Security Alert Summary – Users
- Successful Application Logon Activity
- Successful Database Login Activity
- Successful Physical Access
- Top Attackers
- User Account Creation Summary
- User Account Lockout Activity
- Vendor Authentication Activity
- Windows Audit Failure Summary by Hosts
- Windows Audit Failure Summary by Users
- Windows User Privilege Elevation
- Zscaler HTTP Dashboard
- Security Operations Center Management Dashboards
- Threat Center Dashboards
- Pre-Built Visualizations
- Agentic AI - Result
- Agentic AI - Violations
- Agentic AI by App ID
- Agentic AI Usage by Host
- Agentic AI Users - Blicked/Allowed
- Anomalies - Use Case & MITRE Coverage
- Anomalies by Rule Name
- Anomalies by Use Case
- Anomalies Count Over Time
- Anomaly Distribution by MITRE Tactic & Score
- Application Count
- Closed Incidents
- Correlation Rules by Severity
- Correlation Rules Triggered Over Time
- Detected Anomalies
- Host-Based DLP Alerts Count
- Incidents Created
- Incident Summary by Incident Type
- Number of Hosts with DLP Alerts
- SOC Incident Distribution
- Top 5 Host-Based DLP Alert Categories
- Top 5 Protocols in Host-Based DLP Alerts
- Top 10 Host-Based DLP Alert Types
- Top 10 Hosts with DLP Alerts
- Top Activities per Top 10 Applications
- Top Users per Top 10 Applications
- Trend of Application Security Events
NSA Detections Overview
This dashboard provides an overview of the alerts being triggered in your New-Scale Analytics environment. Based on a series of filters that search for alert events, the dashboard visualizes the volume of alerts by various metrics and provides a count of different alert types.
Note
This pre-built dashboard is available only with a New-Scale Analytics license.
Dashboard Filters
You can filter the data in the dashboard visualizations by the alert stages and by the alert creation time stamps.
To set the filters:
Click the drop-down arrow (
 )on the right to expand the filters panel.
Update either of the available filters.
In the Alerts: Stage filter, select one or more alert stages.
In the Alerts: Creation Timestamp Time filter, select an operator from the first drop down menu and then enter or select values in the subsequent fields, depending on the selected operator.

Click Apply. The updated filters are applied to the visualizations on the dashboard.
NSA Alerts by Use Case
This pie chart shows the total number of alerts trigger, and shows the count proportions by use case. To view the represented values, hover your cursor over the graph slices. To drill down into a specific use case and view the underlying alert events, click a graph slice, and then click Show All. A dialog box opens and lists the first 500 alerts for the selected use case.
NSA Alerts by MITRE Tactics
This bar chart shows the count of alerts by MITRE tactic over the selected time range. To view the represented values, hover your cursor over the graph bars. To drill down into a specific MITRE tactic and view the underlying alert events, click a graph bar, and then click Show All. A dialog box opens and lists the first 500 alerts for the selected MITRE tactic.
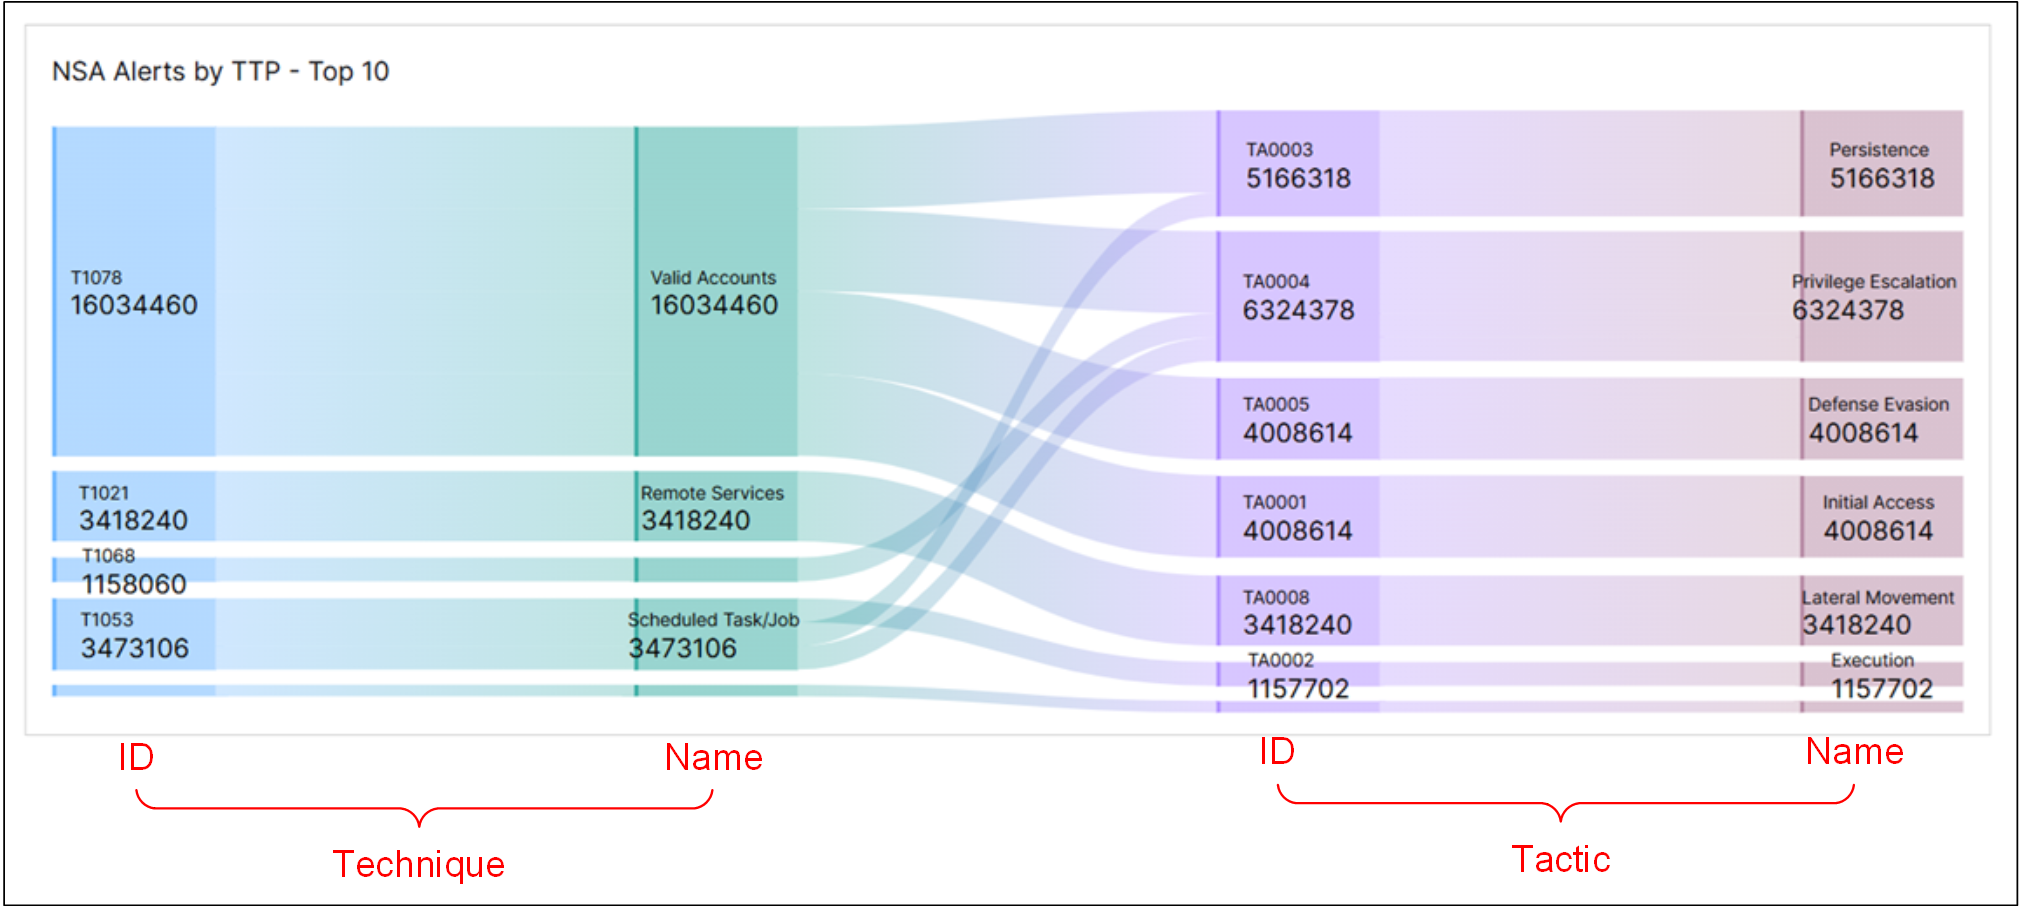
NSA Alerts by TTP - Top 10
This Sankey chart shows the count of alerts for MITRE techniques, for the 10 techniques with the highest alert counts, and breaks the counts down by specific MITRE tactics. The techniques are listed by ID and name on the left side of the chart. The tactics are listed by ID and name on the right side. The connections between them show how the alert count for each technique on left is broken down across the tactics on the right. This chart can help you monitor alert activity from different techniques to ensure that traffic and behavior matches expectations.
To highlight the links between the techniques and tactics, and to view their count values, hover your cursor over the graph connectors. To view the underlying alert events of a value, click the link, and then click Show Results in Search.
 |
Alerts Count Over Time
This area chart shows the count trend of alerts by rule trigger events over the selected time range. To view the values represented in the chart, move your cursor over the graph area to display the date data points. To drill down into a date, for a specific rule, and view the underlying alert events, click Show All. A dialog box opens and lists the first 500 alerts for the selected date of the specified rule.
Count of Context Alerts
This table provides a count of alerts triggered by rules related to context table alerts (rules whose Rule ID begins with Cntx-). To sort the table, click the heading of any column that you want to sort the data by. Then use the arrow icon to change between ascending ( ) and descending (
 ) orders. To view all the table rows, you may need to use the scroll bar on the right.
To view the underlying events, in the Count column, click a count value and then click Show Results in Search.
Count of Fact Alerts
This table provides a count of alerts triggered by rules related to fact alerts (rules whose Rule ID begins with Fact-). To sort the table, click the heading of any column that you want to sort the data by. Then use the arrow icon to change between ascending () and descending () orders. To view all the table rows, you may need to use the scroll bar on the right.
To view the underlying events, in the Count column, click a count value and then click Show Results in Search.
Count of Profiled Alerts
This table provides a count of alerts triggered by rules related to profile alerts (rules whose Rule ID begins with Prof-, NumSP, NumDCP, or NumCP). To sort the table, click the heading of any column that you want to sort the data by. Then use the arrow icon to change between ascending () and descending () orders. To view all the table rows, you may need to use the scroll bar on the right.
To view the underlying events, in the Count column, click a count value and then click Show Results in Search.