- Search Overview
- Search Home Page
- Performing Searches
- Basic Search
- Advanced Search
- Advanced Search Building Blocks
- Running an Advanced Search Query
- Query Syntax
- Query by Subject
- Query by Vendor and Product
- Query by Field and Value
- Query by Context Table
- Query Using Regex
- Query Using Wildcards
- Free Text Search
- Query Using Advanced Query Language Operators
- Query Using Aggregation Functions
- Query Using Structured Fields
- Dynamic Field Extraction
- Natural Language Search
- Anomaly Search
- Refine a Search
- Context Tables in Search
- Search Best Practices
- Search Results
- Histogram View of Search Results
- Search Results Navigation Bar
- Timeline View of Search Results
- List View of Search Results
- Table View of Search Results
- Aggregated Search Results
- Event Details
- Detection Details
- Entity Details
- Data Insights
- Export Search Results
- View and Download Exported Search Result Files
- Dashboard Visualizations
Dashboard Visualizations
To visualize your data and spot trends over time, you can use the Dashboard app that is available on the New-Scale Security Operations Platform. The Dashboard includes pre-built dashboards for common use cases such as for compliance to help you get going. You can duplicate these dashboards and customize them, or you can create custom dashboards from scratch.
For more information, see Pre-built Dashboards.
There are three ways to immediately pivot to the Dashboard app from your search results:
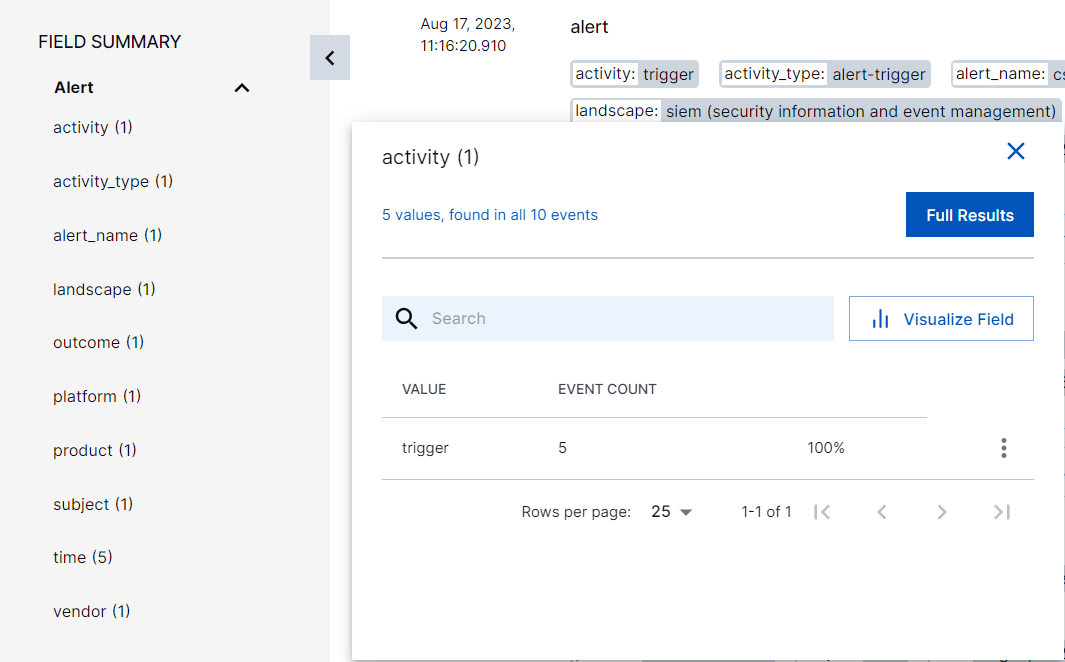
Select a field on the Field Summary panel, and click the
 icon.
icon.
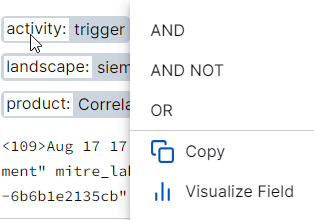
Click on any parsed field in the search results list view, and select
 from the menu.
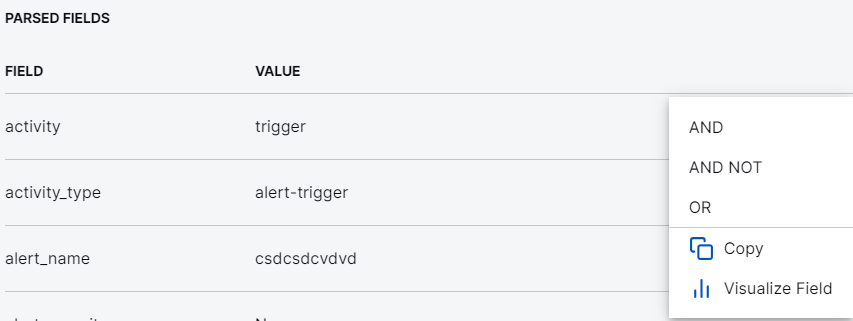
Click the
 menu for any parsed field on the Event Details panel, and select
  from the menu.
Upon pivoting to the Dashboard app, you will be presented with the visualization editor view with the information from your search query preconfigured.
