- Search Overview
- Search Home Page
- Performing Searches
- Basic Search
- Advanced Search
- Advanced Search Building Blocks
- Running an Advanced Search Query
- Query Syntax
- Query by Subject
- Query by Vendor and Product
- Query by Field and Value
- Query by Context Table
- Query Using Regex
- Query Using Wildcards
- Free Text Search
- Query Using Advanced Query Language Operators
- Query Using Aggregation Functions
- Query Using Structured Fields
- Dynamic Field Extraction
- Natural Language Search
- Anomaly Search
- Refine a Search
- Context Tables in Search
- Search Best Practices
- Search Results
- Histogram View of Search Results
- Search Results Navigation Bar
- Timeline View of Search Results
- List View of Search Results
- Table View of Search Results
- Aggregated Search Results
- Event Details
- Detection Details
- Entity Details
- Data Insights
- Export Search Results
- View and Download Exported Search Result Files
- Dashboard Visualizations
Search Results Navigation Bar
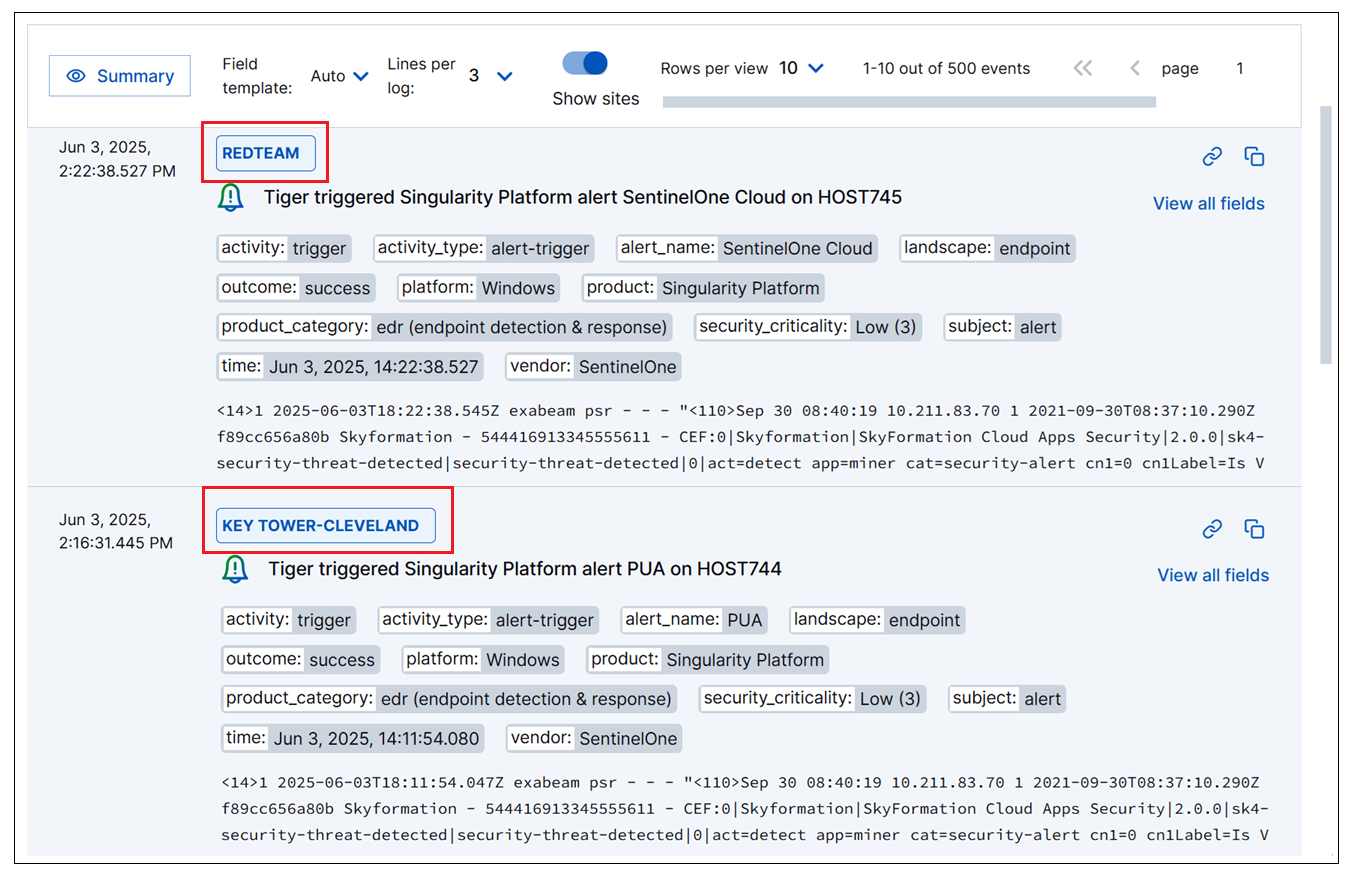
At the top of the search results is a navigation bar that allows you to format the look of the results as well as navigate between pages of the search results.

On the toolbar, the following options are available:
Summary – Click to open a new panel on the left showing a list of all parsed fields in the search results, and a count of unique values for each field. By default, these results are calculated for the first or last 500 results, depending on the sort option you query with. When opened, the Summary panel is pinned to the top of the left side of the search results page. To close it, click the Summary button again. For more information about the options available on the Summary panel, see Field Summary.
View Selector Icons – Click on a view selector icon to switch into a different view of the search results data. Options include (
 ) Timeline view, (
 ) List View, and (
 ) Table view.
Aggregation View – Click the Aggregation View icon icon (
 ) to view a high level summary of the search results. For more information about adding aggregation to your search results, see Aggregated Search Results.
Field Template – Click the drop down menu to select which field template should determine the selection of fields displayed for each event in the results. By default, the
Autotemplate is selected. For more information about selecting a different template, see Field Templates.Lines per Log – Click the drop down menu and select the number of log lines you want to display for each event in the results.
Show sites – Click the toggle to show or hide site tags from each event row in the results list. When the toggle is in the on position, any site names you have configured in your system will be displayed above the relevant event row. For more information about using tag names, see Define a Unique Site Name in theNew-Scale Security Operations Platform Guide.

Rows per view – Click the drop-down menu to select the number of rows you want to view per page.
Pagination arrows – Click the pagination arrows to scroll backwards and forwards through the pages of event results.
