- Search Overview
- Search Home Page
- Performing Searches
- Basic Search
- Advanced Search
- Advanced Search Building Blocks
- Running an Advanced Search Query
- Query Syntax
- Query by Subject
- Query by Vendor and Product
- Query by Field and Value
- Query by Context Table
- Query Using Regex
- Query Using Wildcards
- Free Text Search
- Query Using Advanced Query Language Operators
- Query Using Aggregation Functions
- Query Using Structured Fields
- Dynamic Field Extraction
- Natural Language Search
- Anomaly Search
- Refine a Search
- Context Tables in Search
- Search Best Practices
- Search Results
- Histogram View of Search Results
- Search Results Navigation Bar
- Timeline View of Search Results
- List View of Search Results
- Table View of Search Results
- Aggregated Search Results
- Event Details
- Detection Details
- Entity Details
- Data Insights
- Export Search Results
- View and Download Exported Search Result Files
- Dashboard Visualizations
Timeline View of Search Results
The Timeline view of search results is a valuable investigation tool that brings the timeline experience into the Search application. It's designed to present a narrative view of events that can simplify the task of finding risky or anomalous behaviors (detections). The primary goal of the Timeline view is to build a sequence of events that highlights where a detection has occurred, what source event it might be associated with, and within what context of normal events it was triggered. These functions make the Timeline view a good starting point to investigate risky or anomalous activity while also leveraging the granular filtering capabilities of the Search application.
The power of the Timeline view lies in its ability to intelligently connect detections to their underlying source events. Starting from the results that match your search query, the Timeline view expands to include connected events and detections, creating a more complete picture of activity in your environment. These connections are uncovered in both directions:
Detections – When the search identifies a detection, the Timeline view automatically includes the source event that triggered it, even if that source event did not technically match your search criteria. This provides immediate context into the root cause of the detection.
Events – When the search identifies an event, the Timeline includes any detections that were generated by that event. This highlights the security implications of any event that triggers a detection.
These intelligent, bi-directional correlations help you avoid the need to manually pivot to another view or perform additional searches. The full picture of activity in your environment is available in one place, including connections between events and detections.
Summary of Key Benefits
Key features of the Timeline view include the following:
Contextual Event Linking – The Timeline view automatically adds related source events or detections to the search results, even when they don't match the original query. This ensures you have a complete data set for analysis, without the need to run multiple searches or pivot away from the Timeline.
Visual Differentiation – The two-column display visually separates normal events from risky detections, making it easy to spot anomalies at a glance.
Granular Filtering – The full power of Search capabilities can be leveraged to filter the timeline to a precise level.
Flexible Investigation – Timelines can be built for any attribute or combination of attributes, from any perspective. A timeline can focus on a user activity, on specific IP addresses, on an IOC, on a rule, or any other entity.
Navigating the Timeline View
The Timeline view is visually designed to simplify the task of finding detections and the events they are associated with. Results are organized into two columns, an Events column on the left and a Detections column on the right.
You can efficiently scan the results to see where normal and abnormal activity has taken place. You can choose to toggle the view to display only events where detections are associated, or you can view the display with all events showing so that you can view detections in the context of the normal events around them.
 |
When you run a search, the results are displayed by default in the List view. To access the Timeline view, click the Timeline View icon (  ) just above the navigation header for the search results.
Note
The Timeline view is available only for a search with a time range of seven days or less. You can switch easily from the Timeline view to the List or Table views by clicking their respective icons:  (List View),
  (Table View).
You can interact with results in the Timeline view in a number of ways. The sections below provide more detail about each of the following portions of the Timeline view page:
Toolbar Options
When search results first display in the Timeline view, the toolbar above the results contains two rows. The top row contains the Summary button on the left and the view selector icons on the right. The second row of the toolbar displays page-specific options. To preserve viewing space as you scroll through the results, the toolbar collapses to one row. If you want to switch into a different view of the results, you'll need to return to the top of the page to redisplay the expanded version of the toolbar where the view selector icons are available.
 |
On the toolbar, the following options are available:
Summary – Click to open a new panel on the left showing a list of all parsed fields in the search results, and a count of unique values for each field. By default, these results are calculated for the first 500 results. When opened, the Summary panel is pinned to the top of the left side of the search results page. To close it, click the Summary button again. For more information about the options available on the Summary panel, see Field Summary.
View Selector Icons – Click on a view icon to switch into a different view of the search results data. Options include (
 ) Timeline view, (
 ) List view, and (
 ) Table view.
 Aggregation View – Click the Aggregation View icon (
 ) to view a high level summary of the search results. For more information about adding aggregation to your search results, see Aggregated Search Results.
Collapse all – Click to collapse any event rows where you have expanded the Show All Events option, or any detections where you have expanded the Show Associated Events option. This option is only visible if at least one event row or detection has been expanded.
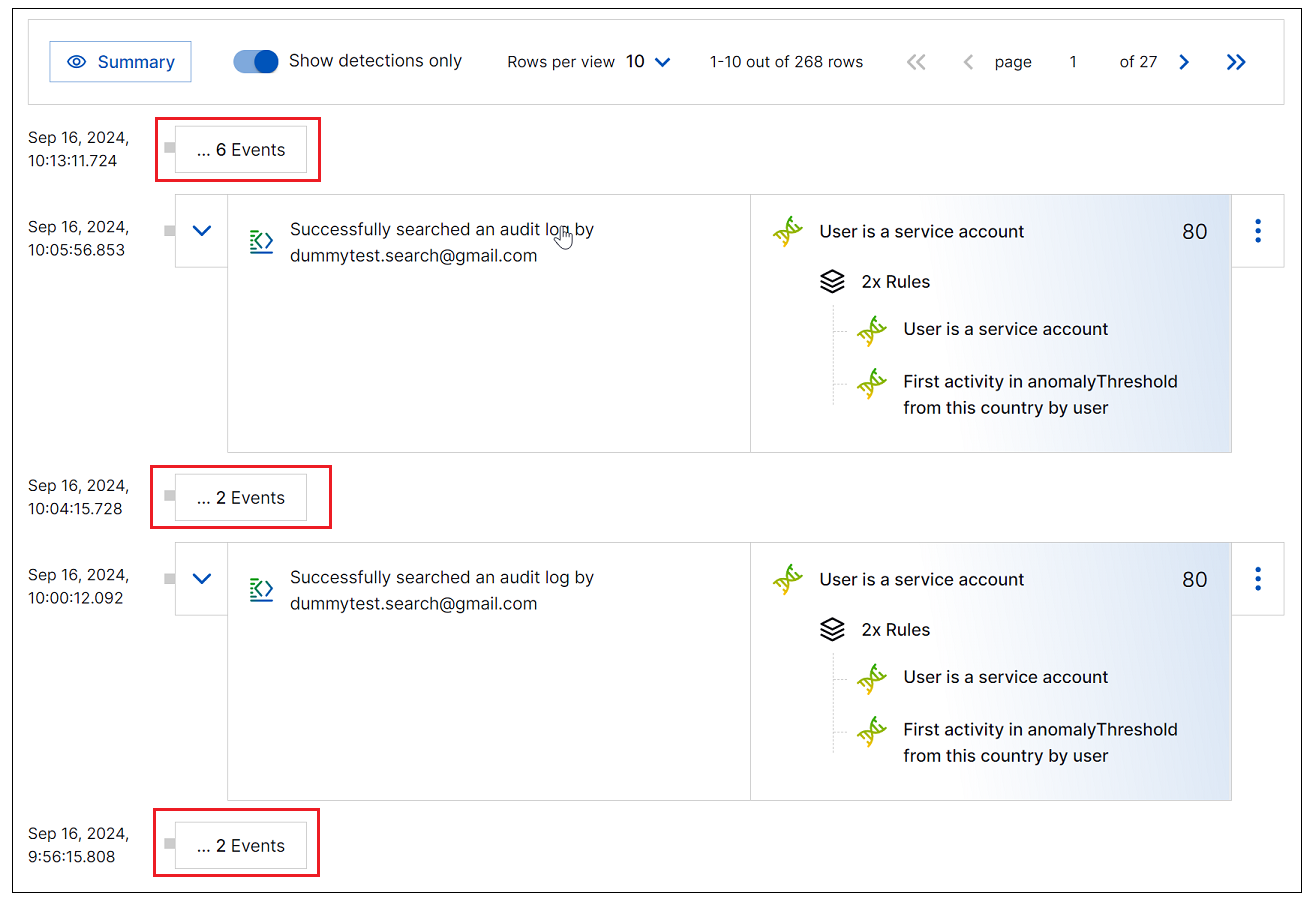
Show only rows with detections – Click this toggle to collapse the list of results so that only rows that include a detections are showing. Hidden results rows will be designated only by the number of rows hidden. You can toggle this view on and off.
Note
This toggle is disabled if there are no detections available within the first 500 results.
Show parsed fields – Click this toggle to show or hide the display of parsed fields for each event. With the toggle off, the timeline results are condensed and easier to scan. You can easily toggle this view on and off.
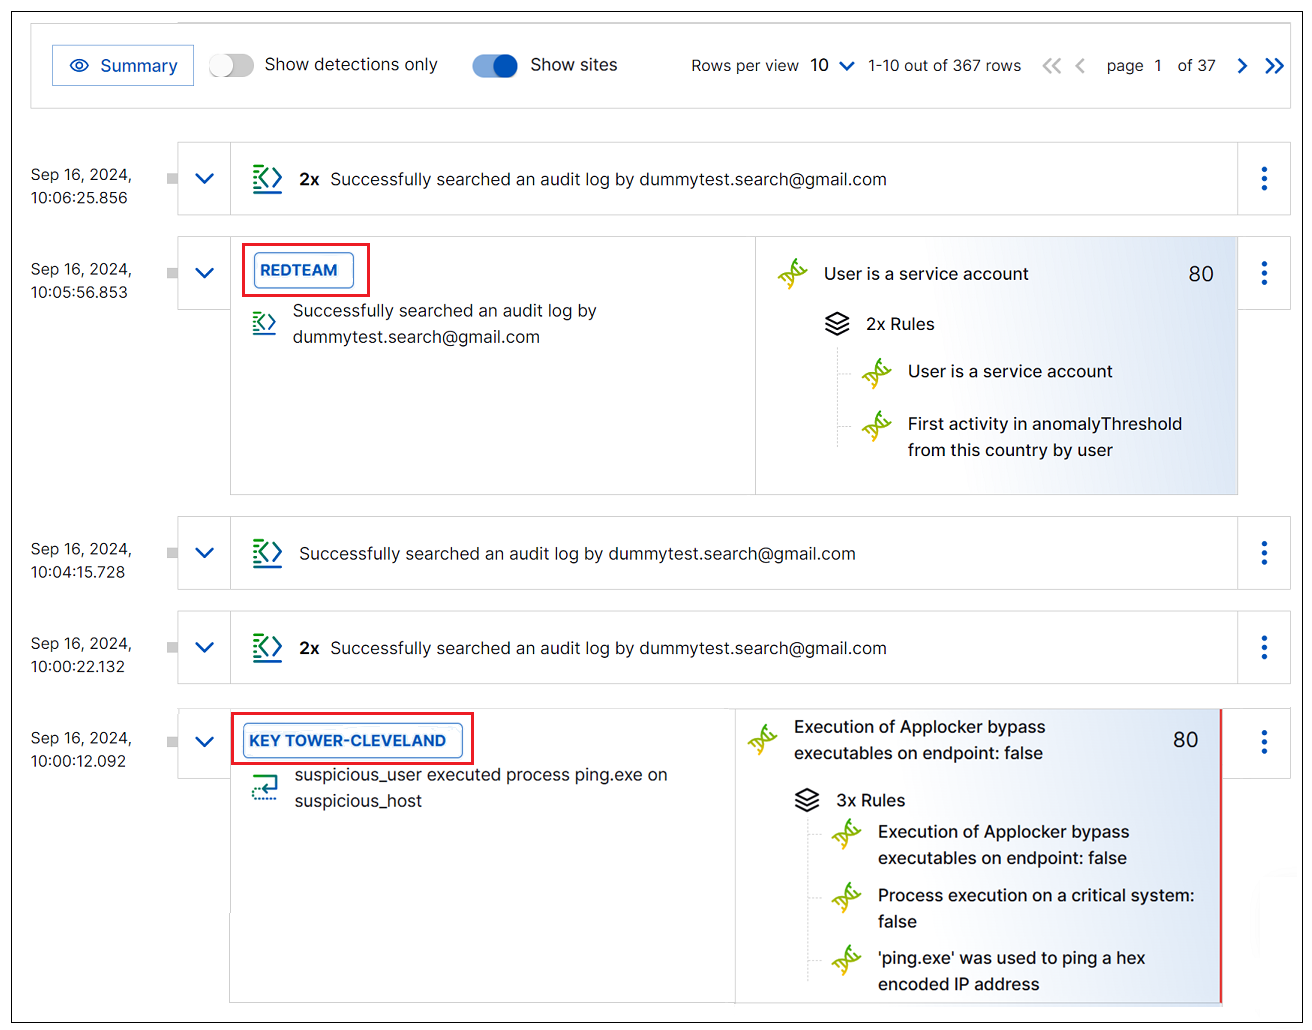
Show sites – Click this toggle to show or hide site tags from each event row in the results list. When the toggle is in the on position, any site names you have configured in your system will be displayed above the relevant event row. For more information about using tag names, see Define a Unique Site Name in theNew-Scale Security Operations Platform Guide.
Note
The Show sites toggle is displayed only when site tags are configured.
Rows per view – Click the drop-down menu to select the number of rows you want to view per page.
Tip
In the Timeline view, similar events are aggregated for display in groups. As a result, one row in the results data can represent more than a single event. Keep this in mind when configuring the Rows per View number. It does not align with how many events are represented per page, and in fact, there can be many more events per page than the number of rows. For more information about how events are grouped, see the Events in the Timeline section below.
Pagination arrows – Click the pagination arrows to scroll backwards and forwards through the pages of event results.
Events in the Timeline
Timeline events are listed chronologically, with the most recent or the oldest events at the top, depending on the sort order you ran your query with. Events are listed in the Events column on the left side of each row in the Timeline view. Each event has a natural language title that provides a simple description of the event. In cases where no event title is available, or not enough fields were parsed, the event title defaults to the subject of the event. Each event title also includes an icon that indicates the event type.
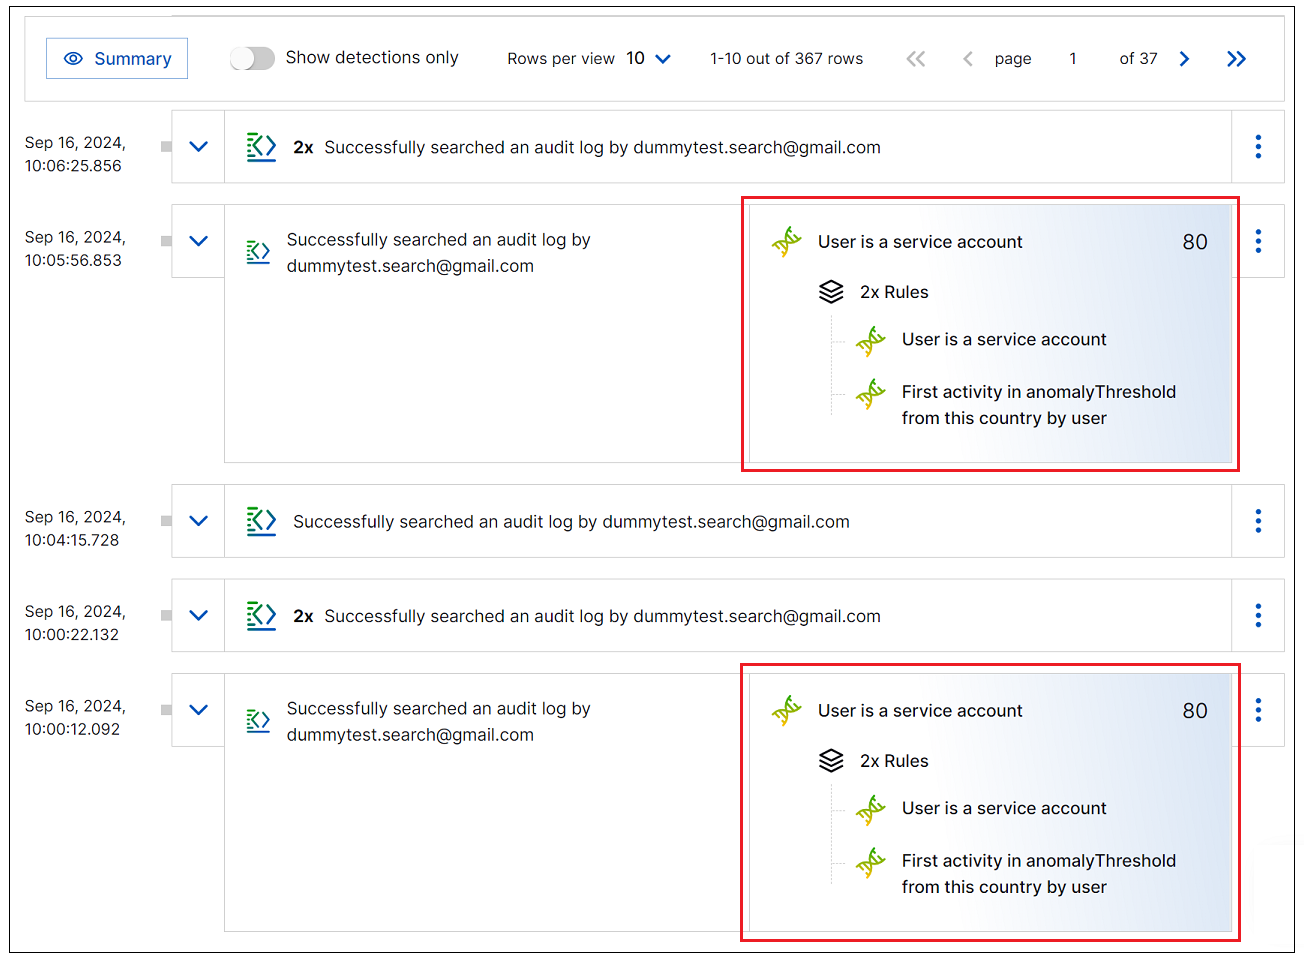
To reduce scrolling while looking for detections, events that are similar are aggregated into groups. Event groups are indicated by a <n>X designation to the left of the event title. You can click the Show All Events link to expand and view the individual events.
 |
Events are grouped automatically according to the following logic:
The events have identical titles.
The events occur within the same minute, even if they are non-consecutive.
Non-consecutive events can only be grouped together if any intervening events are not associated with a detection event. If an intervening event has a detection, the events with the same title are split into separate groups in order to preserve the order of events before and after the detection.
In a row representing a group of events, toggle the Show All Events option to display each event in an indented list. To close the list of all events, click the Hide All Events option in the event box.
You can interact with events in the following ways:
View Parsed Fields – Click the Show parsed fields toggle at the top of the results list to show or hide the parsed fields for each event. With the toggle off, the timeline results are condensed and easier to scan. You can easily toggle this view on and off.
Click on any parsed field to display possible options for the field (options may vary depending on the query):
Click View User Entity or View Device Entity if a parsed attribute is associated with a user or device entity. The User Entity Details or Device Entity Details panel opens and displays the information stored about the selected entity in the Attack Surface Insights application. For more information about what the Entity Details panel shows and how to use it, see View Entity Details in the Attack Surface Insights Guide.
Click Copy to copy the value of the field to the clipboard.
Click Visualize Field to pivot immediately to the Dashboard application, which opens in the visualization editor view with the information from your search query preconfigured.
Use the Query Operators to add parsed fields to your query or to exclude them. Available operators include AND, AND NOT, or OR.
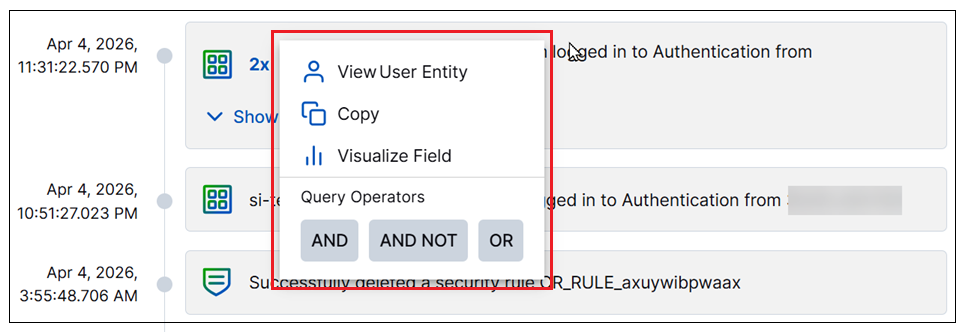
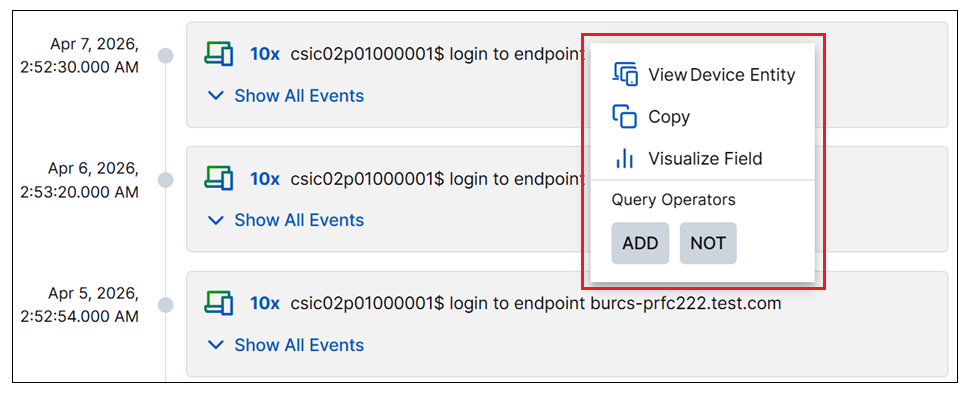
If the title of an event includes any dynamic fields, you can click on these dynamic fields for additional options, as with the parsed fields, such as viewing entity details, copying field values, visualizing them, or adding them to the query.

View Event Details – To open a Details panel with the Event tab displayed, click on any event box. The Events tab provides detailed information about the event including the raw log message and a list of parsed fields for the event. Note that if an event is part of a group, the details for each individual event is displayed on numbered tabs in the Details panel.
View Detection Details – If an event is associated with one or more detection events (displayed in the Detections column on the right of the same row), you can click on the detection box to open a Details panel with a Detection tab displayed. The Detection tab provides details about the rules that triggered the detection. The tab also includes a full raw log message and the entire list of parsed fields from the event. Note that if an event includes multiple detections, the details for each detection are displayed on numbered tabs in the Details panel.
View Entities – If an event includes parsed user or device entity fields, you can view an Entities tab, in the Details panel, that lists all of the entities associated with the event. To open the Entities tab, click on an event box to open the Details panel and navigate to the Entities tab.
For each entity listed in the Entities tab, you can opt to open an Entity Details panel that displays extensive information stored about the selected entity in the Attack Surface Insights application. For more information about what the Entity Details panel shows and how to use it, see View Entity Details in the Attack Surface Insights Guide.
View Data Insights – If the event includes users or devices that have been parsed, you can view Data Insights about those entities. Click on an event box to open the Details panel and navigate to the Data Insights tab.
Copy Raw Log Data – To copy an entire raw log, click an event or detection box to open the Details panel. Scroll to the Raw Log section of the panel and click the Copy Raw Log to Clipboard (
 ) icon.
Detections in the Timeline
When an event is evaluated as risky or anomalous, according to conditions configured in correlation, analytics, or anomaly rules, a detection event is generated. In the Timeline view, if an event in the search results has triggered a detection, the detection event is displayed in the Detections column on the right-hand side of the same event row. This visual representation makes it easy to see the connection between detections and their associated events.
Note
If more than one event triggers the same detection, the detection is displayed only on the latest chronological event. However, you can use the Show Associated Events option on that detection to view a list of other associated events.
In some cases, a detection event is displayed in the Detections column because it meets the criteria of your search query in its own right, but the event that triggered it falls outside of the search criteria. In such cases, to create a full picture of the data, the Timeline view provides that source event in the Events column anyway.
There are some scenarios where the Events/Detections layout may not appear as usual. They include the following:
Detections with no associated trigger event – This scenario can occur when a correlation rule condition is set to trigger due to a lack of events. For example, a rule condition may be set to alert if zero of the defined events occurred in the past 20 minutes. When this type of detection appears in the Timeline search results, the detection is displayed alone in the Detections column of the results row and a note appears in the Events column indicating that there is no source event to display.

Detections triggered by rule test mode – This scenario can occur when analytics rules need to be tested before enabling them for use in an environment. Build a query that includes
activity_type: "rule-trigger-test"to return results where the rules are in Test Mode. While the rules are in Test Mode, these results are displayed in the Events column. After the rules have been enabled, any detection they trigger are displayed in the Detections column.For more information about rule testing, see Test Analytics Rules in the Threat Detection Management Guide.
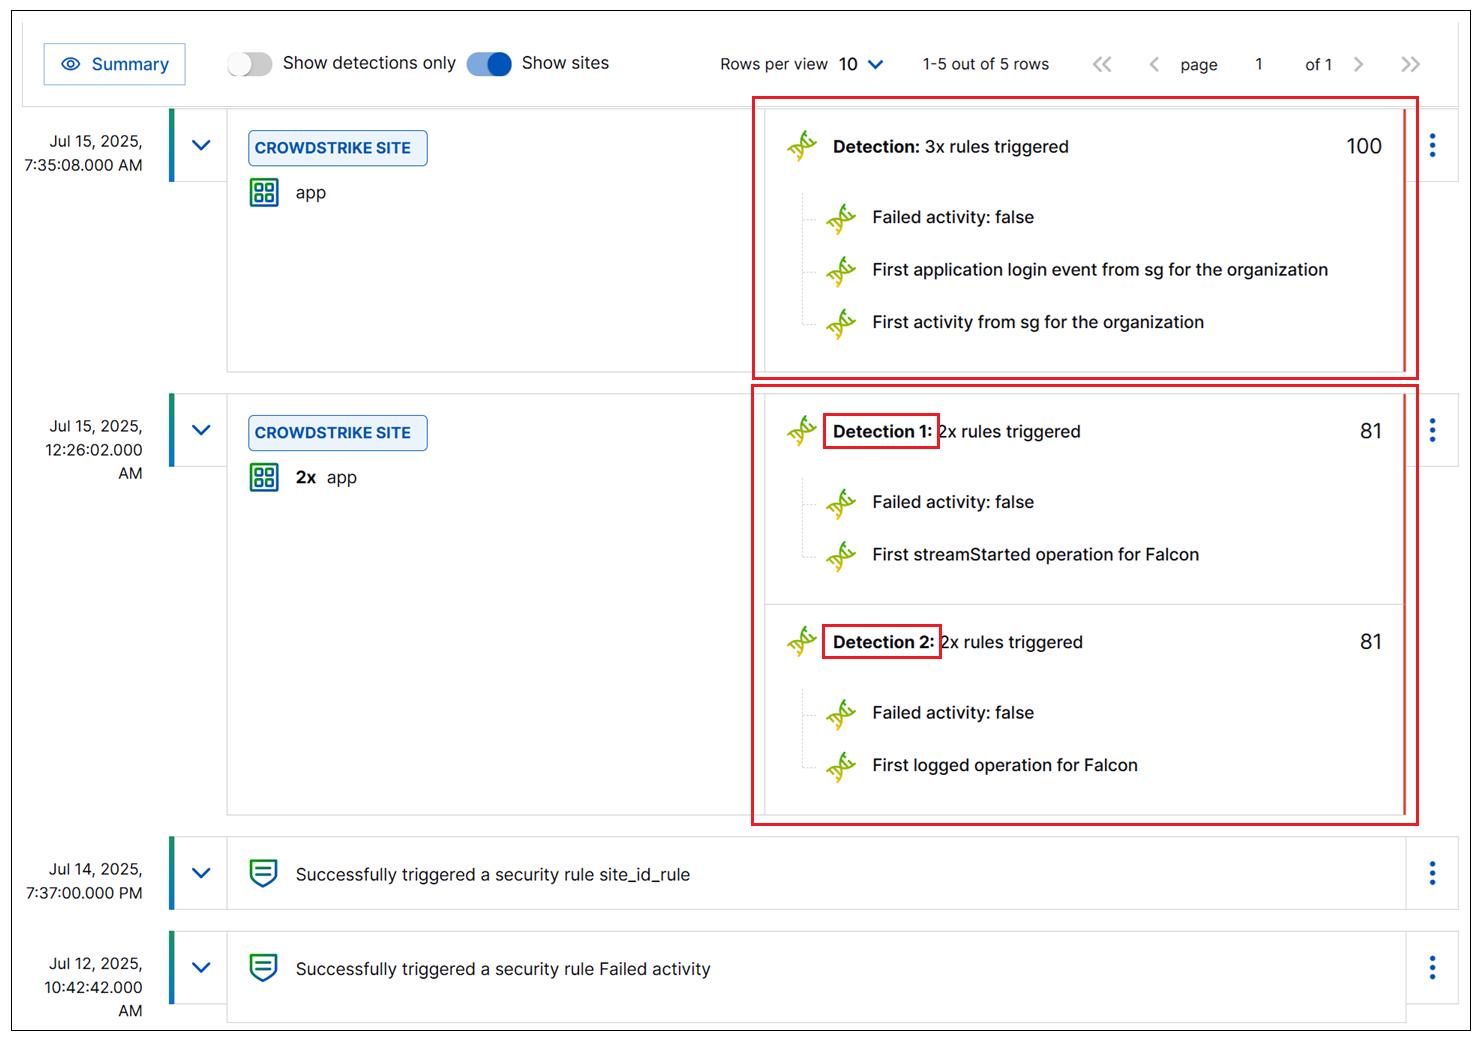
Each detection is displayed with a list of the primary rules associated with the detection. These primary rules are the rules that trigger the detection. They do not include context-based rules that contribute to the detection score. There are usually one or two primary rules. You can view additional context-based rules by opening the Detection tab in the Details panel.
Tip
By default, rules on detection events are displayed with only the rule reason field showing (rules.rule_reason). However, you can configure the display of rules to show only the rule name field instead (rules.rule) or to show both fields, with the rule name as a heading and the rule reason below it. For more information about how to configure the rule display options, see Search Application Preferences.
In the top right corner of the detection box a risk score appears, from 0 to 100, that indicates the level of risk the rules represent. If there are multiple detections associated with the same event, a numbered Detection label appears above the rules (Detection 1, Detection 2, etc.), for easy identification, especially when viewing them in the Detections tab.
 |
You can interact with detections in the following ways:
View Detection Details – To open the Details panel with the Detection tab displayed, click on any detection box. The Detection tab includes information including endpoints, use cases, MITRE ATT&CK® tactics and techniques, triggered rules, the raw log, and parsed fields. If there are multiple events associated with a single event, click on a specific detection box and the Details panel opens to display the numbered tab for that detection.
Show Associated Events – In the Timeline view, if a specific detection is triggered by multiple events, the display of search results is kept simple and uncluttered by showing the detection only on the latest chronological event. However, you can click the Show Associated Events link to open an expanded list of all the other events that are associated with the detection. This link provides a way to view a list of the multiple events that triggered the same detection.
You can scroll through the list of associated events and interact with them the same as any other events in the Timeline view. Alternately, click the
 Open in New Tab link to view the list of associated events in a search query that automatically populates and runs in a new tab.
To close the list of associated events, click the Hide Associated Events option in the detection box.

Copy Raw Log Data – To copy an entire raw log, click an event or detection box to open the Details panel. Scroll to the Raw Log section of the panel and click the Copy Raw Log to Clipboard (
 ) icon.
