- Search Overview
- Search Home Page
- Performing Searches
- Basic Search
- Advanced Search
- Advanced Search Building Blocks
- Running an Advanced Search Query
- Query Syntax
- Query by Subject
- Query by Vendor and Product
- Query by Field and Value
- Query by Context Table
- Query Using Regex
- Query Using Wildcards
- Free Text Search
- Query Using Advanced Query Language Operators
- Query Using Aggregation Functions
- Query Using Structured Fields
- Dynamic Field Extraction
- Natural Language Search
- Anomaly Search
- Refine a Search
- Context Tables in Search
- Search Best Practices
- Search Results
- Histogram View of Search Results
- Search Results Navigation Bar
- Timeline View of Search Results
- List View of Search Results
- Table View of Search Results
- Aggregated Search Results
- Event Details
- Detection Details
- Entity Details
- Data Insights
- Export Search Results
- View and Download Exported Search Result Files
- Dashboard Visualizations
Event Details
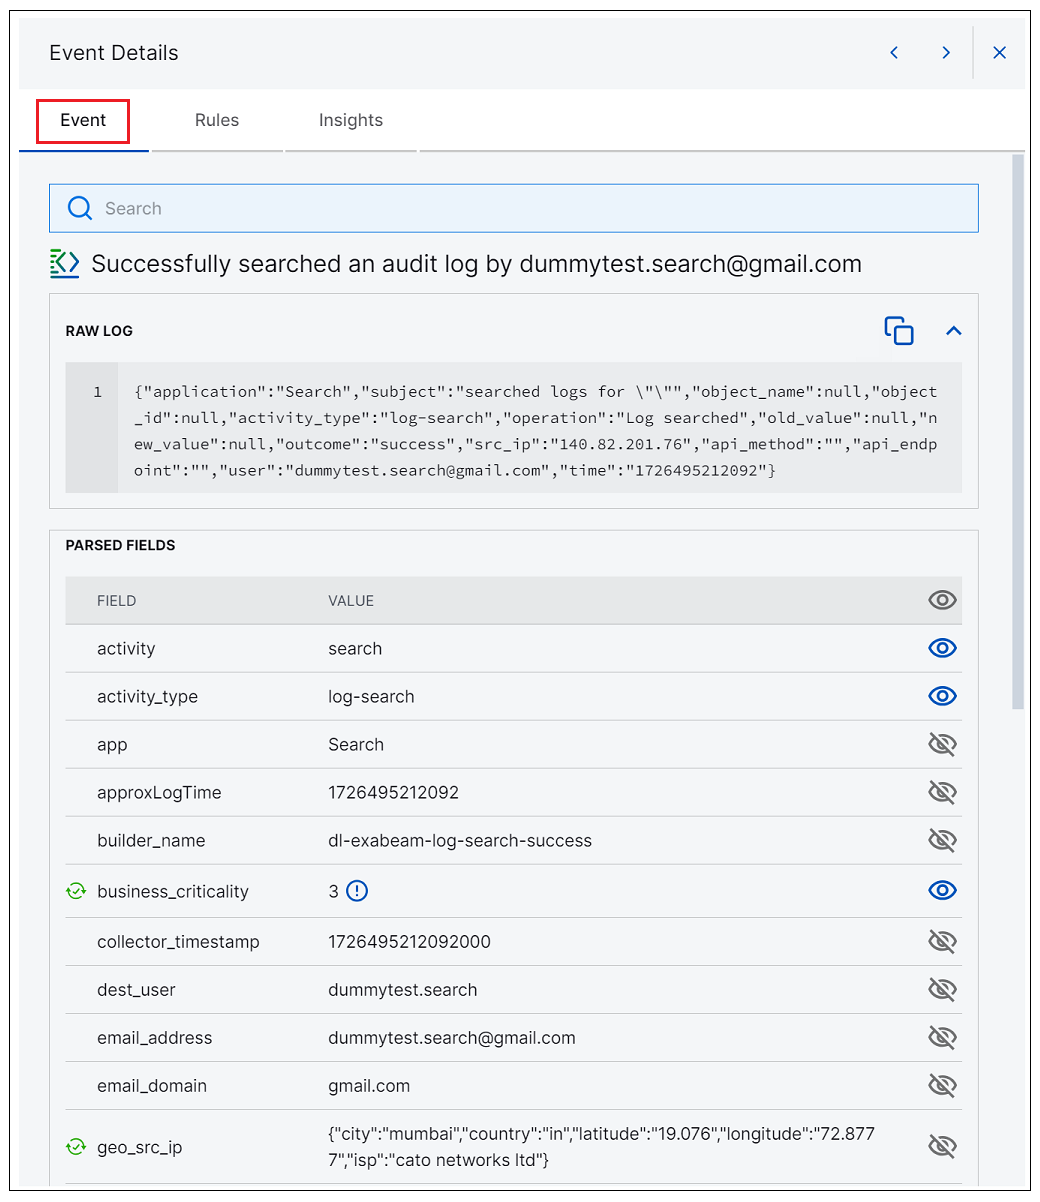
For any event in the search results, you can open a Details panel. The panel opens on the right with the Event tab displayed. It includes the full raw message of the event and the entire list of parsed fields for that event.
Accessing Event Details
To access Event Details from different results views:
Timeline View – Click on any event box in a results row.
List View – Click Event Details in the upper right corner of an event row.
Table View – Click on the Details link on the far right end of an event row.
 |
Note
If an event does not specify a time zone, the time in the parsed fields is reported in the local time zone. In the raw log message, the time remains as is.
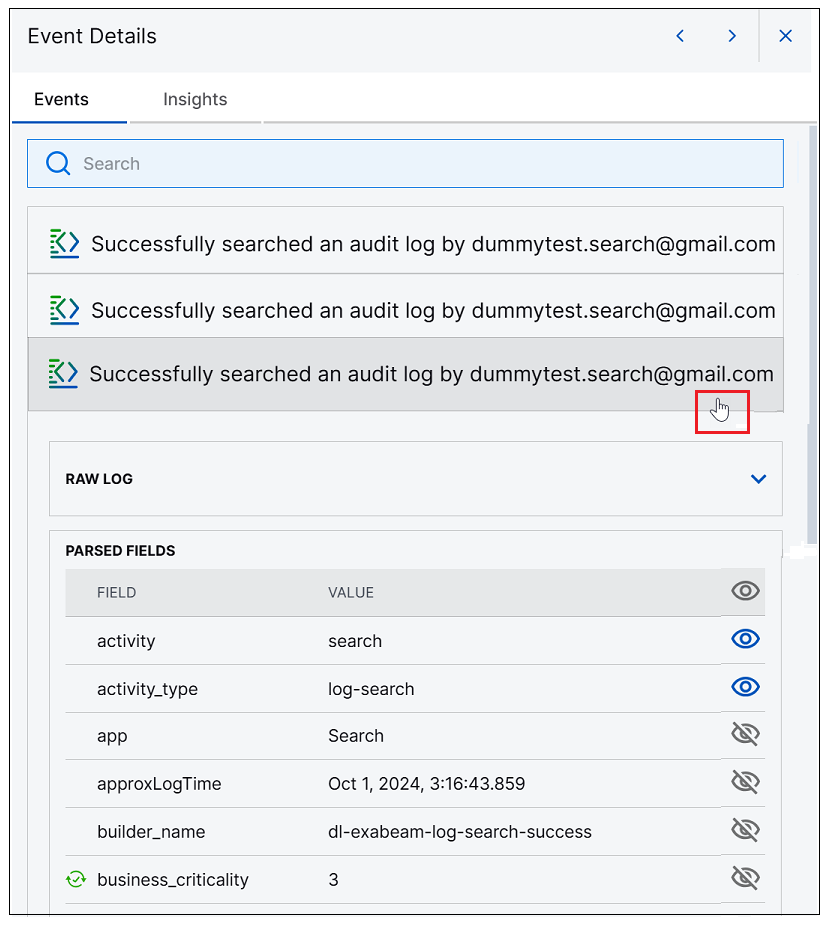
If you are viewing results in the Timeline view, and the event for which you are viewing details is part of a group, the Details panel provides a tabbed view of details for each event. You can click through the number Event tabs to view all of the event details. In this way you can scroll through all of the grouped events without leaving the Details panel. When displayed, each Event tab is displayed with a raw log message and a list of parsed fields.
 |
Interacting with Event Details
You can interact with information on an Event tab in the ways described below.
Use the
 icons at the top of the panel to navigate between event rows in the Search results.
Click the
 icon to close the Details panel and return to the Search results.
Use the Search field at the top of the panel to search both the raw message and the list of parsed fields.
Use the numbered Event tabs below the Search field to view event details for different events that are part of a group in the Timeline view.
Use the arrow (
 ) icon in the top right corner of the Raw Log section to collapse and expand the log line. You can also click Show full log to expand the full log message.
Click the Copy Raw Log to Clipboard icon (
 ) in the Raw Log section to copy the log line. This icon is only displayed when you hover your cursor over the Raw Log section.
Click the pin icon
 on the right side of any field in the Parsed Fields list, to toggle the field visibility on or off in the search results. Pinned fields are automatically displayed in the top portion of the Parsed Fields list. The unpinned fields are listed alphabetically after the pinned fields.
Toggling field visibility changes whether or not a field is displayed in parsed fields on the Timeline or List views of results and in the columns on the Table view of results. When visibility for a field is on, the pin icon appears blue (
 ). When visibility for a field is off, no pin appears until you hover your cursor to display the grey pin icon (
 ), which you can click to toggle visibility on.
Note
Fields that are dynamically extracted (by using RGX_EXTRACT syntax in the query) cannot be toggled for visibility. They are always displayed in the results and are presented in a purple chip with the following icon:

Example:

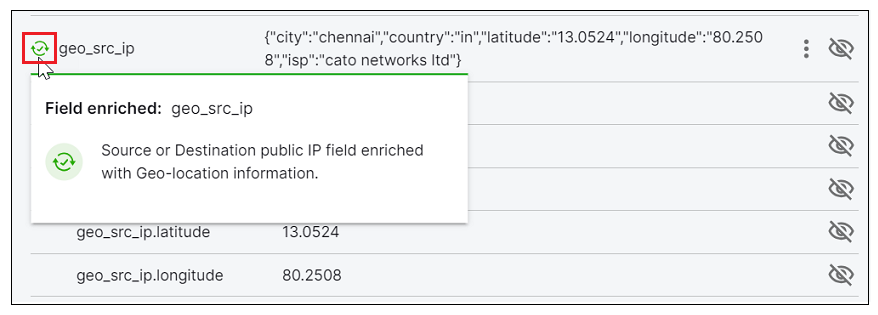
Click the enrichment indicator icon (for example:
 ) next to any field that contains enriched data to display an enriched field tooltip. The tooltip explains the type and source of the enriched data.
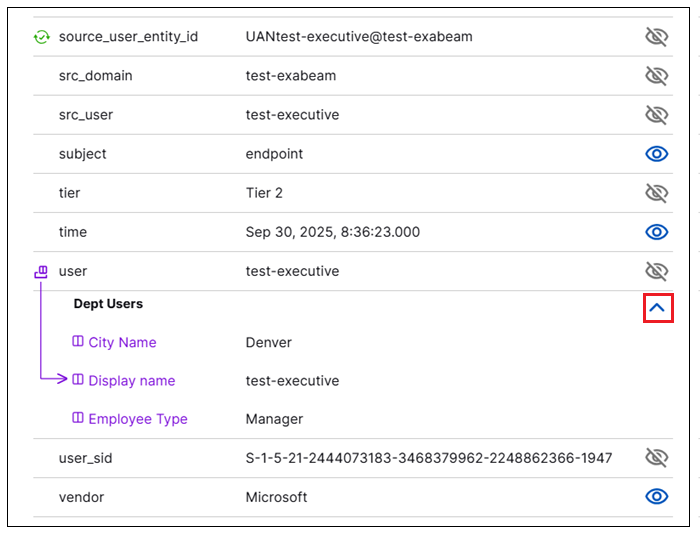
Click the collapse (
 ) or expand (
 ) arrow to hide or display information about other column values for a field who's value was extracted from a context table record. In the Parsed Fields list, such fields are displayed with a table field icon (
 ) and a special format that includes the values for other columns for the same record in the context table. The arrow points to the specific column the field value was extracted from. The information is expanded by default but you can use the arrow to collapse it. For more information, see Context Tables in Search.
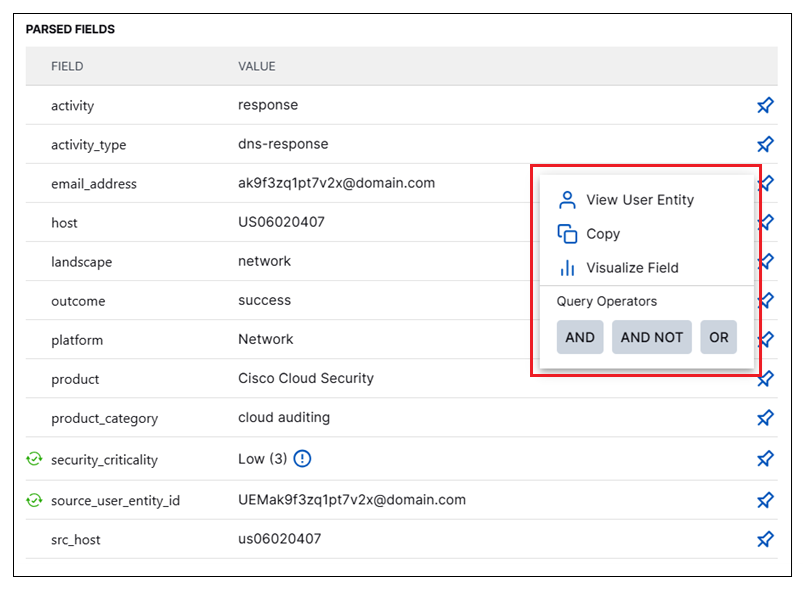
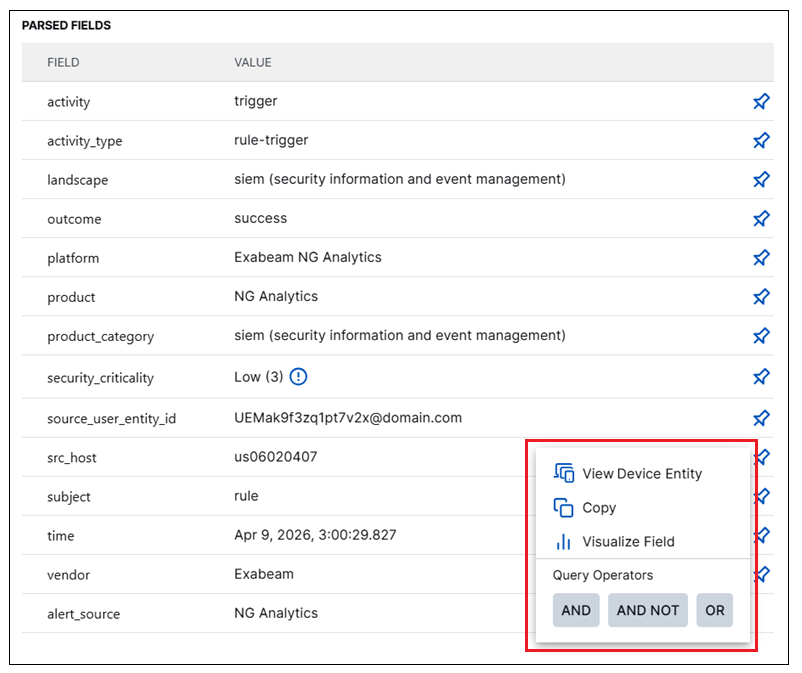
To display additional options for each field in the list, click the drop-down menu icon (
 ) that appears when you hover your cursor over a field row.
Depending on whether or not the field was included in the original query, the options below are available:
Click View User Entity or View Device Entity if a parsed attribute is associated with a user or device entity. The User Entity Details or Device Entity Details panel opens and displays the information stored about the selected entity in the Attack Surface Insights application. For more information about what the Entity Details panel shows and how to use it, see View Entity Details in the Attack Surface Insights Guide.
Click Copy to copy the value of the field to the clipboard.
Click Visualize Field to pivot immediately to the Dashboard application, which opens in the visualization editor view with the information from your search query preconfigured.
Use the Query Operators to add parsed fields to your query or to exclude them. Available operators include AND, AND NOT, or OR.
Click Remove From Query to remove the field from your query. (Available only for field values that are already included in the query.)
