- Search Overview
- Search Home Page
- Performing Searches
- Basic Search
- Advanced Search
- Advanced Search Building Blocks
- Running an Advanced Search Query
- Query Syntax
- Query by Subject
- Query by Vendor and Product
- Query by Field and Value
- Query by Context Table
- Query Using Regex
- Query Using Wildcards
- Free Text Search
- Query Using Advanced Query Language Operators
- Query Using Aggregation Functions
- Query Using Structured Fields
- Dynamic Field Extraction
- Natural Language Search
- Anomaly Search
- Refine a Search
- Context Tables in Search
- Search Best Practices
- Search Results
- Histogram View of Search Results
- Search Results Navigation Bar
- Timeline View of Search Results
- List View of Search Results
- Table View of Search Results
- Aggregated Search Results
- Event Details
- Detection Details
- Entity Details
- Data Insights
- Export Search Results
- View and Download Exported Search Result Files
- Dashboard Visualizations
Histogram View of Search Results
At the top of the Search results page, the total number of results is displayed along with a date range histogram that provides a graphical representation of the results.

The date histogram is a bar graph that shows the count of events, over the selected time range, that matched the search criteria and time filters. The histogram lists the time range you’re currently exploring, as well as the interval range represented by each bar. The amount of time associated with each bar adjusts dynamically based on the time range of your search. Each bar may represent minutes, hours, or days in the timeline depending on how wide the search range.
Click Hide Histogram/Show Histogram to hide or display the histogram bar graph.
Note
If an event does not specify a timezone, the time is reported in UTC.
Note
To accommodate very large log data volumes, the timeline, by default, initially displays only the last 2 weeks. Click the Fetch more  icon to continue building out the Histogram.
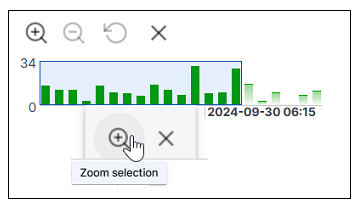
To zoom into a specific area of the histogram, you can narrow the time filter as follows:
Click an individual bar that represents the time interval you want to zoom in on, OR click and drag to select a specific timespan.

Click the Zoom selection icon (
 ) to zoom in on the selected time interval. The histogram changes to reflect a zoomed in view of the selected bar or area. To revert the histogram to its original time frame, click the clear filter icon
  .
.
