- Search Overview
- Search Home Page
- Performing Searches
- Basic Search
- Advanced Search
- Advanced Search Building Blocks
- Running an Advanced Search Query
- Query Syntax
- Query by Subject
- Query by Vendor and Product
- Query by Field and Value
- Query by Context Table
- Query Using Regex
- Query Using Wildcards
- Free Text Search
- Query Using Advanced Query Language Operators
- Query Using Aggregation Functions
- Query Using Structured Fields
- Dynamic Field Extraction
- Natural Language Search
- Anomaly Search
- Refine a Search
- Context Tables in Search
- Search Best Practices
- Search Results
- Histogram View of Search Results
- Search Results Navigation Bar
- Timeline View of Search Results
- List View of Search Results
- Table View of Search Results
- Aggregated Search Results
- Event Details
- Detection Details
- Entity Details
- Data Insights
- Export Search Results
- View and Download Exported Search Result Files
- Dashboard Visualizations
List View of Search Results
After you have run a search, a listing of the events matching your search criteria is shown at the bottom of the Search home page.
The default view of search results is the List view, however, you can switch to the Timeline or Table views by clicking their respective icons:  (Timeline View),
  (Table View).
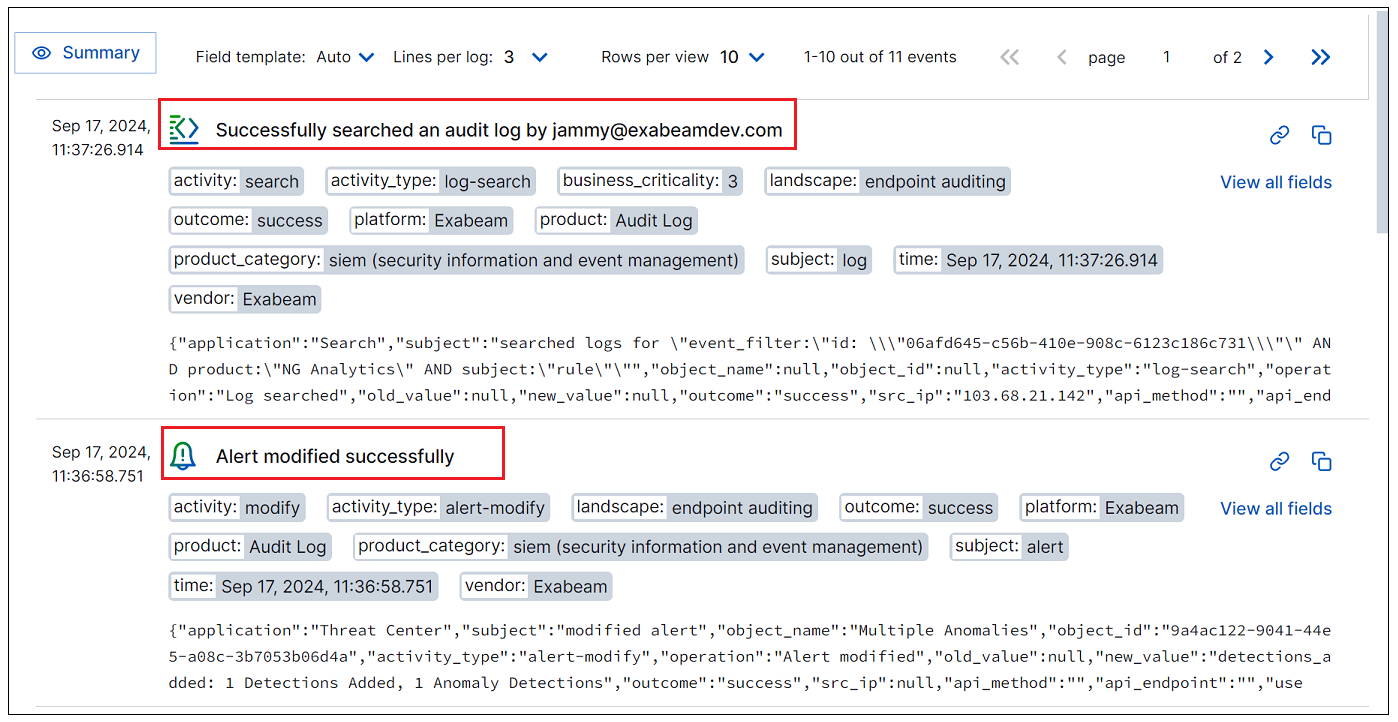
Each event has a natural language title that provides a simple description of the event. Each event title includes an icon that indicates the event type. In cases where no event title is available, or not enough fields were parsed, the event title defaults to the subject of the event.
 |
You can interact with results in the List view in a number of ways. The sections below provide more detail about each of the following portions of the List view page:
Toolbar Options
When search results first display in the List view, the toolbar above the results contains two rows. The top row contains the Summary button on the left and the view selector icons on the right. The second row of the toolbar displays page-specific options. To preserve viewing space as you scroll through the results, the toolbar collapses to one row. If you want to switch into a different view of the results, you'll need to return to the top of the page to redisplay the expanded version of the toolbar where the view selector icons are available.
 |
On the toolbar, the following options are available:
Summary – Click to open a new panel on the left showing a list of all parsed fields in the search results, and a count of unique values for each field. By default, these results are calculated for the first or last 500 results, depending on the sort option you query with. When opened, the Summary panel is pinned to the top of the left side of the search results page. To close it, click the Summary button again. For more information about the options available on the Summary panel, see Field Summary.
View Selector Icons – Click on a view selector icon to switch into a different view of the search results data. Options include (
 ) Timeline view, (
 ) List View, and (
 ) Table view.
Aggregation View – Click the Aggregation View icon icon (
 ) to view a high level summary of the search results. For more information about adding aggregation to your search results, see Aggregated Search Results.
Field Template – Click the drop down menu to select which field template should determine the selection of fields displayed for each event in the results. By default, the
Autotemplate is selected. For more information about selecting a different template, see Field Templates.Lines per Log – Click the drop down menu and select the number of log lines you want to display for each event in the results.
Show sites – Click the toggle to show or hide site tags from each event row in the results list. When the toggle is in the on position, any site names you have configured in your system will be displayed above the relevant event row. For more information about using tag names, see Define a Unique Site Name in theNew-Scale Security Operations Platform Guide.
Note
The Show sites toggle is displayed only when site tags are configured.
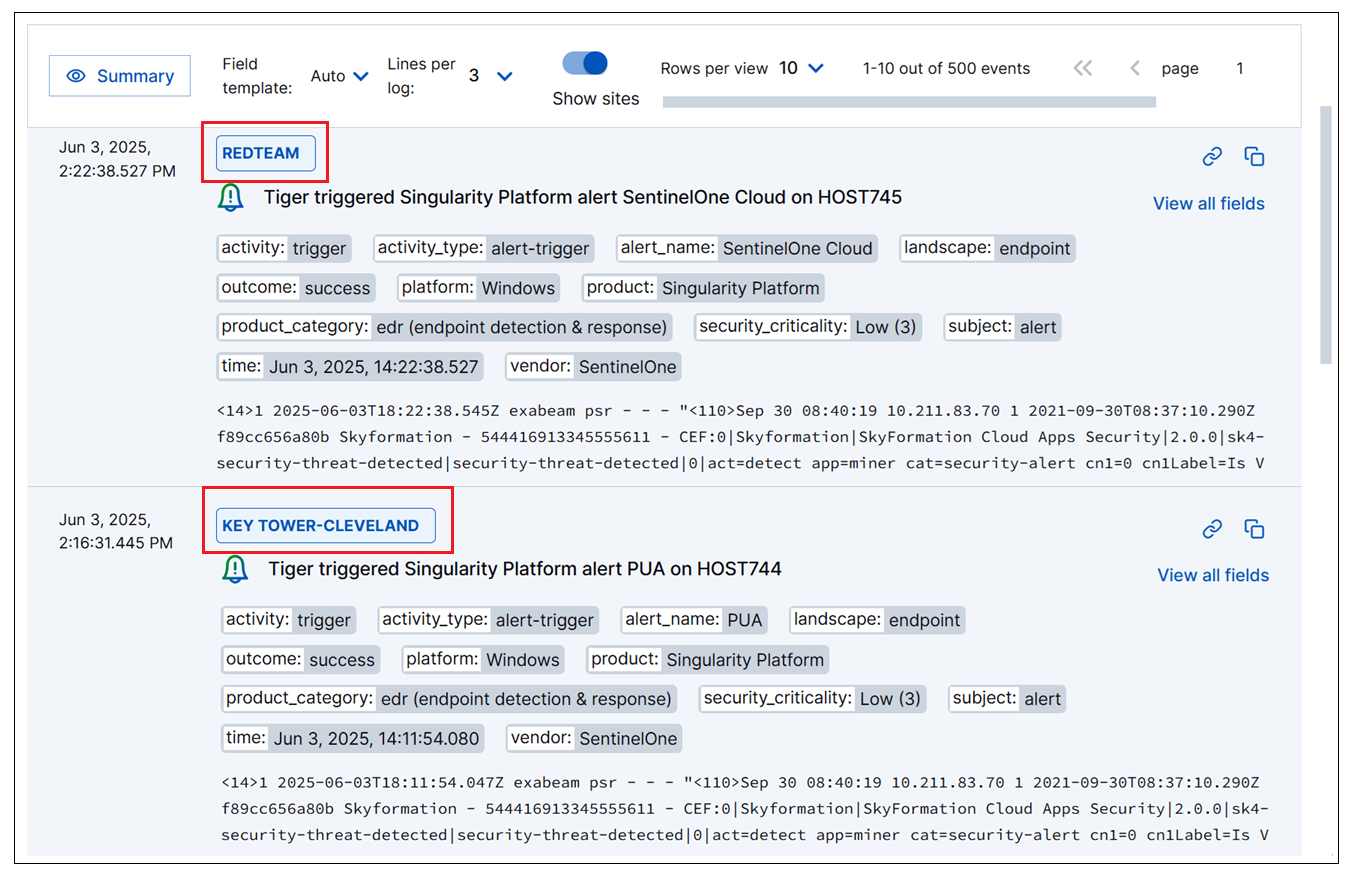
Rows per view – Click the drop-down menu to select the number of rows you want to view per page.
Pagination arrows – Click the pagination arrows to scroll backwards and forwards through the pages of event results.
Events in the List View
List view events are displayed chronologically, with the most recent or the oldest events at the top, depending on the sort order you ran your query with. Each event has a natural language title that provides a simple description of the event. In cases where no event title is available, or not enough fields were parsed, the event title defaults to the subject of the event. Each event title also includes an icon that indicates the event type.
You can interact with each event in the following ways:
Click on any parsed field to display possible options for the field (options may vary depending on the query):
Click View User Entity or View Device Entity if a parsed attribute is associated with a user or device entity. The User Entity Details or Device Entity Details panel opens and displays the information stored about the selected entity in the Attack Surface Insights application. For more information about what the Entity Details panel shows and how to use it, see View Entity Details in the Attack Surface Insights Guide.
Click Copy to copy the value of the field to the clipboard.
Click Visualize Field to pivot immediately to the Dashboard application, which opens in the visualization editor view with the information from your search query preconfigured.
Use the Query Operators to add parsed fields to your query or to exclude them. Available operators include AND, AND NOT, or OR.
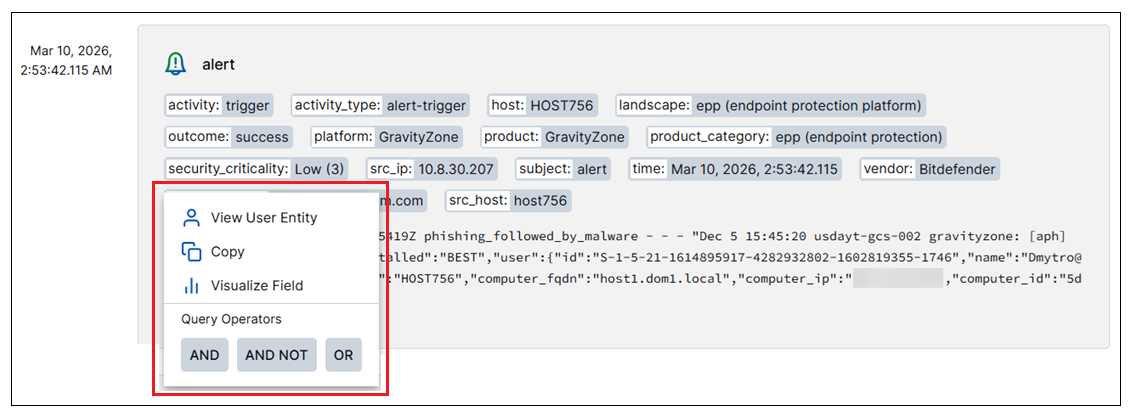
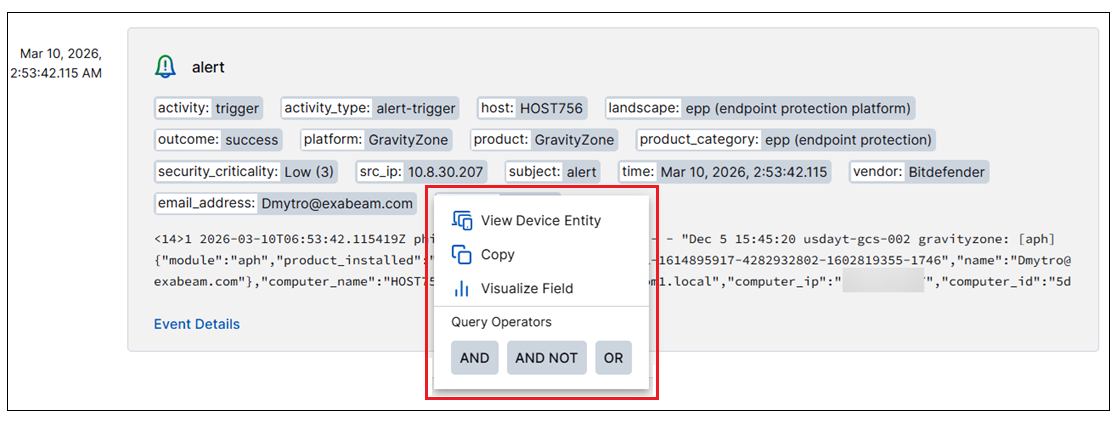
If the title of an event includes any dynamic fields, you can click on these dynamic fields for additional options, as with the parsed fields, such as viewing entity details, copying field values, visualizing them, or adding them to the query.

To copy a link to a specific event or detection, hover your cursor over the row and click the Copy Link (
 ) icon that appears in the lower right corner.
To copy the raw log data for an event or detection, hover you cursor over the row and click the Copy Raw Log (
 ) icon that appears in the lower right corner.
View Event Details – To view detailed information about the event, click the Event Details link to open a Details panel on the right. The panel opens with the Event tab displayed. It includes a full raw log message and the entire list of parsed fields from the event. For more information about working with this tab, see Event Details.
Note
If the event where you want to view details is a detection event, a Detection Details link is available instead. It opens the Details panel opens with a Detection tab displayed. It includes the raw log and the list of parsed fields, but also includes the rules that triggered the detection event.
View Entities – If an event includes parsed user or device entity fields, you can view an Entities tab, in the Details panel, that lists all of the entities associated with the event. You can open the Entities tab in one of the following ways:
Click the Event Details link to open the Details panel with the Event tab displayed. Click on the Entities tab.
On a detection event, click the Show Associated Events link at the bottom to expand a list of associated events. On an associated event, click the Event Details link to open the Details panel. Then click on the Entities tab.
For each entity listed in the Entities tab, you can opt to open an Entity Details panel that displays extensive information stored about the selected entity in the Attack Surface Insights application. For more information about what the Entity Details panel shows and how to use it, see View Entity Details in the Attack Surface Insights Guide.
View Data Insights – If the event includes users or devices that have been parsed, you can drill down into the data for more insights about those entities as follows. Click the Event Details link or the Detection Details link to open the Details panel. Then click on the Data Insights tab. For more information about working with the this tab, see Data Insights.
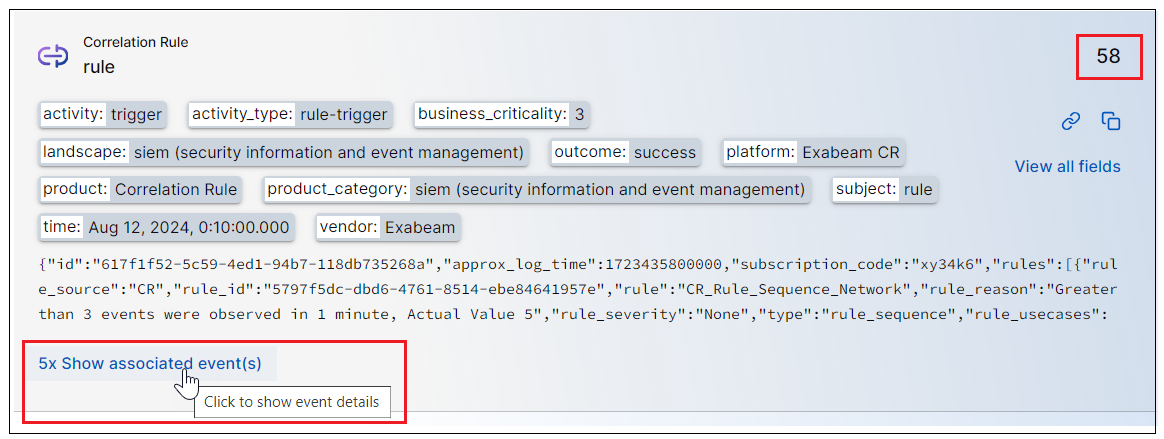
View Associated Events – If an event in your Search results is a detection event, you can expand it to view any associated events it might be linked to. A detection event is an event that has been automatically triggered because it meets the criteria of one or more rules that are looking for possible security threats or anomalous behavior. You can recognize detection events by the risk score in the top right corner of the event row.
Click Show associated events to expand a list of events that are associated with a specific detection event in the Search results. This option is available for Correlation Rule events and Exabeam Anomaly events. There can be multiple events associated with a rule-trigger event and, when expanded, they are all displayed in an indented list under the rule-trigger event. In this way, the relationship between detections and their associated events is easily visible. You can scroll through the list of associated events and interact with them the same as any other events in the List view.
To collapse the display of the associated events, click the Show associated events link again.
Note
In addition to one detection event being associated with multiple events, it can also be true that a single event can be associated with multiple detection events. However, this relationship is not viewable in the List view of Search results. To view all of the detections associated with a single event, switch to the Timeline view (
 ). The Timeline view is designed specifically with this type of investigation in mind. It makes the relationship between events and associated detections easily visible. For more information, see Timeline View of Search Results.
