- Search Overview
- Search Home Page
- Performing Searches
- Basic Search
- Advanced Search
- Advanced Search Building Blocks
- Running an Advanced Search Query
- Query Syntax
- Query by Subject
- Query by Vendor and Product
- Query by Field and Value
- Query by Context Table
- Query Using Regex
- Free Text Search
- Query Using Advanced Query Language Operators
- Query Using Aggregation Functions
- Query Using Structured Fields
- Dynamic Field Extraction
- Natural Language Search
- Anomaly Search
- Refine a Search
- Context Tables in Search
- Search Best Practices
- Search Results
- Dashboard Visualizations
Rule Details
Rule Details information is available when you are viewing Search results that include detection events. A detection refers to an event that represents a possible security threat or anomalous behavior.
Important
Rule Details information is currently available for either Correlation Rule events or Exabeam Anomaly events.
Accessing Rule Details
To access Rule Details from different results views:
Timeline View – Do one of the following to open a Rule Details panel:
Click the options menu icon (
 ) on the right of the event row and select Rule Details.
Expand the event and click the Event Details link. When the Event Details panel opens, click on the Rules tab.
Expand the detection event and click the Rule Details link.
List View – Find a detection event in the listed results (recognizable by the risk score in the top right corner of the event) and click View all fields in the upper right corner of the event row. An Event Details panel opens with a Rules tab displayed.
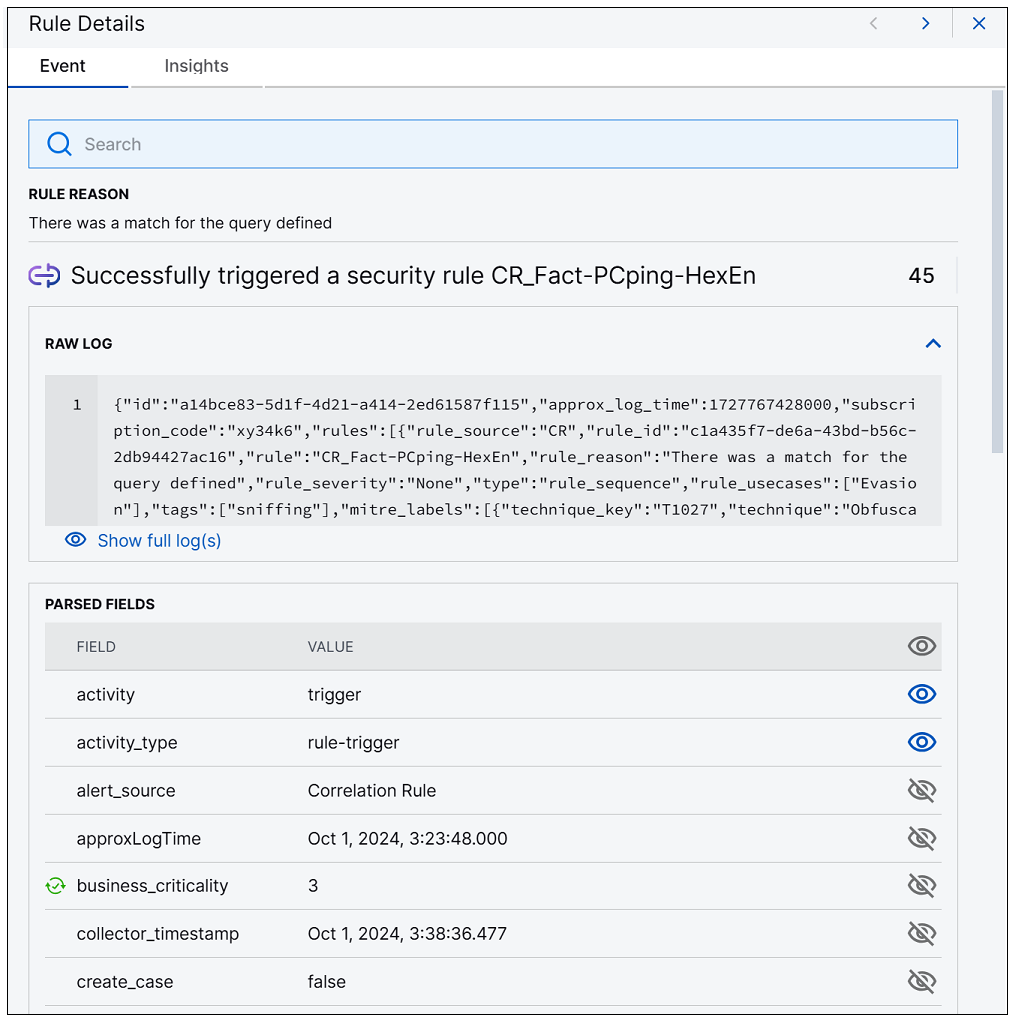
Table View – Find a detection event in the table of results (recognizable by the value
rulein the Subject column) and click on the event row. A Rule Details panel opens.
The detail information available when opening rule details depends on which results view you're working in. When you open Rule Details from either the Timeline or Table views, the panel that opens can show details for only the selected detection event. It includes a full raw message and the entire list of parsed fields for the event, including an expandable list of the rules associated with the detection event.
 |
In the Timeline view, a single event can be associated with multiple detection events. So, when you view detailed rule information in the Timeline view, the panel that opens can show information about multiple detection events. For a group of detection events, when the Event Details panel first opens with the Rules tab displayed, some overview information about the group of events is included at the top of the panel. It includes possible Source or Destination Endpoints, Use Cases, or
MITRE Tactics and Techniques that are covered by the detection events.
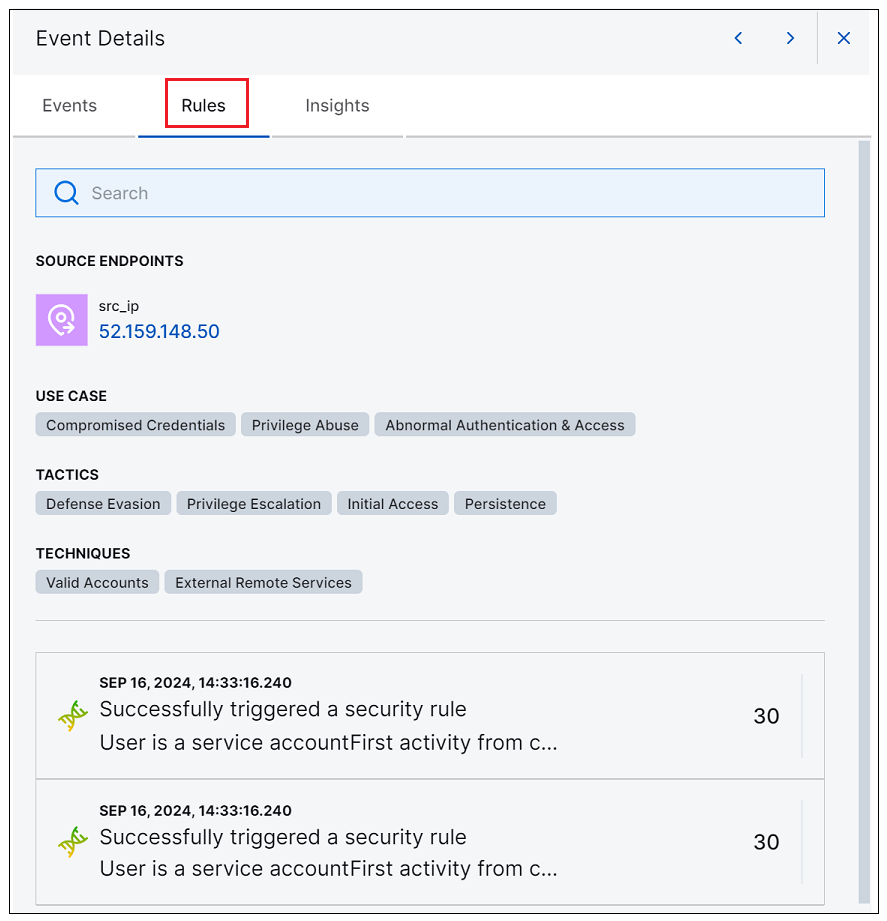 |
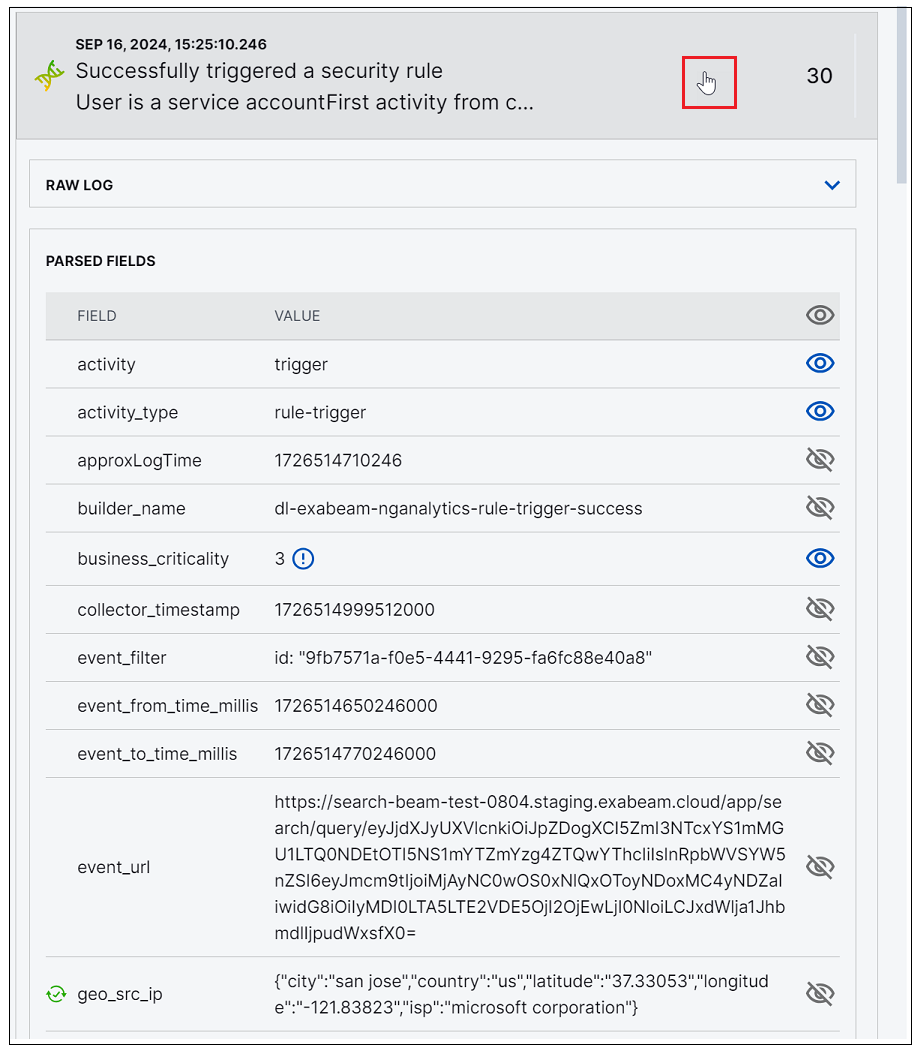
Below the overview event information you can find information specific to each detection event. The event details of each detection event in the panel are expandable and collapsible. If you open the Event Details panel from the options menu of the event row, the panel opens with all of the detections in the list collapsed. If you open the the panel from the link on one of the detection events, the panel opens with that specific event's details expanded. Click any detection to expand it and click it again to collapse it.
The expanded view of each detection includes a full raw message, and the entire list of parsed fields for the detection event, including an expandable list of the rules associated with the detection event.
Note
If an event does not specify a time zone, the time in the parsed fields is reported in the local time zone. In the raw log message, the time remains as is.
 |
Interacting with Rule Details
You can interact with the Rule Details information in the ways described below:
Use the
 icons at the top of the panel to navigate between result events.
Click the
 icon to close the Event Details panel and return to the Search results.
 Use the Search field at the top of the panel to search both the raw message and the list of parsed fields.
Use the arrow (
 ) icon in the top right corner of the Raw Log section to collapse and expand the log line.
Click the Copy Raw Log to Clipboard icon (
 ) in the Raw Log section to copy the log line. This icon is only displayed when you hover your cursor over the Raw Log section.
Click the
 icon next to any field in the PARSED FIELDS list, to hide/show the field in the search results.
Click the enrichment indicator icon (for example:
 ) next to any field that contains enriched data. A tooltip is displayed that explains the type and source of the enriched data.
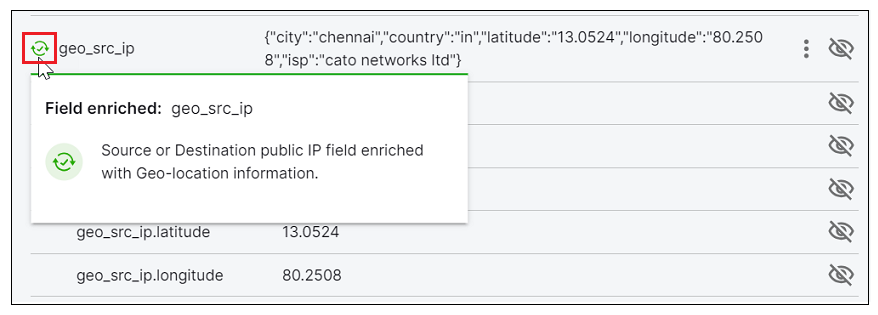
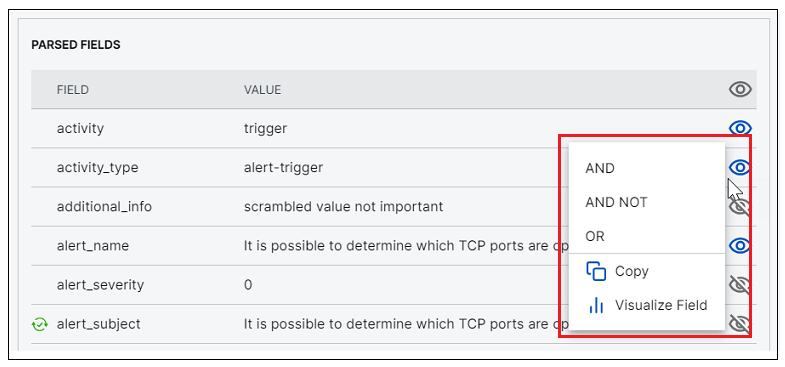
To display additional options for each field in the list, click the drop-down menu icon (
 ) that appears when you hover your cursor over a field row.
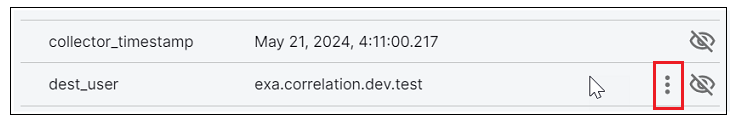
Depending on whether or not the field was included in the original query, the options below are available:
Use the AND, AND NOT, or OR operators to add the field to your query.
Click Remove to remove the field from your query. (Available only for fields that are already included in the query.)
Click Copy to copy the value of the field to the clipboard.
Click Visualize Field to pivot immediately to the Dashboard application, where a visualized view of the information from your search query is preconfigured.