- Site Collector Overview
- Get Started with Site Collectors
- Install Site Collector
- Set Up Collectors
- Sign Up for the Early Access Program: Site Collectors
- Choose the Right Collector based on Data Sources
- Set Up Archive Windows Collector
- Set Up Archive Linux Collector
- Set Up Direct Access Agent (DAA) Windows Event Collector
- Set Up EStreamer Collector
- Set Up Fortinet Collector
- Set Up IBM Security QRadar Collector
- Set Up Kafka Collector
- Set Up Splunk Collector
- Set Up Linux File Collector
- Set Up Microsoft SQL Collector
- Set Up MySQL Collector
- Set Up Oracle Collector
- Set Up Syslog Collector
- Set Up Windows Active Directory Collector
- Set Up Windows Event Log Collector
- Set Up Windows File Collector
- Manage Site Collectors
- Apply Antivirus Exclusions
- Migrate to the New-Scale Site Collectors Service
- Modify Collector Configuration
- Modify a Site Collector Instance
- Manage Templates
- Monitor Log Sources
- Add Filters to Set Egress Log Filtering Conditions
- New Site Collector Management Service NGSCD
- Regenerate Certificates for Collectors
- Upgrade the Site Collector
- Upgrade the Site Collector Specifications
- Vulnerability Remediation Policy
- Site Collector Monitoring
- Troubleshoot the Site Collector
- Pre-checks failed during Site Collector installation and upgrade
- Site Collector UI shows the status INSTALLATION_ERROR
- Download Support Packages for Troubleshooting
- How to reboot the Virtual Machine (VM) successfully to apply security updates?
- What information must be added while creating a support ticket to resolve an issue?
- Site Collector UI is not displaying the heartbeats
- Splunk Collector can't be set up
- Splunk Collector is set up however, logs are not reaching DL/AA
- Only a few of the installed Splunk Collectors are processing logs or EPS has dropped by 50% as compared to last hour
- The Windows Active Directory Collector (formerly known as LDAP Collector) is set up, however, the context data is not reaching DL/AA
- The Windows Active Directory Collector (formerly known as LDAP Collector) is stuck in the ‘Update’ mode after deployment
- Installation is initiated; however, the collector shows the status as ‘Setting Up’ for some time
- Data Lake and Advanced Analytics Does Not Show Context Data
- Context Data from Windows Active Directory Collector is Segmented
- Minifi Permission Denied - Logback.xml File Missing and Config File Update - Failed Error Occurred while Installing the Windows Event Log Collector
- Where should I upload proxy certificates if I am running proxy with TLS interception?
- How to upgrade Linux collector instance?
Modify a Site Collector Instance
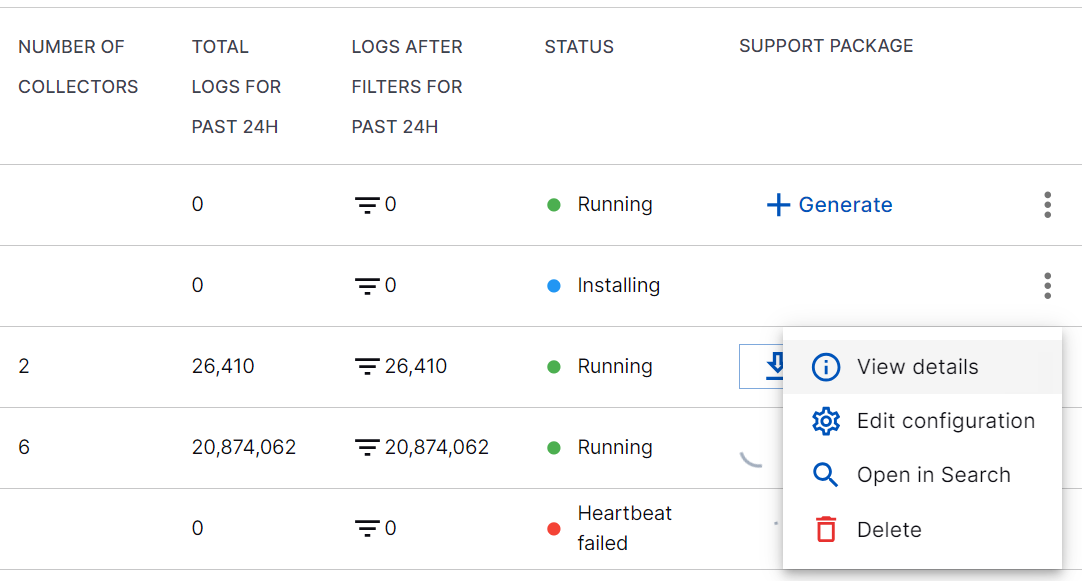
In the Site Collector Instances section, in addition to viewing the Site Collector instance name and version, number of nodes and collectors, total logs, status, and support package, you can modify the configuration of a Site Collector instance by clicking the Site Collector instance or Edit configuration.
To modify the configuration of a Site Collector instance:
On the New-Scale Security Operations Platform home page, click the Collectors tile.
Click Site Collectors.
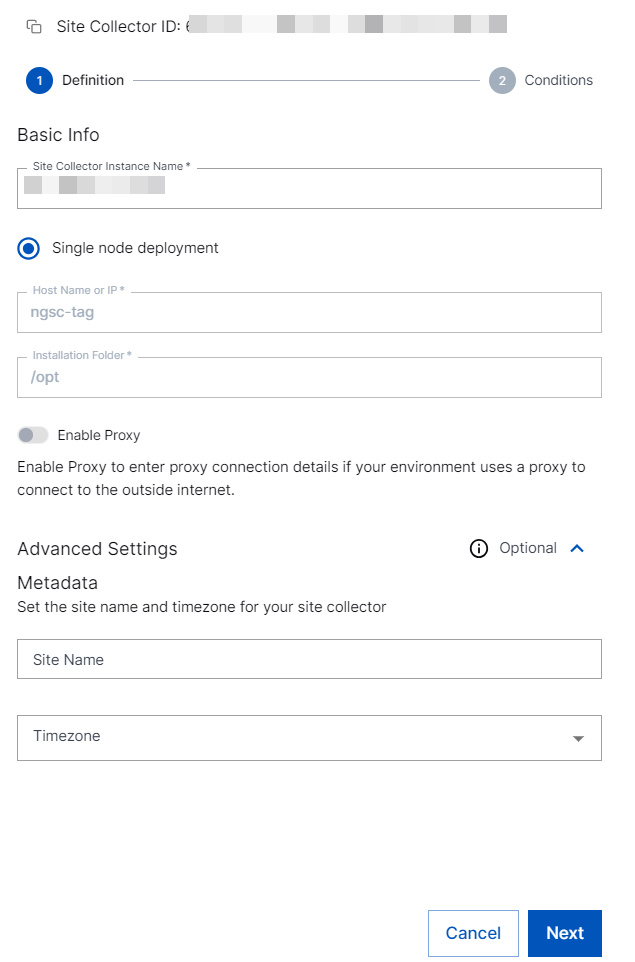
On Site Collector Instances, click the Site Collector instance of which you want to edit the configuration. Or, click Edit Configuration for the instance.

Edit the Site Collector instance name, and enter a site name and set a time zone for the Site Collector instance.
Site Name (Optional) – Select an existing site or to create a new site with a unique ID, click manage your sites. Adding a site name helps you to ensure efficient management of environments with overlapping IP addresses. If you have a multi-tenant system, you can use Site Name to differentiate between tenants.
By entering a site name, you associate the logs with a specific independent site. A sitename metadata field is automatically added to all the events that are going to be ingested via this collector. For more information about Site Management, see Define a Unique Site Name.
Timezone (Optional) – Select a time zone applicable to you. By entering a time zone, you override the default UTC time zone. The time zone that you set is used for converting the timestamps on the logs.
In the Conditions section, Add Filters to Set Egress Log Filtering Conditions.

Click Apply.
The changes are applied to the Site Collector instance.
Search Logs for Site Collector Instances
Using Exabeam Search, you can search for specific events in the log repository and access all your logs and filter the logs based on your requirement. You can navigate via Site Collectors to Exabeam Search to quickly find relevant logs and events to detect threats.

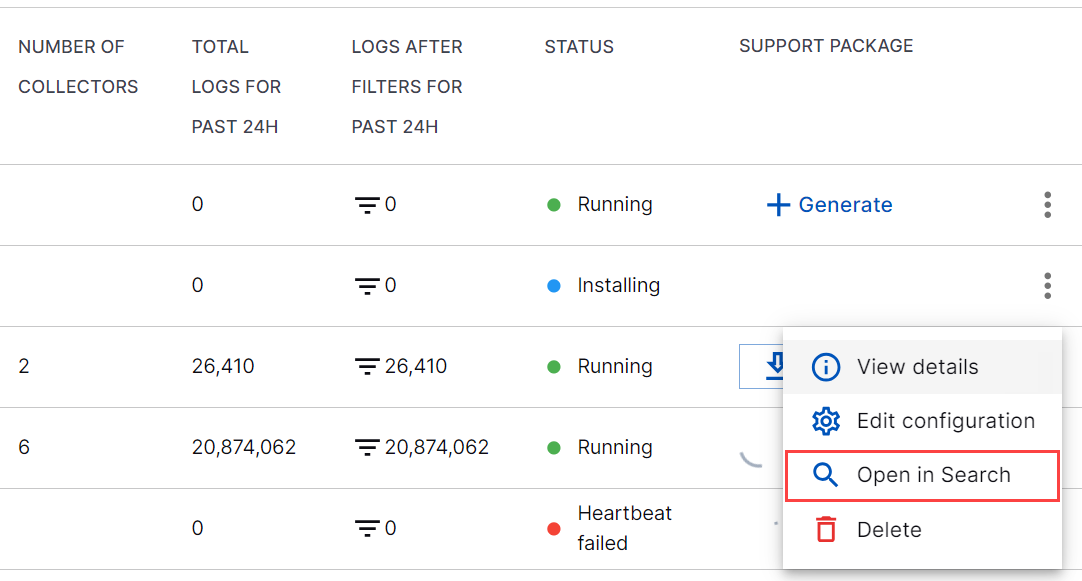
With the Open in Search option, you can open Search application in a new tab to view a prepopulated Search query that displays details of logs related to the selected Site Collector instance. Customizing the search query by adding parameters and selecting a timeframe gives you the flexibility to filter logs. This helps you easily find the specific event details for a particular Site Collector instance.
The following metadata fields are automatically parsed by the Search service. You can use these fields while searching for specific logs based on your requirement.
Metadata Fields | Description |
|---|---|
m_exa_sc_collector_type | Collector type for server-side collectors |
m_exa_sc_collector_id | Unique collector ID for server-side collectors |
m_exa_sc_collector_name | Collector name for server-side collectors |
m_exa_sc_hostname | Hostname of Site Collector VM |
m_origin_collector_id | Unique collector ID for agent collectors |
m_origin_collector_type | Collector type for agent collectors |
m_origin_collector_name | Collector name for agent collectors |
m_origin_hostname | Hostname of agent collectors |
m_origin_timestamp | Agent collectors log time in Epoch format |
m_origin_path | Path of file for agent collectors like File or Archive collectors |
m_timestamp | UTC timestamp of log ingestion |
m_message_size | Size of the message field in bytes |
m_forwarder | Hostname/IP of events ingestor |
m_trimmed | A flag that is set to true when the log size exceeds 1 MB, which indicates a guardrail scenario |
m_timezone_offset | Specific time zone mentioned at the Site Collector level |
m_sitename | Site name |
m_siteid | Unique ID for a site |
