- Site Collector Overview
- Get Started with Site Collectors
- Install Site Collector
- Set Up Collectors
- Sign Up for the Early Access Program: Site Collectors
- Choose the Right Collector based on Data Sources
- Set Up Archive Windows Collector
- Set Up Archive Linux Collector
- Set Up Direct Access Agent (DAA) Windows Event Collector
- Set Up EStreamer Collector
- Set Up Fortinet Collector
- Set Up IBM Security QRadar Collector
- Set Up Kafka Collector
- Set Up Splunk Collector
- Set Up Linux File Collector
- Set Up Microsoft SQL Collector
- Set Up MySQL Collector
- Set Up Oracle Collector
- Set Up Syslog Collector
- Set Up Windows Active Directory Collector
- Set Up Windows Event Log Collector
- Set Up Windows File Collector
- Manage Site Collectors
- Apply Antivirus Exclusions
- Migrate to the New-Scale Site Collectors Service
- Modify Collector Configuration
- Modify a Site Collector Instance
- Manage Templates
- Monitor Log Sources
- Add Filters to Set Egress Log Filtering Conditions
- New Site Collector Management Service NGSCD
- Regenerate Certificates for Collectors
- Upgrade the Site Collector
- Upgrade the Site Collector Specifications
- Vulnerability Remediation Policy
- Site Collector Monitoring
- Troubleshoot the Site Collector
- Pre-checks failed during Site Collector installation and upgrade
- Site Collector UI shows the status INSTALLATION_ERROR
- Download Support Packages for Troubleshooting
- How to reboot the Virtual Machine (VM) successfully to apply security updates?
- What information must be added while creating a support ticket to resolve an issue?
- Site Collector UI is not displaying the heartbeats
- Splunk Collector can't be set up
- Splunk Collector is set up however, logs are not reaching DL/AA
- Only a few of the installed Splunk Collectors are processing logs or EPS has dropped by 50% as compared to last hour
- The Windows Active Directory Collector (formerly known as LDAP Collector) is set up, however, the context data is not reaching DL/AA
- The Windows Active Directory Collector (formerly known as LDAP Collector) is stuck in the ‘Update’ mode after deployment
- Installation is initiated; however, the collector shows the status as ‘Setting Up’ for some time
- Data Lake and Advanced Analytics Does Not Show Context Data
- Context Data from Windows Active Directory Collector is Segmented
- Minifi Permission Denied - Logback.xml File Missing and Config File Update - Failed Error Occurred while Installing the Windows Event Log Collector
- Where should I upload proxy certificates if I am running proxy with TLS interception?
- How to upgrade Linux collector instance?
Set Up Splunk Collector
If you use Splunk as a SIEM, you can set up the Splunk collector to retrieve logs from your Splunk server or Splunk Cloud. The Splunk collector is a set of Site Collector flows, pre-built processors, groups, custom processors, other components, and integrations that pull logs in plain text, JSON, or Windows multiline format from your Splunk server and push the logs to New-Scale Security Operations Platform.
To set up a Splunk collector:
Log in to the New-Scale Security Operations Platform with your registered credentials.
Navigate to Collectors > Site Collectors.
Ensure that Site Collector is installed and in running state.
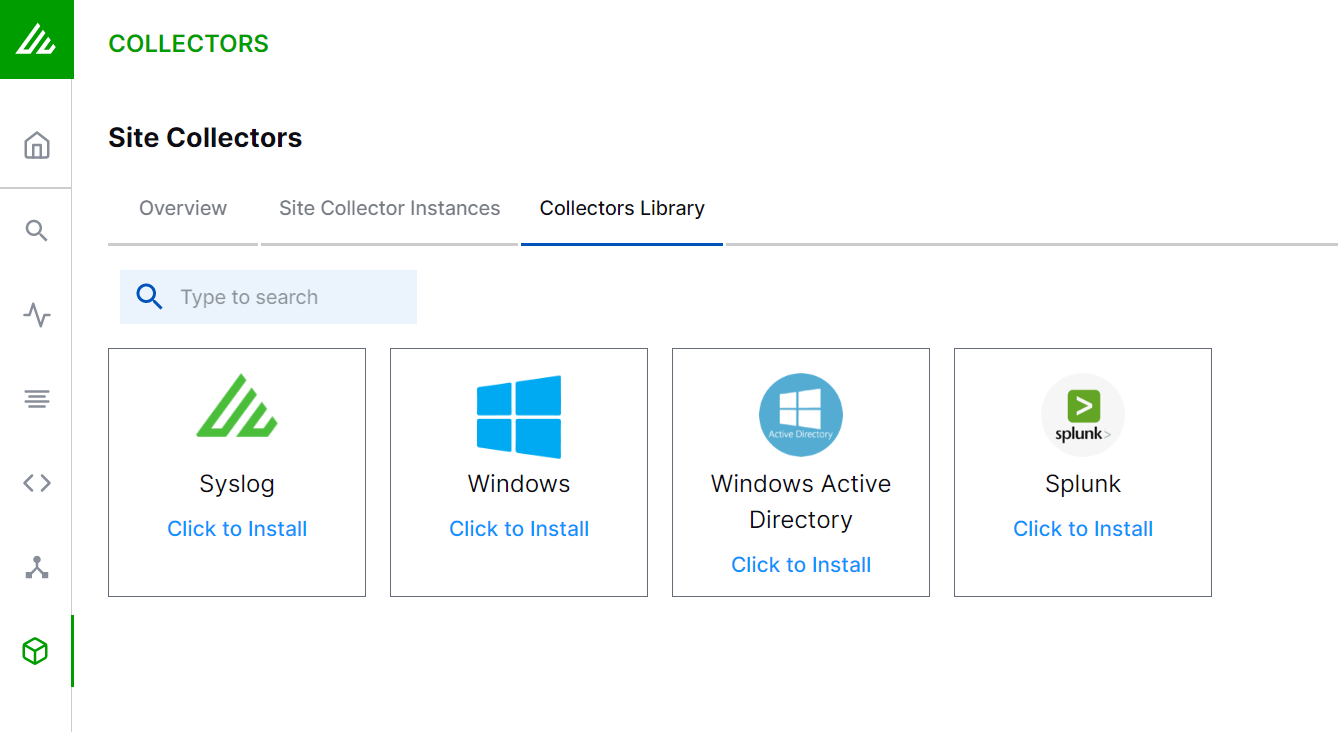
On the Site Collector page, click the Collectors Library tab, then click Splunk.

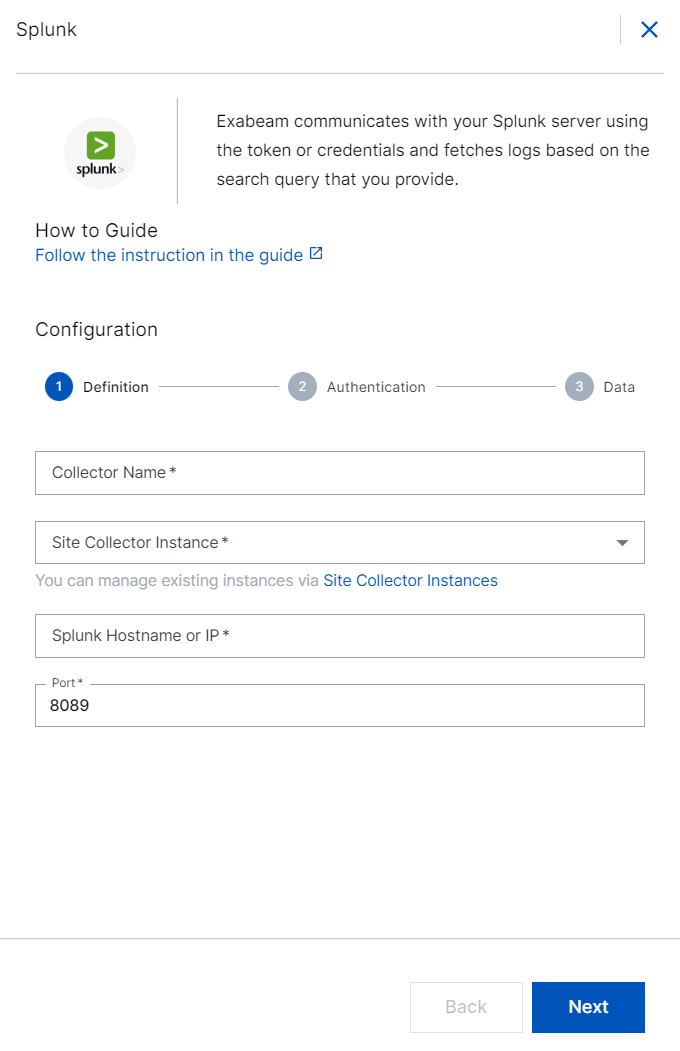
In the Definition section, enter the required information as follows.

Collector Name – Specify a name for the Splunk collector.
Note
Ensure that you specify different names for Site Collector instance and the collector.
Site Collector Instance – Select the site collector instance for which you want to set up the Splunk collector.
Splunk Hostname or IP – Enter the IP address of the Splunk server or Splunk Cloud from which you want the Splunk collector to pull logs.
Port – Enter the port number of your Splunk server. The default port is 8089.
Click Next.
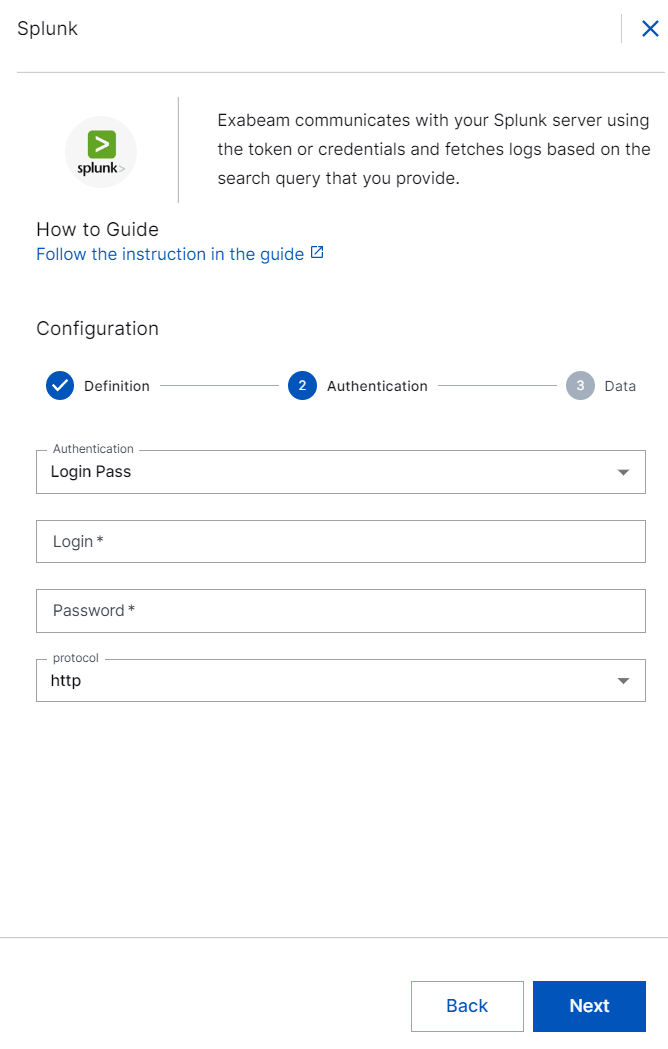
In the Authentication section, enter the required information as follows.

Authentication – Select the authentication method, Login Pass or Token for the Splunk collector to connect to the sever.
If you select Login Pass, enter the login name and password that you already set for the Splunk server.
If you select Token, enter the token number that you set for the Splunk server to authenticate.
Protocol – Select the protocol http or https.
For https, select the appropriate option such as none, SSL, TLS v1, TLS v1.1, and TLS v1.2 to securely pull the data.
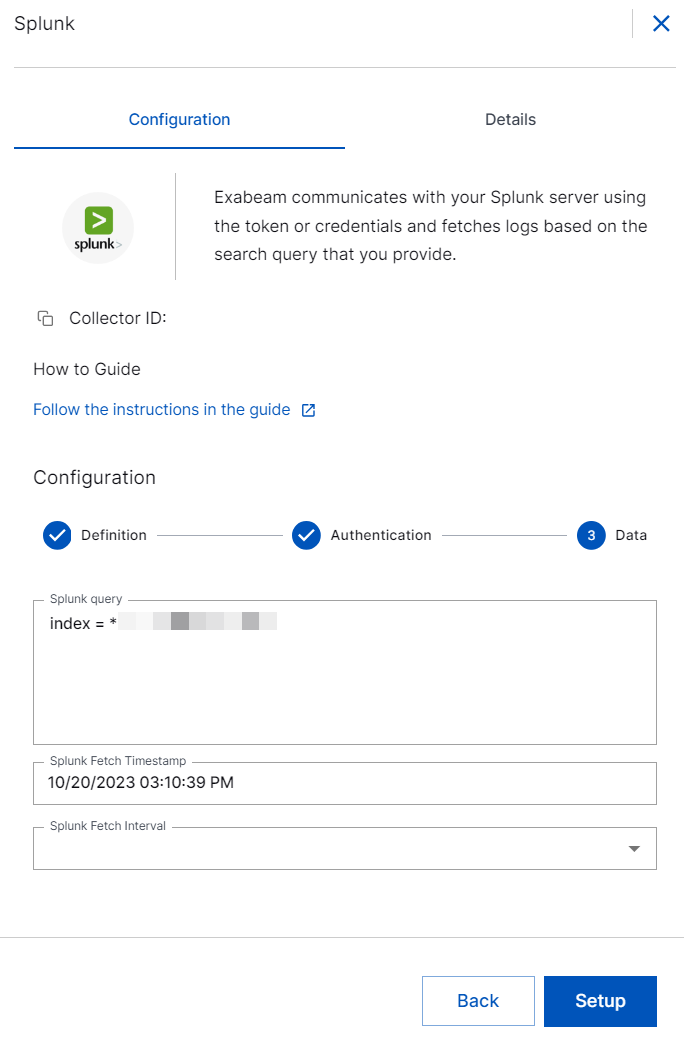
In the Data section, enter the required information as follows.

Splunk Query – Enter the Splunk query to specify the type of data that you want to pull. For example: To fetch logs from the Splunk server, use the query:
index = *.To prevent data loss, use time modifiers such as earliest, now, and latest in your Splunk query with caution as it may cause conflict with collector’s internal clock.
Note
Verify the accuracy for your Splunk query through the Splunk CLI. Make sure that logs are returned based on your Splunk query that corresponds to the event type correctly.
Splunk Fetch Timestamp – Select the time and date from when you want the collector to fetch logs. By default current date and time is selected. If you want to select a threshold to include events to be ingested from the past, select a date previous to the present date. You can select a date which is backdated to 30 days.
If you want the Splunk collector to pull large amount of historical data, create two separate Splunk collector instances: one is for live data pull and the other for historical data pull, to ensure precision.
Caution
If you create two Splunk collector instances — one to pull live data and the other to pull historical data — ensure that the collector that pulls historical data has a time condition
latest=<currenttime>to avoid overlapping with the live data collector. Ensure that you stop the collector instance after fetching the historical logs.Splunk Fetch Interval – Select the time interval within which you want the Splunk collector to pull logs. For example: 30 sec, 1 min, 2 min, 3 min, 4 min, 5 min, 15 minutes, 30 minutes, 45 minutes, and 60 minutes.
Caution
The Splunk Collector instance can fetch data at 8K EPS starting with oldest historical data first until present time. If the historical data was generated at a higher rate than the maximum EPS that Splunk Collector supports, it is recommended to create two separate Splunk Collector instances: one instance for fetching the historical data and the other for current data.
For optimum performance, set smaller fetch time interval when you want to push data at very high EPS.
Click Setup.
The Splunk collector is set up and is ready to pull logs from your Splunk server.
After the Splunk collector is set up, Site Collector Core starts pulling logs periodically based on the query entered by the user and uploads logs to New-Scale Security Operations Platform. If the Splunk server is not available, Site Collector core resumes pulling logs from the place where it stopped. Site Collector supports the following three types of logs out of the various types of logs supported by the Splunk server.
Windows multiline
Plain text (Syslog one-line events)
JSON (one-line JSONs)
In case of installation failure, the collector is disabled, and the configuration is saved. The status of the collector can be checked on the UI or using the support package.
Note
Site Collector supports Splunk Cloud.
The Splunk Collector fetches the Splunk metadata fields:
_time,sourcetype, andhostin addition to the_rawfield.The Splunk collector supports Splunk SDK 1.9.5 with the latest API version for better security and seamless integration with Splunk server.
The Splunk collector provides maximum EPS of 7K for the average log size of 2.5Kb for a VM with common specifications. For a VM with enterprise specifications, the collector provides a maximum EPS of 7K for a single collector instance and 21K EPS for three collector instances collectively.
