- Site Collector Overview
- Get Started with Site Collectors
- Install Site Collector
- Set Up Collectors
- Sign Up for the Early Access Program: Site Collectors
- Choose the Right Collector based on Data Sources
- Set Up Archive Windows Collector
- Set Up Archive Linux Collector
- Set Up Direct Access Agent (DAA) Windows Event Collector
- Set Up EStreamer Collector
- Set Up Fortinet Collector
- Set Up IBM Security QRadar Collector
- Set Up Kafka Collector
- Set Up Splunk Collector
- Set Up Linux File Collector
- Set Up Microsoft SQL Collector
- Set Up MySQL Collector
- Set Up Oracle Collector
- Set Up Syslog Collector
- Set Up Windows Active Directory Collector
- Set Up Windows Event Log Collector
- Set Up Windows File Collector
- Manage Site Collectors
- Apply Antivirus Exclusions
- Migrate to the New-Scale Site Collectors Service
- Modify Collector Configuration
- Modify a Site Collector Instance
- Manage Templates
- Monitor Log Sources
- Add Filters to Set Egress Log Filtering Conditions
- New Site Collector Management Service NGSCD
- Regenerate Certificates for Collectors
- Upgrade the Site Collector
- Upgrade the Site Collector Specifications
- Vulnerability Remediation Policy
- Site Collector Monitoring
- Troubleshoot the Site Collector
- Pre-checks failed during Site Collector installation and upgrade
- Site Collector UI shows the status INSTALLATION_ERROR
- Download Support Packages for Troubleshooting
- How to reboot the Virtual Machine (VM) successfully to apply security updates?
- What information must be added while creating a support ticket to resolve an issue?
- Site Collector UI is not displaying the heartbeats
- Splunk Collector can't be set up
- Splunk Collector is set up however, logs are not reaching DL/AA
- Only a few of the installed Splunk Collectors are processing logs or EPS has dropped by 50% as compared to last hour
- The Windows Active Directory Collector (formerly known as LDAP Collector) is set up, however, the context data is not reaching DL/AA
- The Windows Active Directory Collector (formerly known as LDAP Collector) is stuck in the ‘Update’ mode after deployment
- Installation is initiated; however, the collector shows the status as ‘Setting Up’ for some time
- Data Lake and Advanced Analytics Does Not Show Context Data
- Context Data from Windows Active Directory Collector is Segmented
- Minifi Permission Denied - Logback.xml File Missing and Config File Update - Failed Error Occurred while Installing the Windows Event Log Collector
- Where should I upload proxy certificates if I am running proxy with TLS interception?
- How to upgrade Linux collector instance?
View Error History
When there are issues related to data ingestion, onboarding, compression, and processing, you can view error details and recommended actions in the Error Messages section for a Collector instance such as Syslog, LDAP, or Splunk instance, or a Site Collector instance. Before you investigate the data ingestion errors whenever the errors occur, refer to the error status, error messages, and error history to obtain relevant information.
To view error history for a particular Collector instance, on the Overview page, navigate to the Collector instance and click the menu icon, then click View Details.

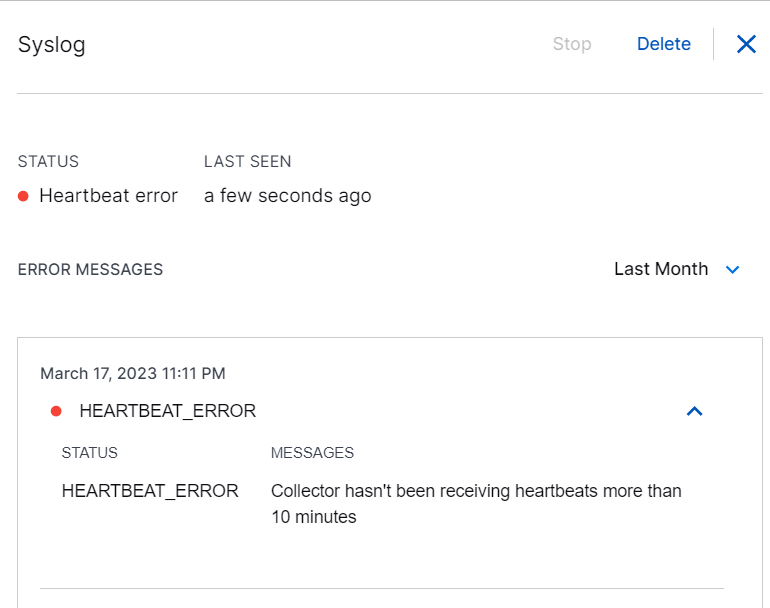
The Error Messages section displays current status and error history with error details as follows:

Current Status:
Staus – Type of the error that has occurred. The error types include Internal Error, Misconfiguration, Heartbeat Error, Running Error, Update Error, Stop Error.
Last Seen – Time when the error occurred last.
Error History:
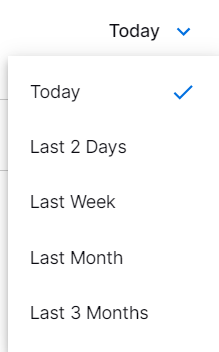
Error History – Select the time period in which you want to view any reported errors and the historical error details. Options include: Last 2 Days, Last Week, Last Month, or Last 3 Months.

Time and Date – Time and date when the error occurred.
Staus – Type of the error that has occurred in the past. The error types include Internal Error, Misconfiguration, Heartbeat Error, Running Error, Update Error, Stop Error.
Messages – Description of the error that occurred. These error details provide more information to help you troubleshoot further.
