- Site Collector Overview
- Get Started with Site Collectors
- Install Site Collector
- Set Up Collectors
- Sign Up for the Early Access Program: Site Collectors
- Choose the Right Collector based on Data Sources
- Set Up Archive Windows Collector
- Set Up Archive Linux Collector
- Set Up Direct Access Agent (DAA) Windows Event Collector
- Set Up EStreamer Collector
- Set Up Fortinet Collector
- Set Up IBM Security QRadar Collector
- Set Up Kafka Collector
- Set Up Splunk Collector
- Set Up Linux File Collector
- Set Up Microsoft SQL Collector
- Set Up MySQL Collector
- Set Up Oracle Collector
- Set Up Syslog Collector
- Set Up Windows Active Directory Collector
- Set Up Windows Event Log Collector
- Set Up Windows File Collector
- Manage Site Collectors
- Apply Antivirus Exclusions
- Migrate to the New-Scale Site Collectors Service
- Modify Collector Configuration
- Modify a Site Collector Instance
- Manage Templates
- Monitor Log Sources
- Add Filters to Set Egress Log Filtering Conditions
- New Site Collector Management Service NGSCD
- Regenerate Certificates for Collectors
- Upgrade the Site Collector
- Upgrade the Site Collector Specifications
- Vulnerability Remediation Policy
- Site Collector Monitoring
- Troubleshoot the Site Collector
- Pre-checks failed during Site Collector installation and upgrade
- Site Collector UI shows the status INSTALLATION_ERROR
- Download Support Packages for Troubleshooting
- How to reboot the Virtual Machine (VM) successfully to apply security updates?
- What information must be added while creating a support ticket to resolve an issue?
- Site Collector UI is not displaying the heartbeats
- Splunk Collector can't be set up
- Splunk Collector is set up however, logs are not reaching DL/AA
- Only a few of the installed Splunk Collectors are processing logs or EPS has dropped by 50% as compared to last hour
- The Windows Active Directory Collector (formerly known as LDAP Collector) is set up, however, the context data is not reaching DL/AA
- The Windows Active Directory Collector (formerly known as LDAP Collector) is stuck in the ‘Update’ mode after deployment
- Installation is initiated; however, the collector shows the status as ‘Setting Up’ for some time
- Data Lake and Advanced Analytics Does Not Show Context Data
- Context Data from Windows Active Directory Collector is Segmented
- Minifi Permission Denied - Logback.xml File Missing and Config File Update - Failed Error Occurred while Installing the Windows Event Log Collector
- Where should I upload proxy certificates if I am running proxy with TLS interception?
- How to upgrade Linux collector instance?
Site Collector Monitoring
After you install the Site Collector, from the Site Collector app, you can monitor the status and last seen of the Site Collector and Collectors set up on the Site Collector. After you set up the Collector, you can monitor status, last seen, and volume or count and trend for the Collector. The Site Collector Core sends heartbeat messages to the Site Collector app. The Site Collector app sets the status to Pending while checking the new heartbeats that come to PubSub. The heartbeats are sent every 30 seconds via a management flow. The initial timeout is 10 minutes for the health check process; within this timeout Site Collector or Collector sends heartbeats per 30 seconds. The metrics data for log volume or records count is sent every 5 minutes via a monitoring flow at the same time and the Trend is calculated based on the hourly data.

Note
To handle a new set of metrics and Service Health and License Consumption integration, management and monitoring services are available. Site Collector has two monitoring flows, one is via Site Collector Monitoring and the other is via Site Collector Metrics. The Site Collector Monitoring feature tracks Site Collector and Collector statuses, volume or count, and other metrics every 30 seconds. The Site Collector Metrics feature handles metrics and shares the data with Service Health and License Consumption every five minutes. It is recommended to upgrade Site Collector to the latest version to track statuses and metrics.
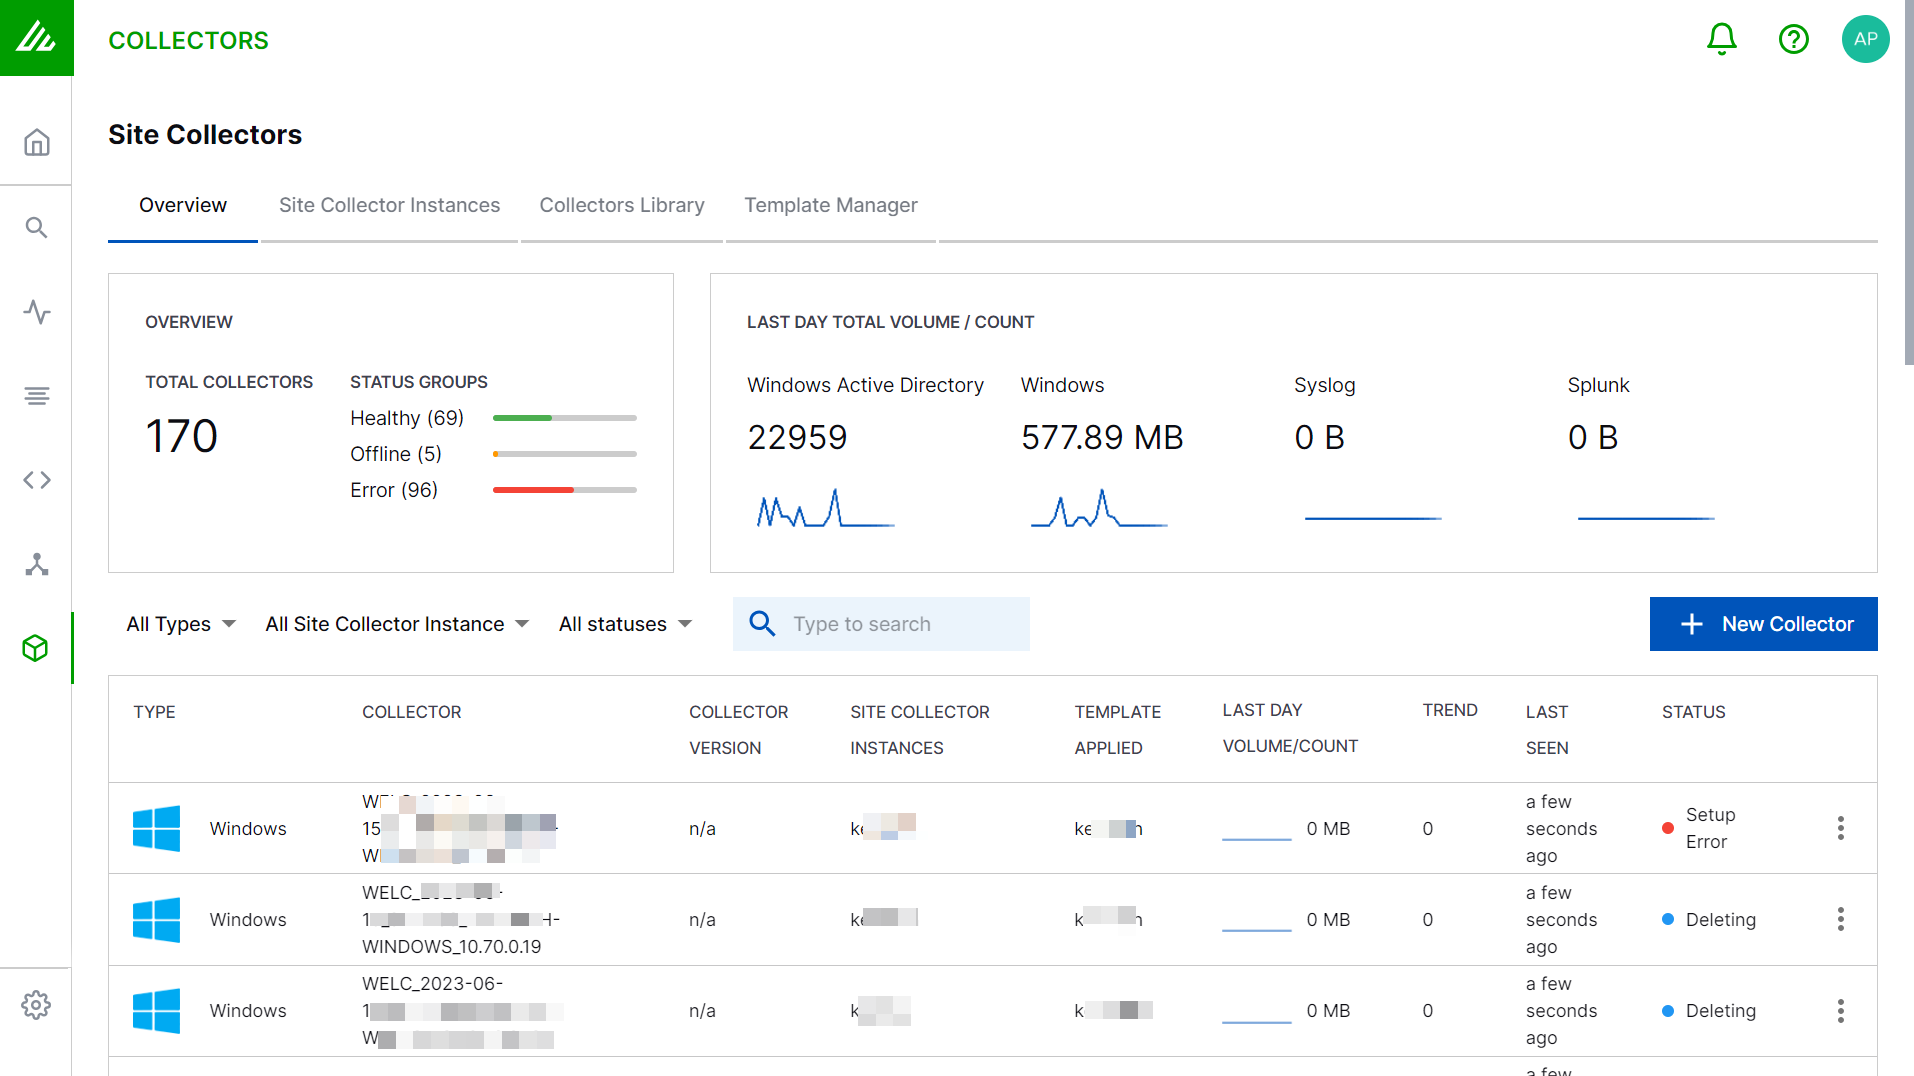
The following table describes each field displayed on the Overview tab. For each Collector instance, you can view the following information.
Field | Description |
|---|---|
Type | Type of the Collector: Windows Active Directory, Splunk, or Syslog. |
Collector | The Collector instance set up for a specific Site Collector instance. |
Collector Version | Version of the collector instance that you installed. |
Site Collector Instances | The Site Collector instance installed relevant for the Collector. |
Template Applied | Name of the template that you used for your Windows Event Log Collector instance. |
Last Day Volume/Count | The volume or count calculated based on raw log data volume for Splunk and Syslog logs plus 15% or record amount for context (LDAP) for the last 24 hours. This count is updated per hour. |
Trend | The count that is calculated based on raw log data volume for logs (Splunk and Syslog) plus 15% or record amount for context (LDAP) for the last two hours. This count is updated per hour. |
Last Seen | The time when the last heartbeat was received. |
Status | The current status of the Site Collector instance. |
Note
To use the Refresh button for viewing latest updates, ensure that you clear the check boxes for collector instances. If the check boxes for any of the collector instances are selected, the Refresh button is disabled.

For more information about each section, refer to the following topics.
View Aggregated Metrics for Collectors
The Overview section displays the total number of Collectors which includes Collectors in all statuses and the status groups. The Collectors are widely categorized into three status groups as follows, except for the Collectors with the status DELETED. These groups are also visible on the Telemetry page that shows Service Health and License Consumption.
Group | Included Statuses |
|---|---|
Healthy | SETUP, RUNNING, UPDATING, UPDATED, STOPPING, RESTARTING, RESTARTED, DELETING, STOP_ERROR, DELETE_ERROR |
Offline | SETTING_UP, STOPPED, UPDATE_ERROR, RESTART_ERROR |
Error | SETUP_ERROR, RUNNING_ERROR, HEARTBEAT_ERROR |
Note
To filter the status groups, click each group. To clear all filters, click Total Collectors.
View Last Day Total Volume
The Last Day Total Volume/Count section displays the volume of ingested raw data for log collectors, and number of ingested records for context tables. The total for each Collector is calculated as a sum of ingested volumes for the last 24 hours. Each point in the graph displays the data relevant at that particular hour.

For each hour, the Last Day Total Volume/Count displays sum of all ingested volumes. Let us understand how the Last Day Total Volume/Count is calculated. Refer to the following example that presents two cases, in which the first case displays total volume for 10 active collector instances that ingested 12 GB of data in 24 hours. The second case shows an hourly volume with a scenario in which one more collector is added.
Case 1: This example displays an hourly volume for 10 active collectors.
Active Collectors | Time | Total Volume |
|---|---|---|
10 | 11 a.m. - 11 a.m. | 12 GB |
Case 2:
This example displays an hourly total volume for 10 active collectors in which 10 active collectors keep ingesting data with 50Mb/hour rate. If you add one more collector at 10 a.m. with 100Mb/hour rate, it will contribute to the total volume.
Active Collectors | Time | Total Volume |
|---|---|---|
10 | 11 a.m. - 10 a.m. | 11.5 GB |
11 | 10 a.m. - 11 a.m. | 12.1 GB |
Site Collector Status Filters
The following table displays a list of status based on which you can filter Site Collector instances.
Site Collector Status | Description |
|---|---|
Installing | Site Collector installation is in progress. After you create a Site Collector instance, the table in the Site Collector Instances tab displays this status until the installation process completes. |
Installed | Installation is complete. The table displays this status after Site Collector installation is complete and when SC installation was successful, however, heartbeats are not received yet. |
Running | Site Collector instance is up and running and sending heartbeats within the timeout of 10 minutes. |
Upgrading | Site Collector is in the process of upgrade. |
Upgraded | Site Collector is upgraded successfully. The table displays this status for a few seconds before Site Collector goes into Running mode. |
Updating | Site Collector configuration update is in progress. |
Updated | Site Collector configuration update is completed successfully. The table displays this status for a few seconds before Site Collector goes into Running mode. |
Stopping | The administrator initiated the process of stopping the Site Collector instance and associated Collectors through user interface. |
Stopped | A Site Collector instance is stopped. |
Restarting | A stopped Site Collector instance is restarted by the administrator through user interface. |
Restarted | A Site Collector instance along with its Collectors is restarted. The table displays this status for a few seconds before Site Collector goes into Running mode. |
Uninstalling | Uninstallation of a Site Collector instance, initiated by an administrator through user interface, is in progress. Deletion of all the Collectors set up on this Site Collector instance is in progress. |
Uninstalled | Uninstallation of a Site Collector instance is completed. |
The following table displays a list of errors based on which you can filter Site Collector instances.
Error | Description |
|---|---|
Installation Error | Any installation step, and pre-check and post-checks associated with the Site Collector installation and Collector set up are failed. |
Heartbeat Error | No heartbeats are received within 10 minutes timeout for the installed Site Collector instance. Or no heartbeats are received within the standard 30 seconds interval. |
Running Error | Heartbeats are received however there are some errors related to the normal workflow of Site Collector. |
Upgrade Error | Site Collector upgrade is failed. |
Updated Error | Site Collector configuration update is failed. |
Stop Error | Site Collector instance is not stopped and is rolled back to running state. |
Restart Error | Site Collector instance is not restarted and is rolled back to the stopped state. |
Uninstallation Error | Site Collector uninstallation failed, and the Site Collector instance is rolled back to the running state. |
Filter Collector Records Based on Statuses
The following table displays a list of status based on which you can filter Collector records.
Collector Status | Description |
|---|---|
Setting Up | A Collector record is created; however, Collector setup is in progress. |
Setup | A Collector is set up successfully. |
Running | A Collector is set up and is in running state based on the heartbeats. |
Updating | Configuration update for the collector is in progress. |
Updated | Configuration update for the collector is complete. |
Stopping | An administrator stopped the Collector through UI and the process of stopping the Collector is in progress. |
Stopped | An administrator stopped the Collector successfully through UI. Or the Collector is stopped while the Site Collector instance on which this Collector is set up, is in the process of upgrading. |
Restarting | A Collector is in the process of restarting after an administrator stopped the Collector though user interface. |
Restarted | A Collector is restarted. The table displays this status for a few seconds before the Collector goes into Running mode. |
Deleting | An administrator has initiated deletion process for the Collector through user interface. |
Deleted | The Collector is deleted successfully. |
The following table displays a list of errors based on which you can filter the Collectors.
Error | Description |
|---|---|
Setup Error | The Collector setup failed. |
Heartbeat Error | No heartbeats are received within 10 minutes timeout for Collector setup, or no heartbeats are received within a 30 second interval. This error is displayed if the Site Collector instance on which this Collector is set up is in Heartbeat Error status. |
Running Error | Heartbeats are received; however, there is some error related to the workflow of the Collector. |
Update Error | The configuration update for the Collector failed. |
Stop Error | The Collector is not stopped and is rolled back to running state. |
Restart Error | The Collector is not restarted and is rolled back to the stopped state. |
Delete Error | The Collector configuration deletion failed, and the Collector is rolled back to the running state. |
View Site Collector Instances
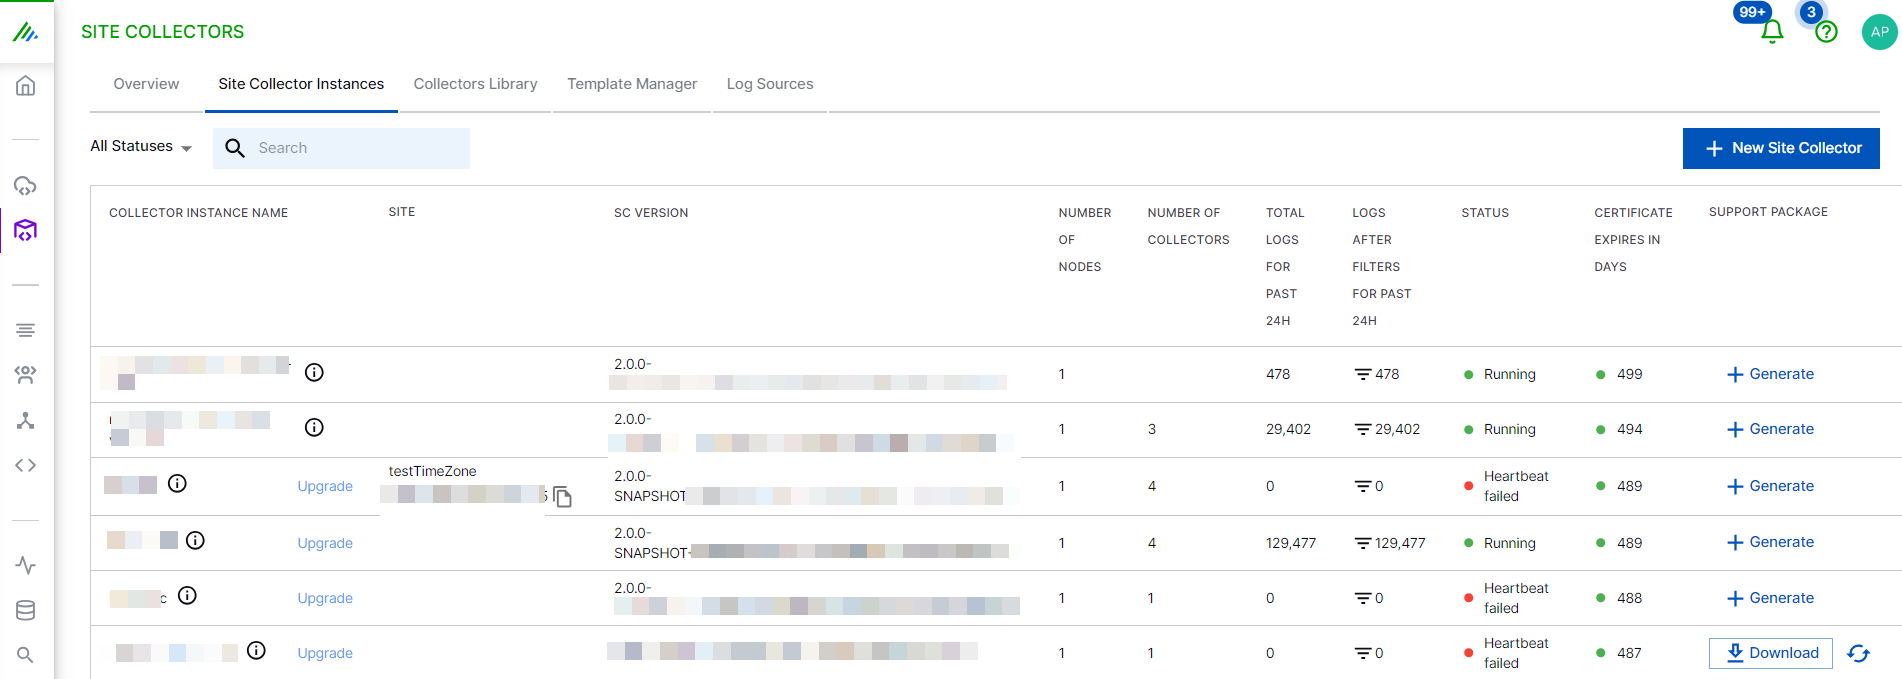
After Site Collector installation, from the Site Collector app, you can create Site Collector instances and monitor their status. The Site Collector Instances tab displays the details of Site Collector instances that you create.

The following table describes each column displayed on the Site Collector Instances tab. For each Site Collector instance, you can view the following information.
Field | Description |
|---|---|
Collector Instance Name | Name of the Site Collector instance that you created. If your Site Collector instance is not upgraded, this column displays a link to upgrade the instance to its latest version. |
Site | The Site ID of the Site Collector instance. You can create a new site while updating a site collector instance. |
SC Version | Version of the Site Collector instance that you installed. |
Number of Nodes | Number of nodes for a Site Collector instance. |
Number of Collectors | The number of collector instances installed on this Site Collector instance. |
Total Logs for Past 24H | The total number of logs processed in the last 24 hours. |
Logs after Filters for Past 24H | The total number of logs processed after applying filters with conditions in the last 24 hours. |
Status | The current status of the Site Collector instance. For details of each type of status see Site Collector Status Filters. |
Certificate Expires in Days | The validity of the security certificate in days. |
Support Package | Link to generate and download the support package. If you want to raise a support case for troubleshooting issues associated with a particular Site Collector instance, you can download support packages. |
For information about editing a Site Collector instance and searching logs for Site Collector instances, see Modify a Site Collector Instance.
Modify a Collector Instance
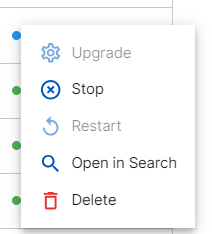
In the Overview section, to modify a particular Collector instance, navigate to the Collector instance and click the menu icon, then click one of the following options:

Upgrade – Click to upgrade some of the Windows collectors.
Stop – Click to stop a collector instance that is in 'Running' state.
Restart – Click to start a Collector instance that is stopped.
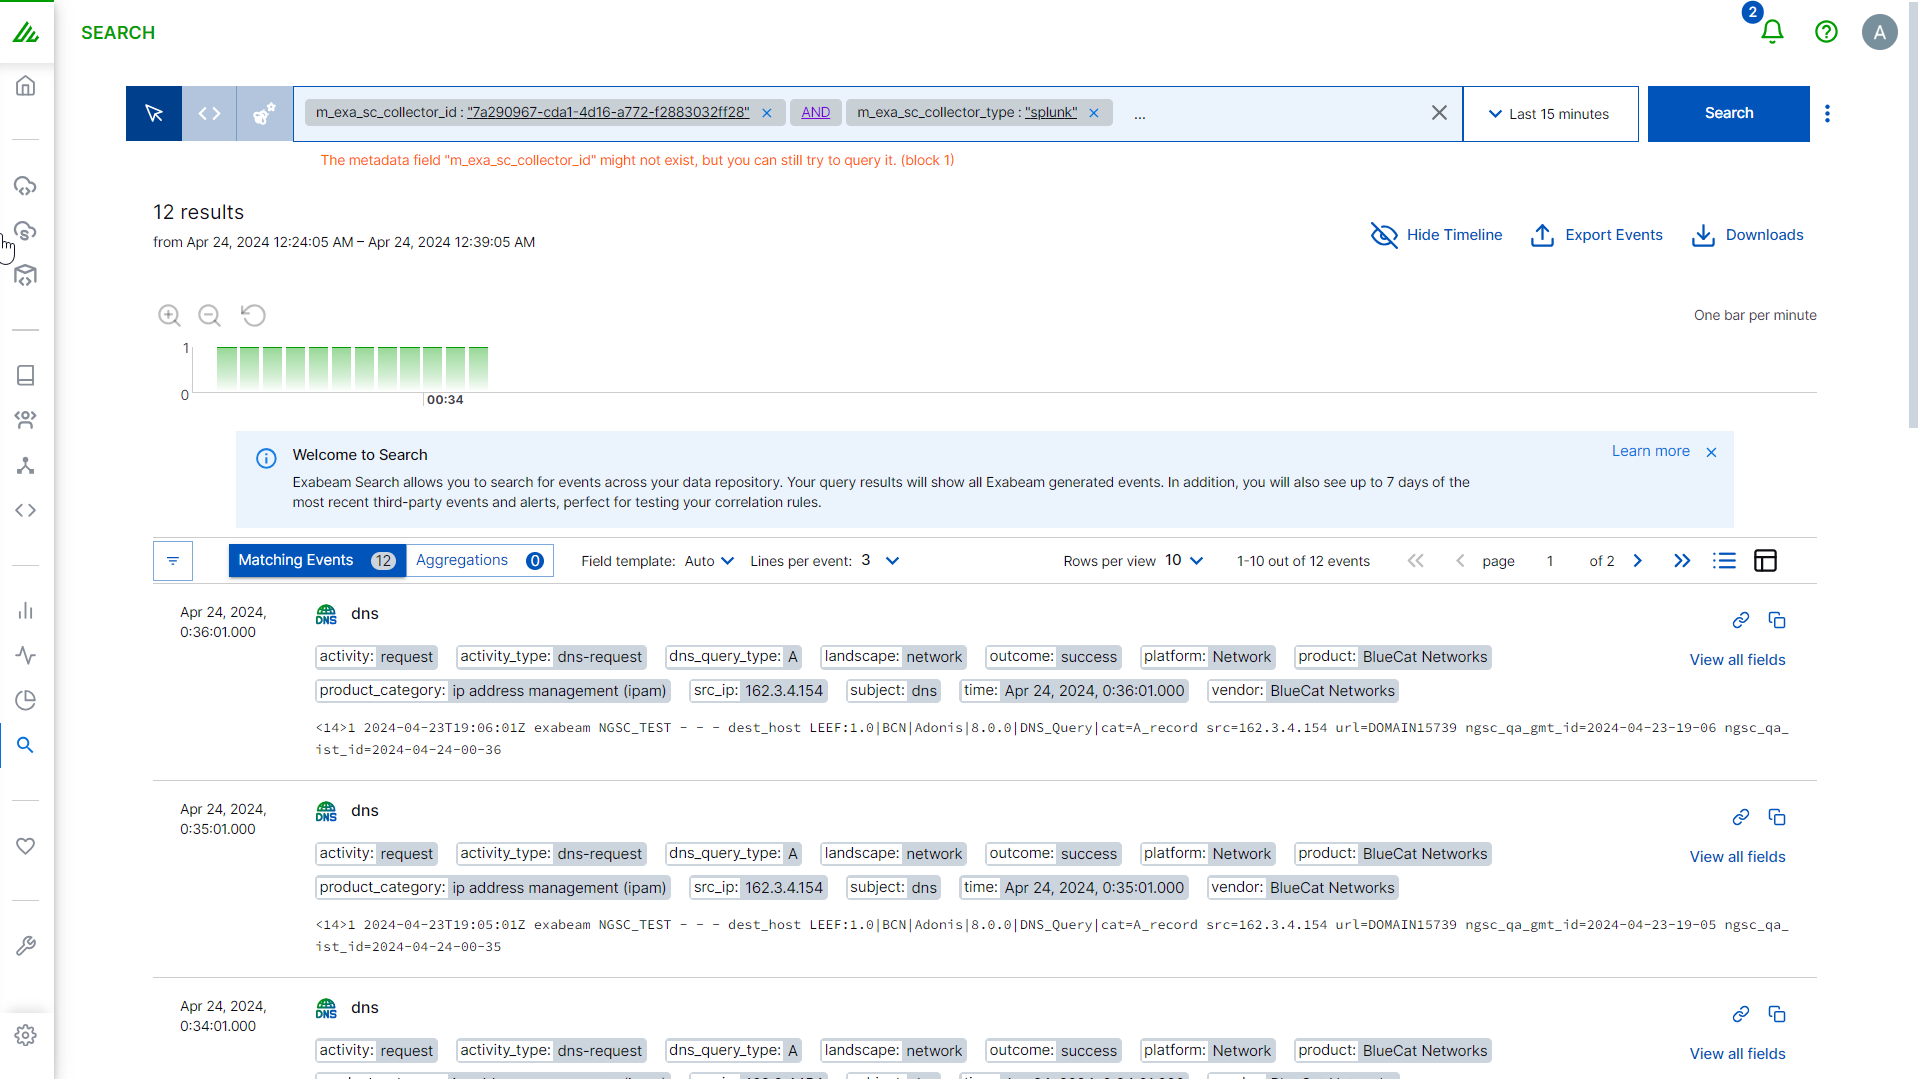
Open in Search – Click to open Search application in a new tab that displays a prepopulated Search query for viewing details of logs pertaining to the selected collector instance. You can modify the Search query with parameters and timeframe to filter logs to see details specific to a collector or a site collector instance.

Delete – Click to delete a collector instance.
Note
Alternatively, you can access the options to modify collector instances by selecting a check box for a particular Collector instance.

