- Site Collector Overview
- Get Started with Site Collectors
- Install Site Collector
- Set Up Collectors
- Sign Up for the Early Access Program: Site Collectors
- Choose the Right Collector based on Data Sources
- Set Up Archive Windows Collector
- Set Up Archive Linux Collector
- Set Up Direct Access Agent (DAA) Windows Event Collector
- Set Up EStreamer Collector
- Set Up Fortinet Collector
- Set Up IBM Security QRadar Collector
- Set Up Kafka Collector
- Set Up Splunk Collector
- Set Up Linux File Collector
- Set Up Microsoft SQL Collector
- Set Up MySQL Collector
- Set Up Oracle Collector
- Set Up Syslog Collector
- Set Up Windows Active Directory Collector
- Set Up Windows Event Log Collector
- Set Up Windows File Collector
- Manage Site Collectors
- Apply Antivirus Exclusions
- Migrate to the New-Scale Site Collectors Service
- Modify Collector Configuration
- Modify a Site Collector Instance
- Manage Templates
- Monitor Log Sources
- Add Filters to Set Egress Log Filtering Conditions
- New Site Collector Management Service NGSCD
- Regenerate Certificates for Collectors
- Upgrade the Site Collector
- Upgrade the Site Collector Specifications
- Vulnerability Remediation Policy
- Site Collector Monitoring
- Troubleshoot the Site Collector
- Pre-checks failed during Site Collector installation and upgrade
- Site Collector UI shows the status INSTALLATION_ERROR
- Download Support Packages for Troubleshooting
- How to reboot the Virtual Machine (VM) successfully to apply security updates?
- What information must be added while creating a support ticket to resolve an issue?
- Site Collector UI is not displaying the heartbeats
- Splunk Collector can't be set up
- Splunk Collector is set up however, logs are not reaching DL/AA
- Only a few of the installed Splunk Collectors are processing logs or EPS has dropped by 50% as compared to last hour
- The Windows Active Directory Collector (formerly known as LDAP Collector) is set up, however, the context data is not reaching DL/AA
- The Windows Active Directory Collector (formerly known as LDAP Collector) is stuck in the ‘Update’ mode after deployment
- Installation is initiated; however, the collector shows the status as ‘Setting Up’ for some time
- Data Lake and Advanced Analytics Does Not Show Context Data
- Context Data from Windows Active Directory Collector is Segmented
- Minifi Permission Denied - Logback.xml File Missing and Config File Update - Failed Error Occurred while Installing the Windows Event Log Collector
- Where should I upload proxy certificates if I am running proxy with TLS interception?
- How to upgrade Linux collector instance?
Monitor Log Sources
Using the Log Source Monitoring feature, you can easily monitor log sources on New-Scale Security Operations Platform and get notified of any issues, which prevents you from missing out on timely detections and potential attack alerts.
In addition to timely monitoring of each log source, the Log Source Monitoring feature provides you with:
Notifications about the designated log source if the log source becomes inactive and stops to transmit logs
Data alerting upon issue occurrence and proactive monitoring techniques applied at log source level
Capability to view silent log source cases in last 24 hours
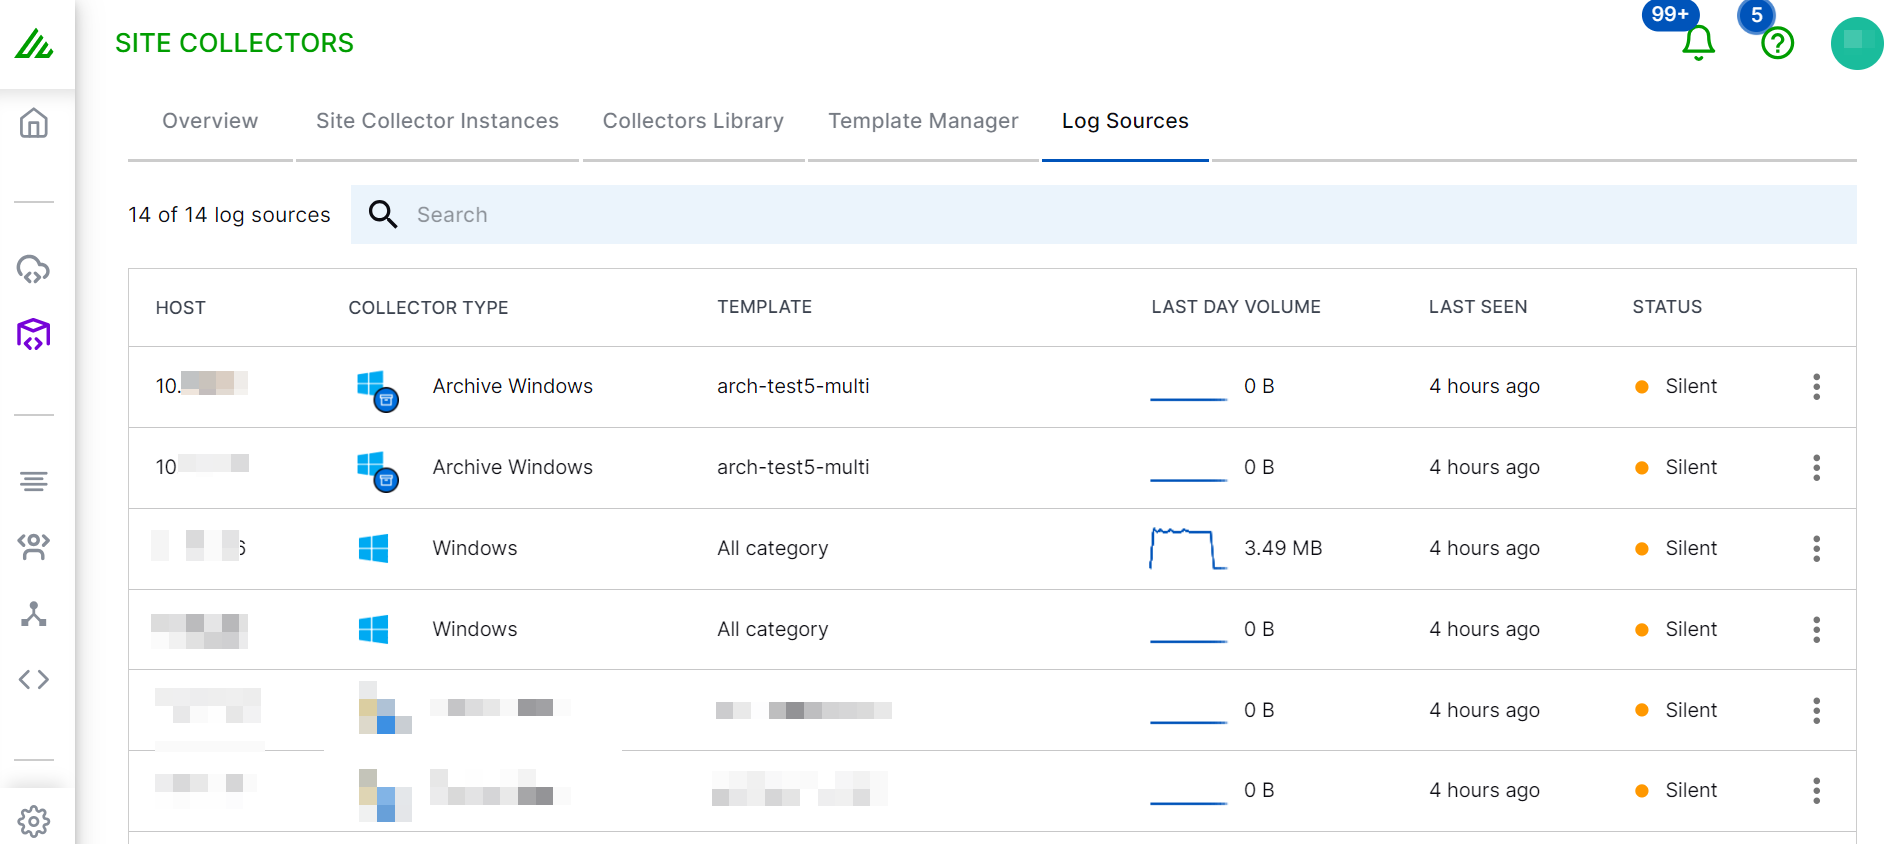
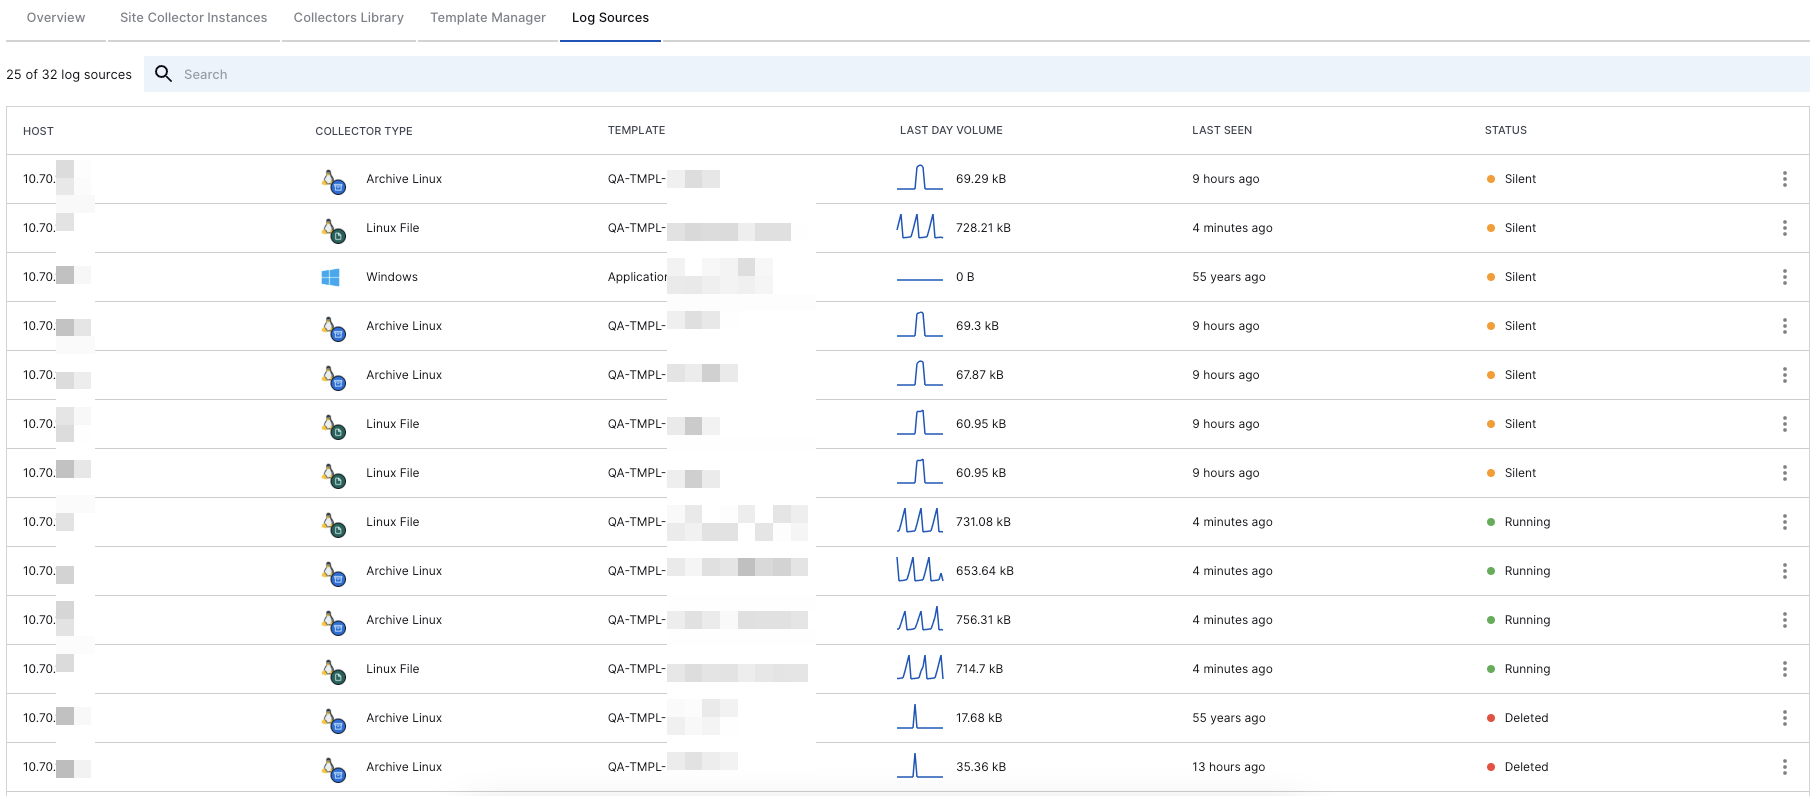
The following table describes each field displayed on the Log Sources tab. For each Collector instance, you can view the following information.
Field | Description |
|---|---|
Host | Source host or a virtual machine from which logs are sent to Site Collector. |
Collector Type | Type of the Collector: Windows Event Log, File, and Archive |
Template | Name of the template that you used for your Collector instance. |
Last Day Volume | The volume of raw log data or event logs from Windows Event Log collector, Windows File collector, Linux File collector, Windows Archive collector, and Linux Archive collector, for the last 24 hours. |
Last Seen | The time when the the log source sent logs. |
Status | The current status of the log source: Running, Silent, or Deleted.
|
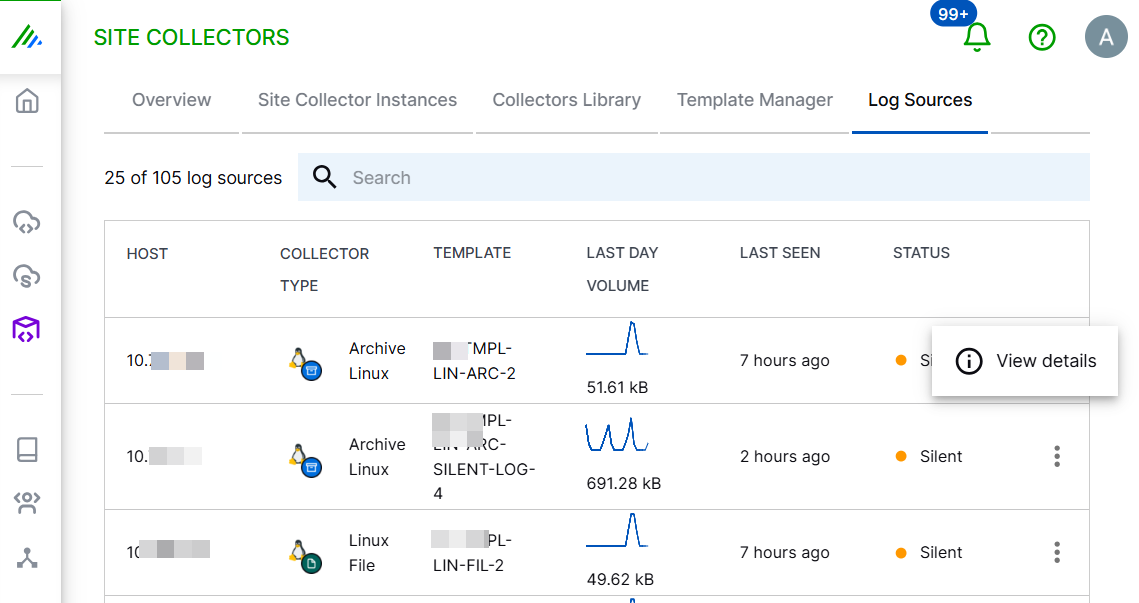
View Details | Detailed status information for the collector and error history for troubleshooting. |
View Log Source Details
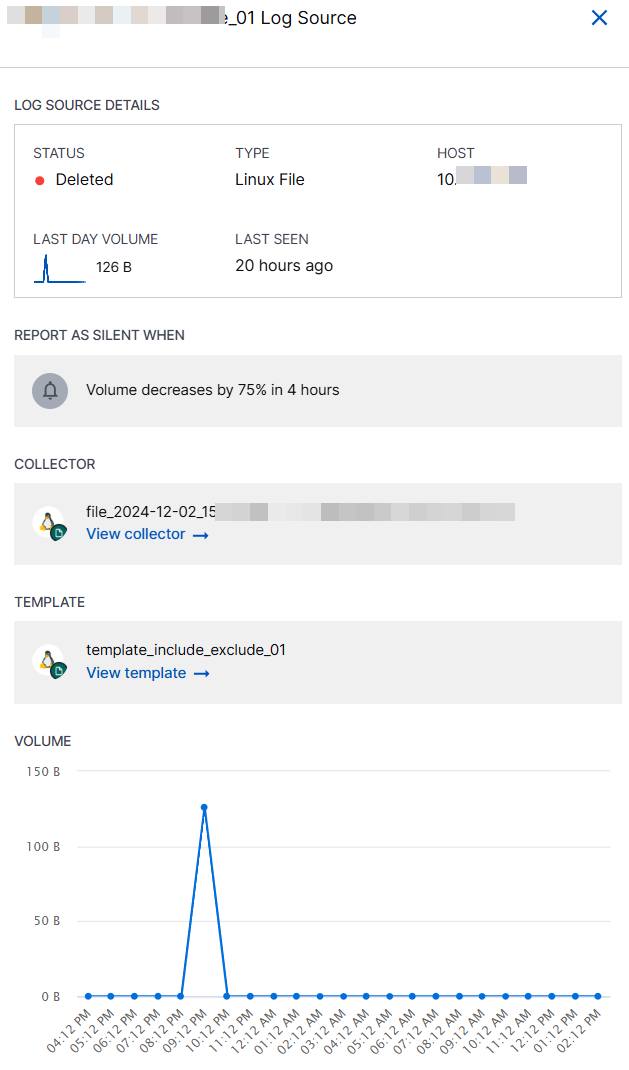
In the Log Sources section, you can view log source details such as status, type, host, last day volume, last seen, report of the silent log source, related collector and template, and the volume graph to indicate inactivity and reduction in log volume. You get In App notifications for the log sources that became Silent since last four hours.
A log source is a unique combination of an agent type, a template, and the host where it is deployed. Each log source represents a specific log category or type. For example, if a Windows Event Log Collector has two templates, one with security log events and the other with application log events deployed onto host 1 and host 2, four log sources are generated: host1 security events source, host2 security events source, host1 application events source, and host2 application events source.
To view log source details:
On the New-Scale Security Operations Platform home page, click the Site Collectors tile.
Click the Log Sources tab.
On the Log Sources tab, click the host for which you want to view log source details.
Alternatively, click View Details.
After viewing the log source details, to view the associated collector instance, click View collector. Or, to view the template that the collector uses, click View template.
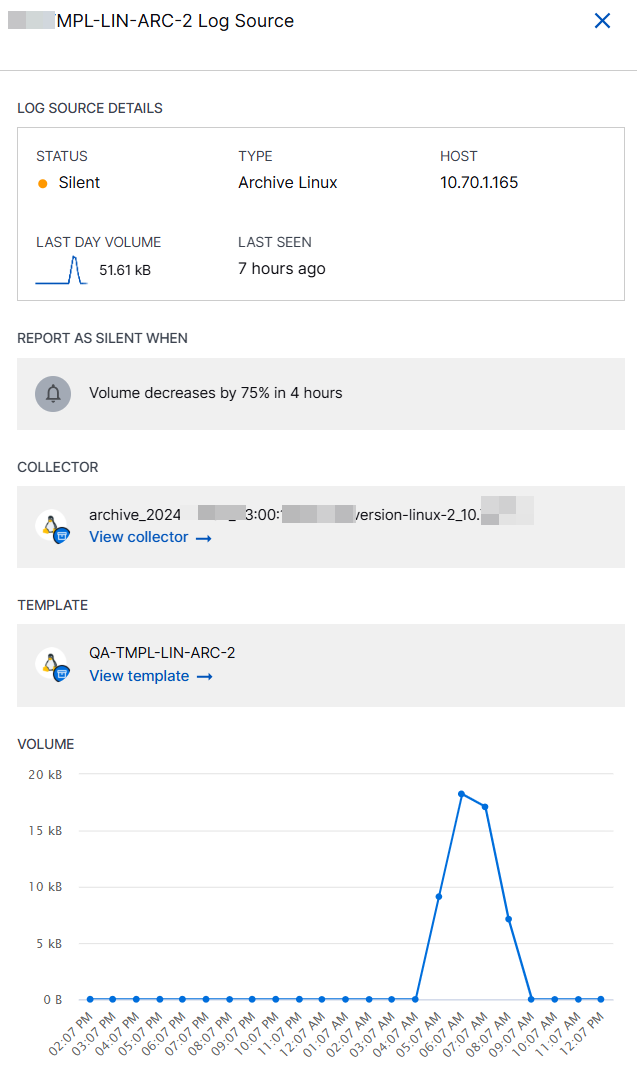
The log source details include status, type, host, last day volume, last seen, and a report of the silent log source. You can access the related collector and template. The volume section displays a graph to indicate volume of data ingested in past 24 hours for a log source.
View Notifications about Silent Log Sources
The notifications section that you can access by clicking the notifications icon ( ), displays notifications for the log sources that became Silent since last four hours.
For example: The data volume for the Windows File log source on host 10.70.0.123 with template windows-file-abc decreased by more than 75% over the past 4 hours.
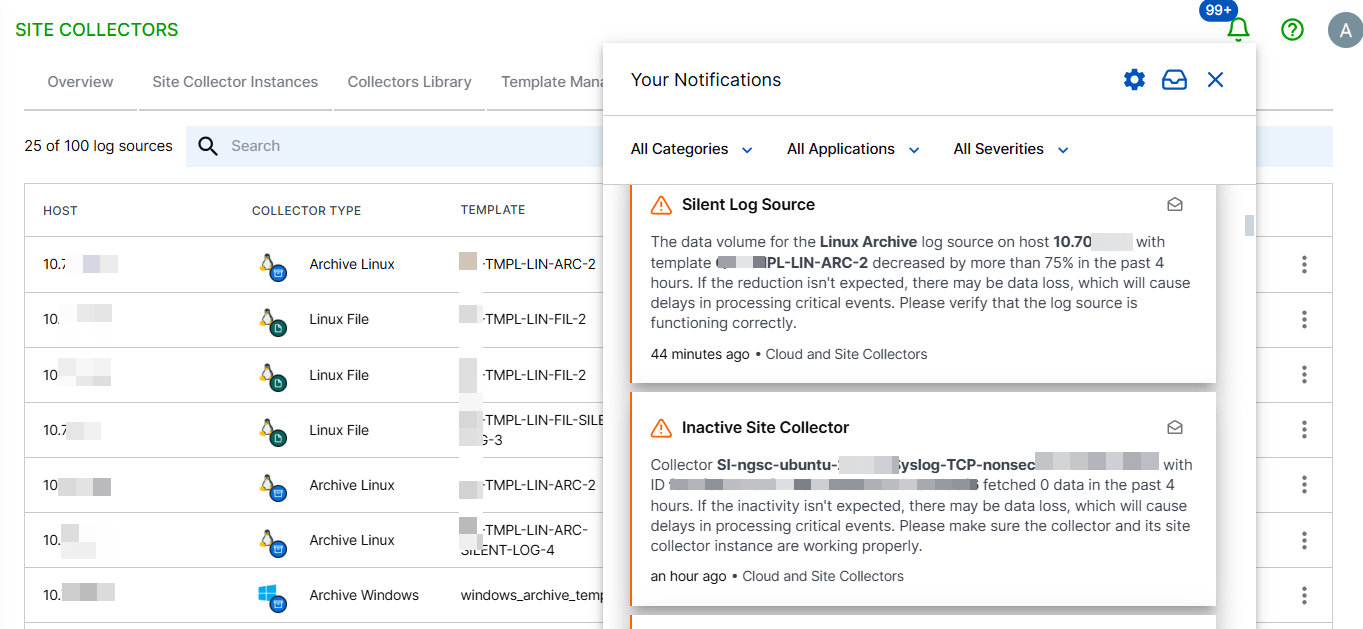
You get a notification every 2 hours for all the log sources that have Silent status as opposed to the log sources that are in Running and Deleted state.
If the sum of data ingested in the most recent four hours is 25% or lesser than the sum of data ingested in the preceding four hours, the log source is considered as silent and the relevant notifications are sent for that log source.
Refer to the following screenshot for an example of a notification about a silent log source.
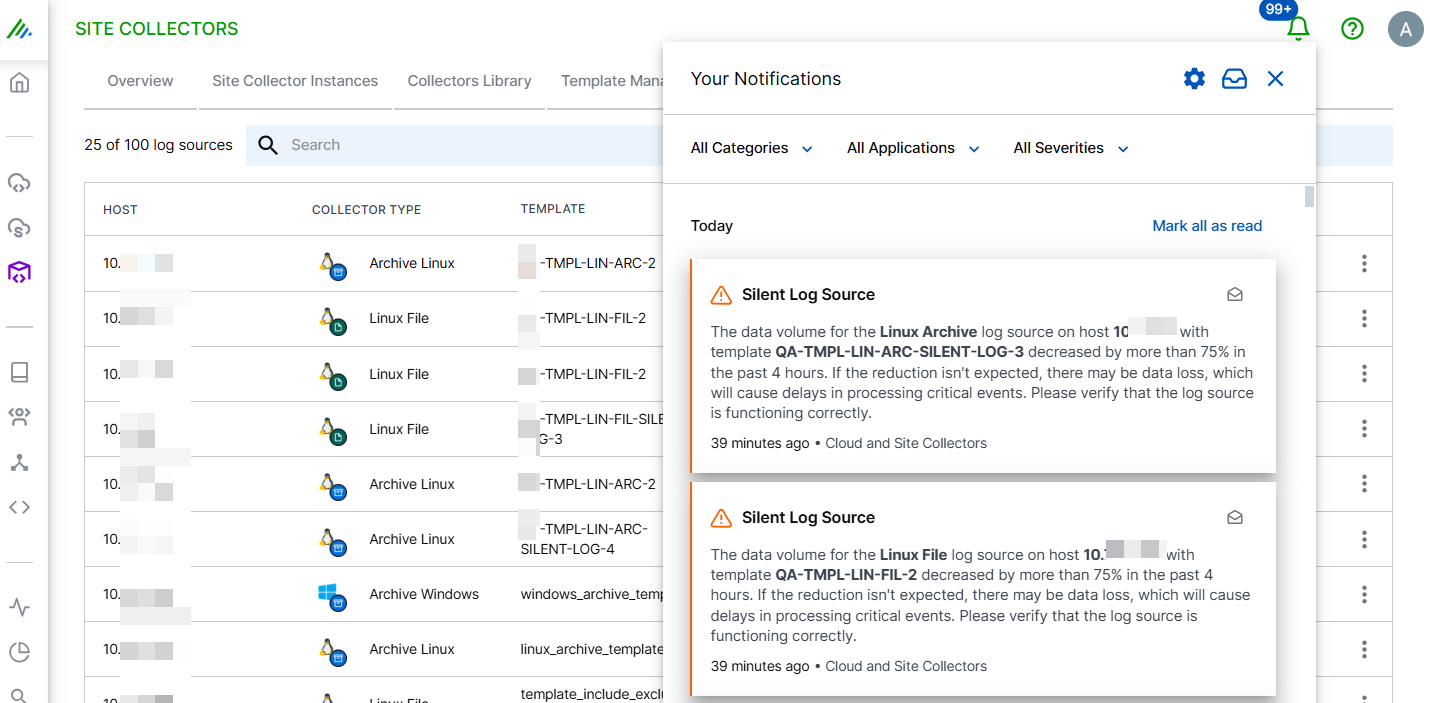
Refer to the following screenshot for an example that indicates less volume of data ingested in past 20 hours for a log source.
