- 2026 Release Notes
- May 2026
- April 2026
- March 2026
- February 2026
- January 2026
- 2025 Release Notes
- December 2025
- November 2025
- October 2025
- September 2025
- August 2025
- July 2025
- June 2025
- May 2025
- April 2025
- March 2025
- February 2025
- January 2025
- Known Issues
March 2026
The New-Scale Security Operations Platform includes the following addressed features and new features for March 2026.
Agent Behavior Analytics
Feature | Description |
|---|---|
ChatGPT Enterprise | ChatGPT Enterprise support with Agent Behavior Analytics (ABA) is now available, delivering enhanced security and comprehensive visibility and control of AI-driven activity through:
For more information, see ChatGPT Enterprise Cloud Collector in the Cloud Collectors Administration Guide. |
Microsoft Copilot | Microsoft Copilot support with Agent Behavior Analytics (ABA) is now available, delivering enhanced security and comprehensive visibility and control of AI-driven activity through:
For more information, see Microsoft Copilot Integration in the Cloud Collectors Administration Guide. |
New Detections | New AI-driven detections are now available, focusing on AI behavior baselining to identify abnormal activity:
For more information, see the Content Package 2026.3.1 Release Notes. |
Attack Surface Insights
Feature | Description | |
|---|---|---|
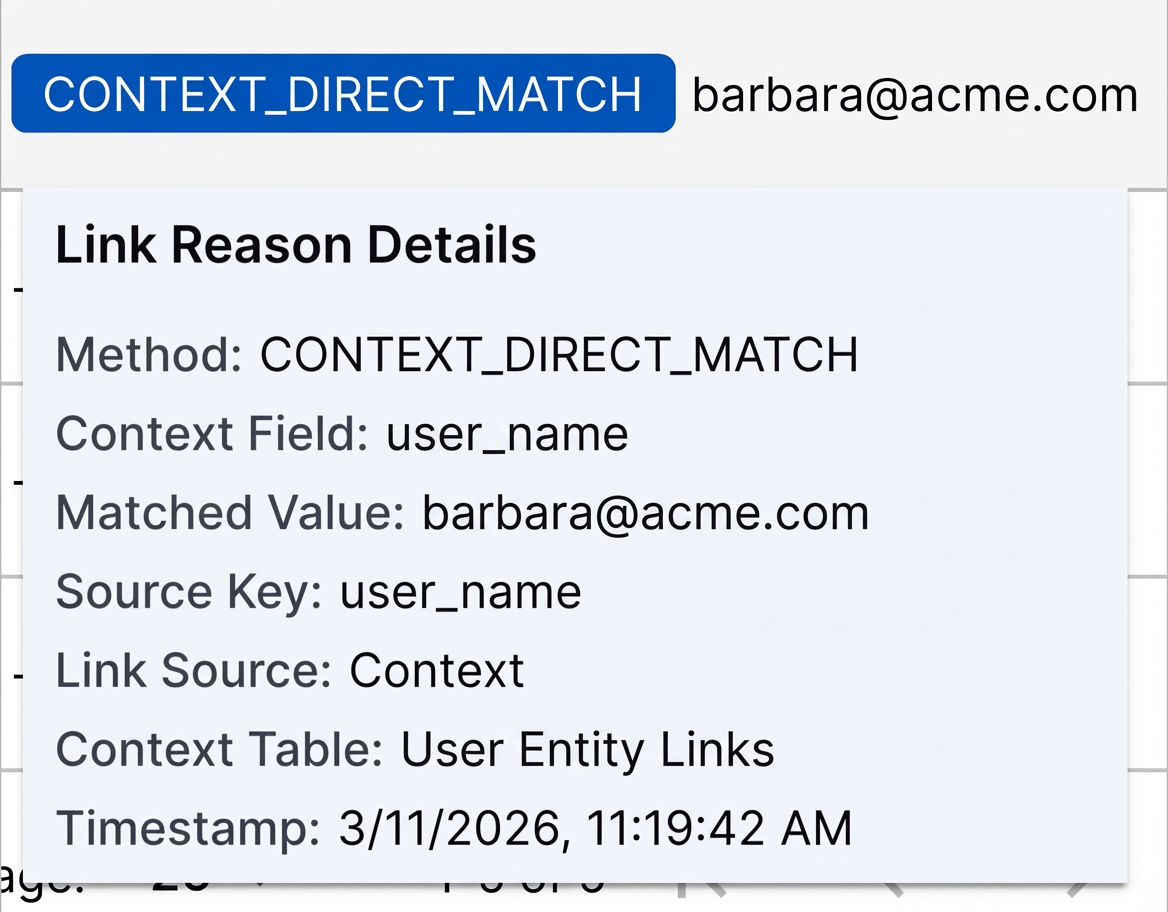
User Entity Account Link Reasons | To easily understand and troubleshoot linking between user entities and context, you can now view the methods and fields used to link user entities with their accounts under the Link Reasons column. When you click View linked accounts in user entity details, you can view the link method and the matched field value linking the account to the entity under the Link Reasons column: 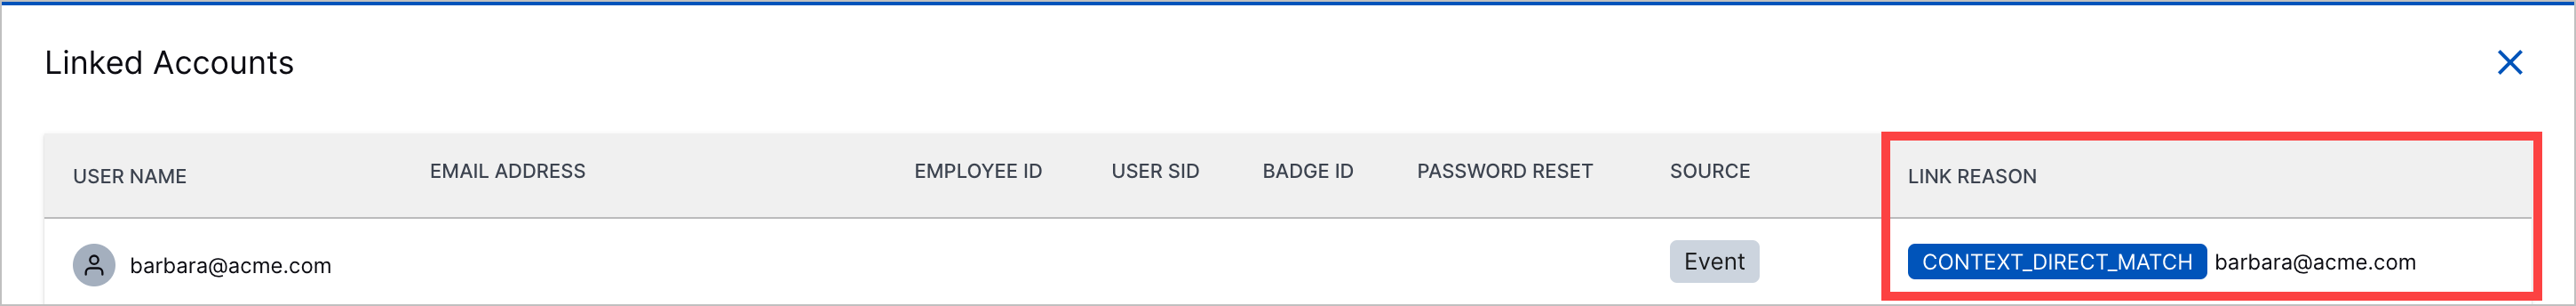 When you hover over the column value, you can view more information about the link, like the context field, entity attribute, and context table used for linking:
You can view link reasons for newly created entities only. Link reasons aren't available for existing entities. | |
Automatic Bulk Tag Removal | You can now automatically remove tags from multiple entities at once using Attack Surface Insights rules. In the Attack Surface Insights rules actions, you can now set the rule to remove tags. 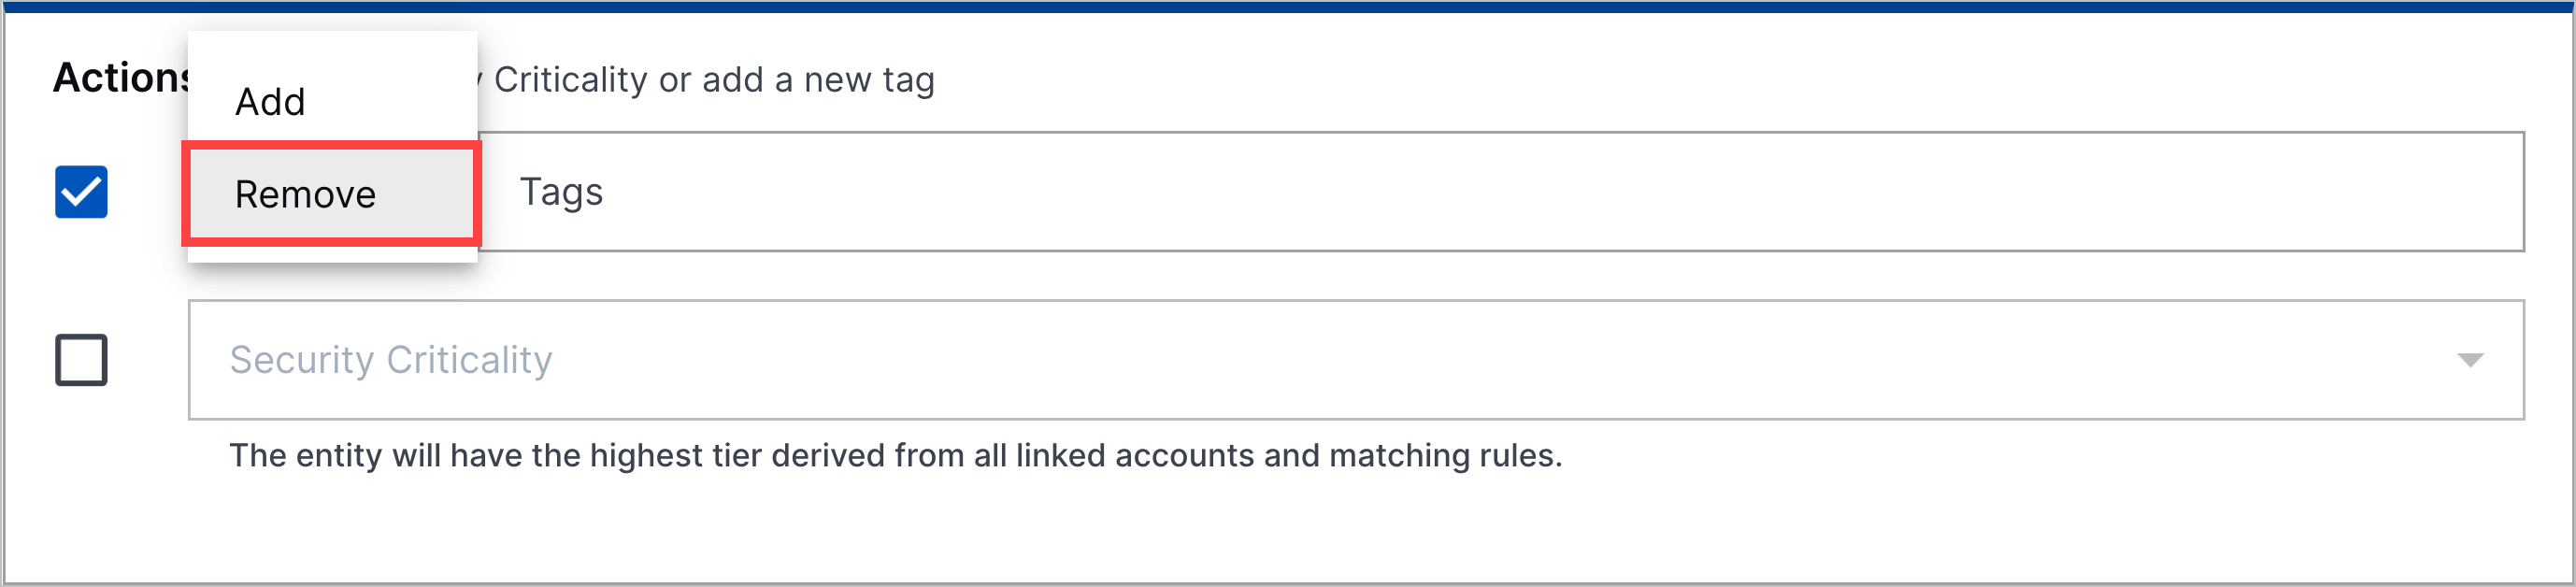 If a pre-built Attack Surface Insights rules was configured to add tags, you can't edit it to remove tags. | |
Entity Type Creation Control | To prevent duplicate or erroneous entities from being created, you can now control which types of entities Attack Surface Insights creates using Log Stream enrichment rules. You can now create enrichment rules using two new
 The existing | |
Individual Entities for Local Administrator Accounts | To accurately identify local administrator accounts, accounts like administrator and root accounts are now treated as distinct entities. If both of the following conditions are true:
The entity is not linked to context, resulting in a distinct, individual entity. ExampleIn an event, Attack Surface Insights identifies the In context, it finds the Because both values contain a hyphen and the prefix is Admin, Attack Surface Insights does not link the entity to the context record. The entity remains a standalone entity. ExampleIn an event, Attack Surface Insights identifies the In context, it finds the Because both values contain a hyphen and the prefix is Administrator, Attack Surface Insights does not link the entity to the context record. The entity remains a standalone entity. |
Automation Management
Feature | Description |
|---|---|
Manual Playbook Execution for Manually Created Cases | To respond consistently to all cases, you can now manually run Automation Management playbooks on manually created Threat Center cases. 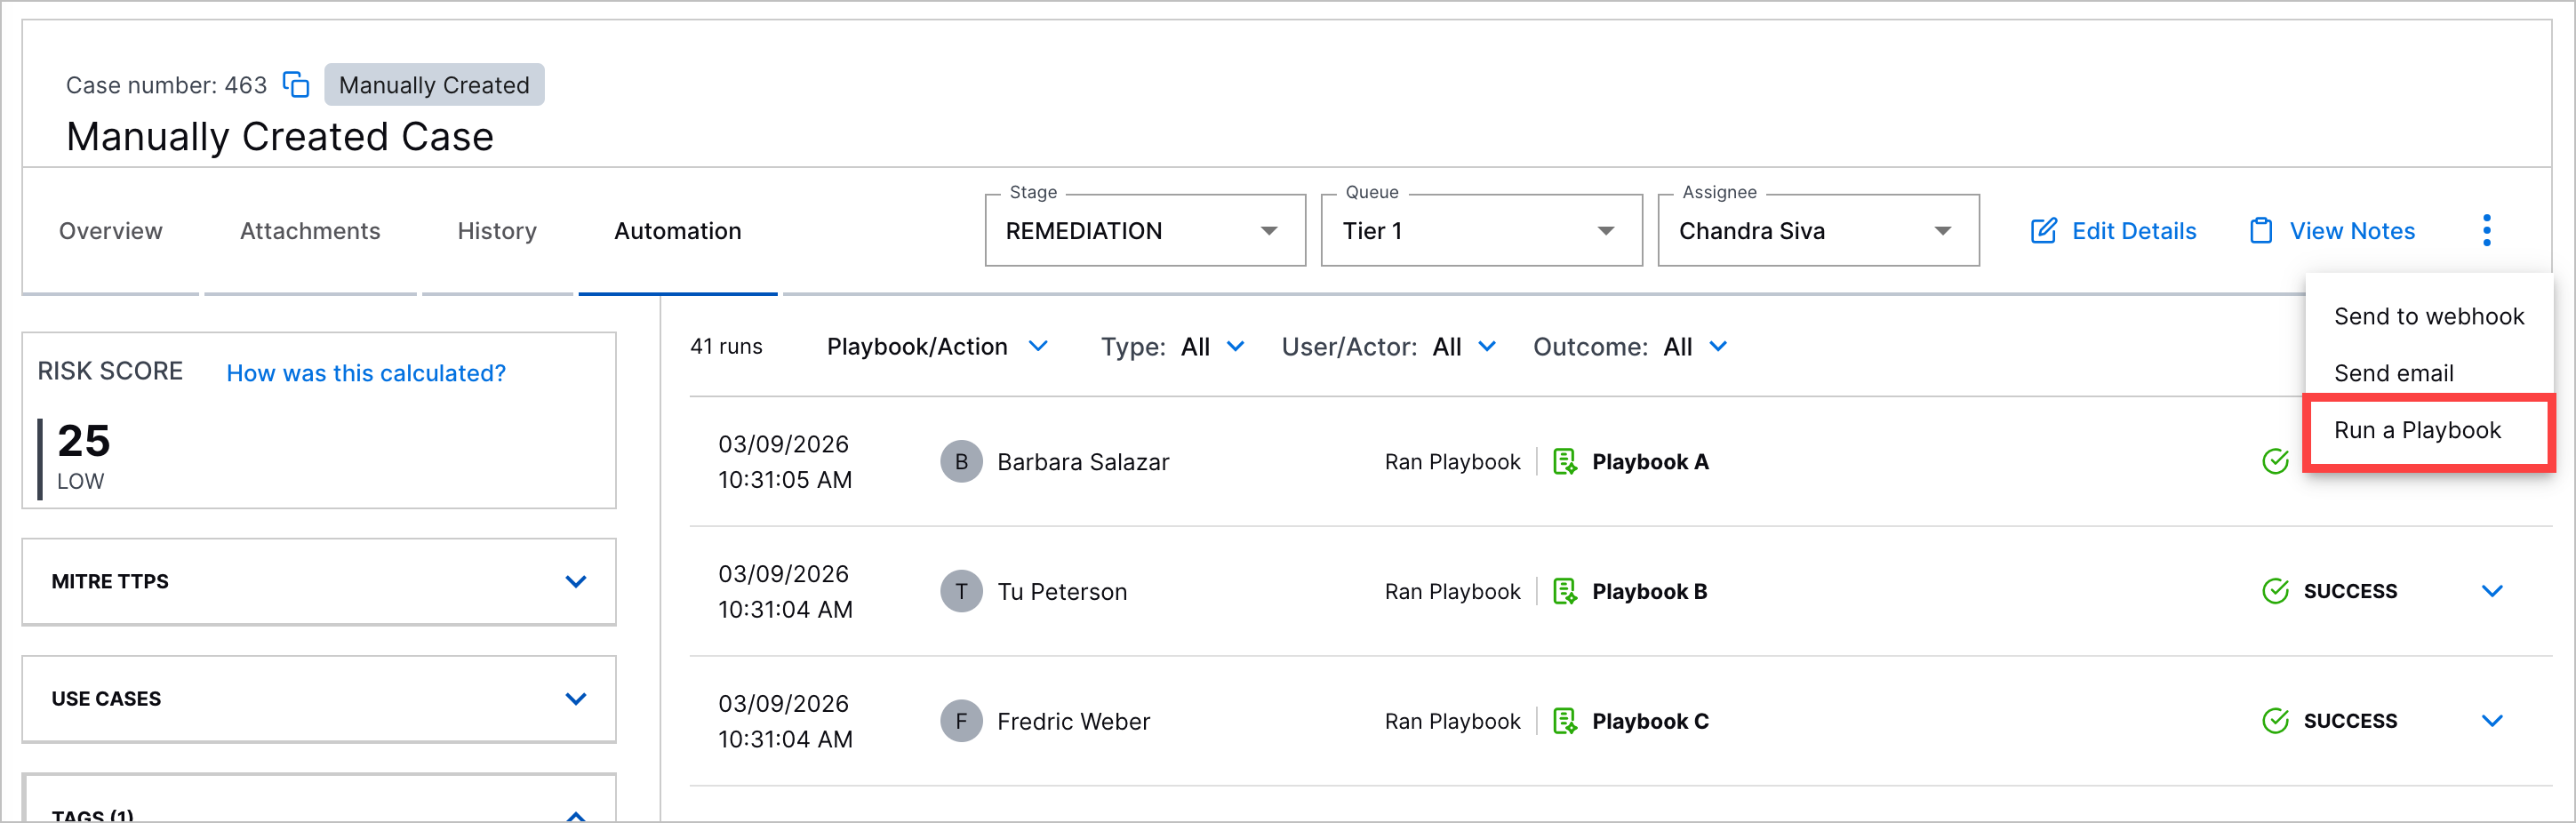 |
Automation History for Manually Created Cases | You can now view a history of all Automation Management playbooks run on manually created Threat Center cases under the case Automation tab. 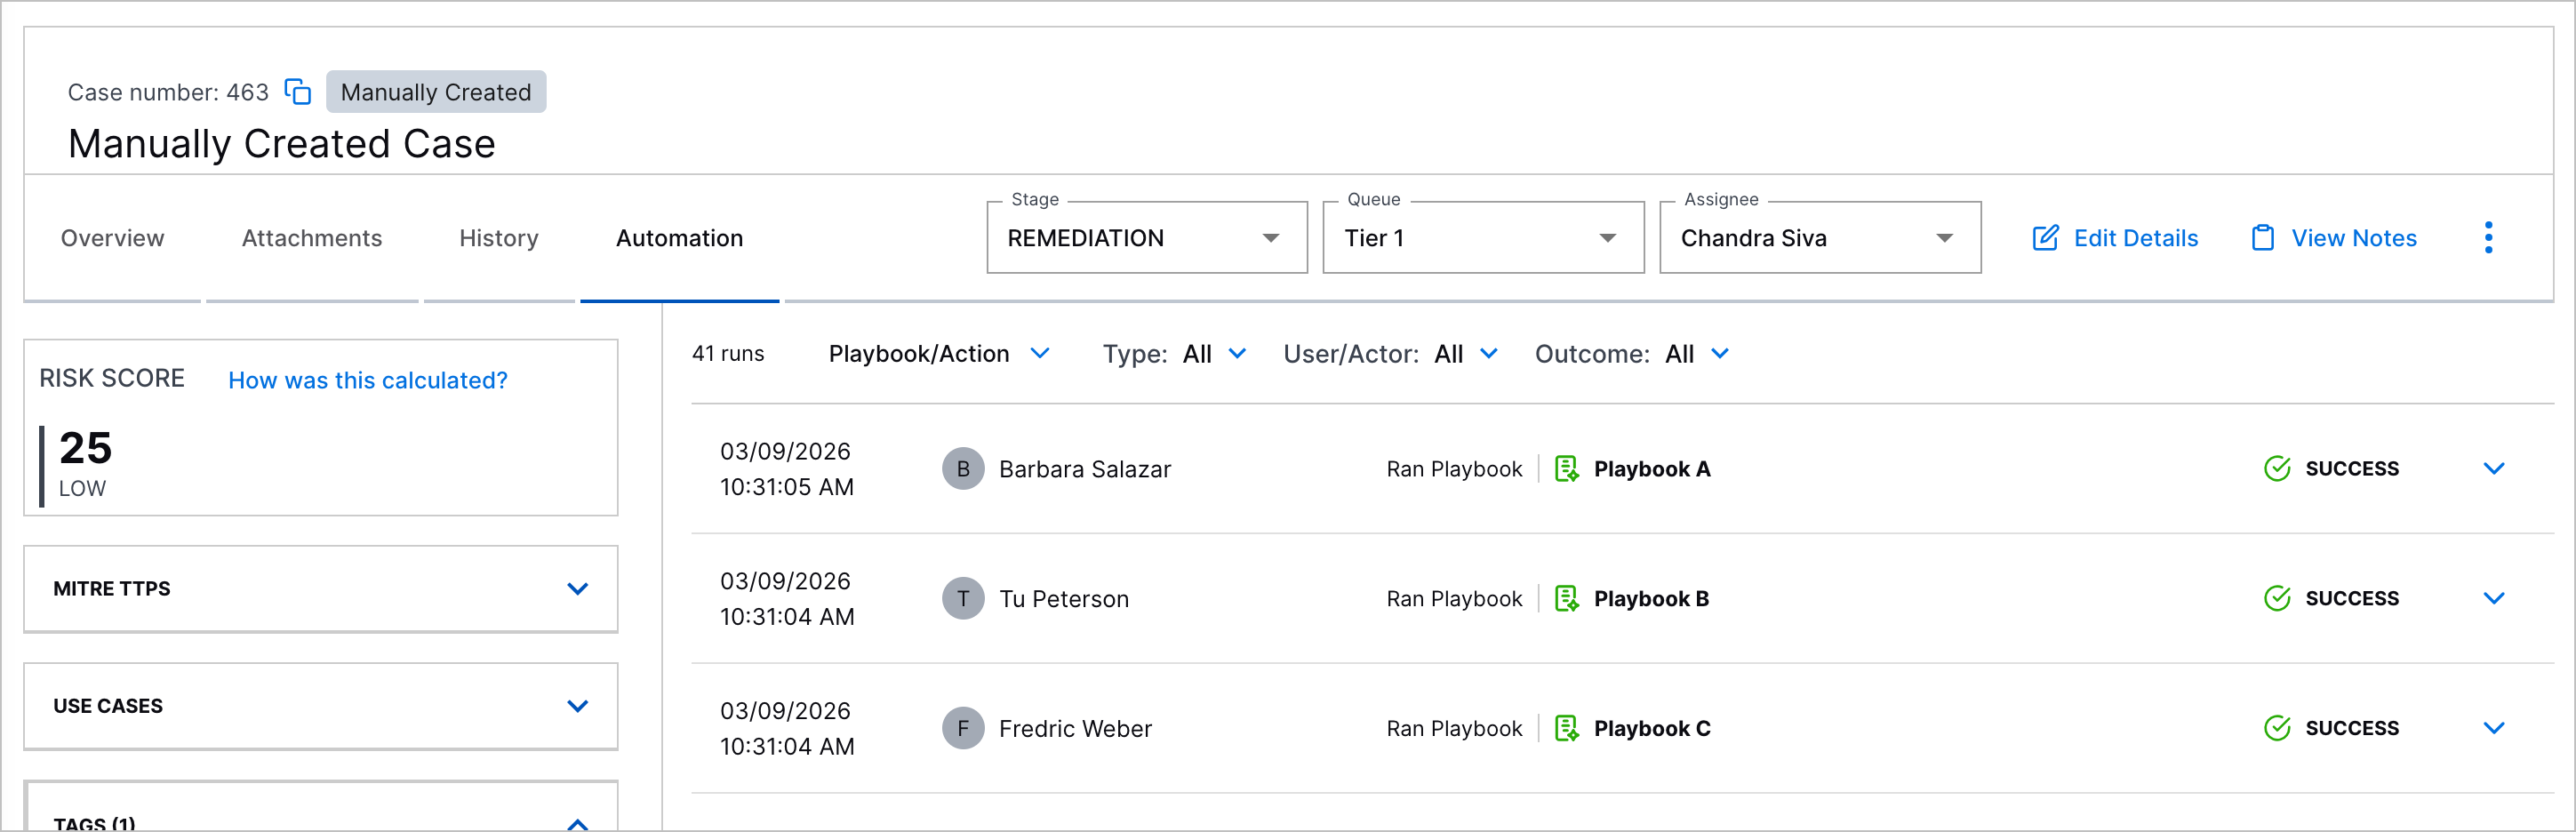 |
Automation Agent Security Enhancements | You can now more securely run automation agents with high and critical severity vulnerability fixes for remote code execution and sensitive data exposure. |
Cloud Collectors
Feature | Description |
|---|---|
ChatGPT Enterprise Cloud Collector | The ChatGPT Enterprise Cloud Collector is now available as part of Cloud Collectors to facilitate ingestion of data from your ChatGPT Enterprise. |
Enhancements for Microsoft Entra ID Context Cloud Collector | In user-based Microsoft Entra ID context tables, you can now see new column. The collector now supports the following attributes:
To use the new functionalities, ensure that you assign the API permission |
Early Access Collectors | |
Phishing Email Inbox Cloud Collector | The Phishing Email Inbox Cloud Collector is now available as part of Cloud Collectors Early Access program, to facilitate monitoring of Phishing mailbox for Phishing email threats and ingestion of specific metadata and logs specific metadata and information such as sender and recipient addresses, subject lines, originating IP addresses, and attachment details such as file names. The early access program offers you an opportunity to gain access to the latest cloud collectors before their official release. To participate, see Sign Up for the Early Access Program. |
Context Management
Feature | Description |
|---|---|
Additional Fields Supported in Microsoft Entra ID User Context Tables | In user-based Microsoft Entra ID context tables, new columns have been added to the default mapping. The addition of these columns introduces support for the following attributes:
These new columns are available for all new and existing Microsoft Entra ID user context tables. To include them in the display for an existing table, open a table and use the Manage Columns option to select the new columns for display. For information about the new columns, see Default User Attribute Mapping for Microsoft Entra ID in the Context Management Guide. |
New Agent Behavior Analytics Context Tables | New pre-built detection tables are available in Context Management to cover AI/LLM activity. These tables can be referenced when building analytics rules in downstream application. The new Agent Behavior Analytics context tables include the following:
These tables are empty by default and must be populated with items relevant to your company or environment. For more information, see Agent Behavior Analytics Context Tables in the Context Management Guide. |
New Detection Context Table for New-Scale Analytics | Two new pre-built context tables are available to support detection activity in New-Scale Analytics:
For more information about these new context tables, see New-Scale Analytics Context Tables in the Context Management Guide. |
Dashboards
Feature | Description |
|---|---|
Threat Center Dashboard Enhancements | You can now better monitor Threat Center cases closures using new measures, dimensions, and visualizations:
For more information, see the Threat Center release notes. |
Introducing the Home Dashboard | A new Home tab has been introduced in the Dashboards application. It serves as the landing page that you will see first whenever you open the Dashboards application. You can assign your most essential or frequently-used dashboard to be the default view on the Home tab, ensuring quick easy access to the insights you need most. The Home tab is always available from the top of the Dashboards window. After you designate a specific dashboard as the Home tab default, you have one-click access to return to it from any other tab in the application. You can also easily remove a dashboard from the Home tab and assign a different dashboard as the default view. You can assign any pre-built Exabeam dashboard, custom dashboard, or draft dashboard as the default home view. For more information about assigning and working with the Home tab, see The Home Tab in the Dashboards Guide. |
Log Stream
Feature | Description | ||
|---|---|---|---|
Enrichment Rule Priority Ordering | In this release, functionality has been added so you can configure the order in which your custom enrichment rules are applied to logs. On the Enrichments tab, click the new Reorder button to open a Reorder custom enrichers dialog box. You can manually reorder the custom enrichers to suit the priority order you need. For more information about working with enrichment rules, see Enrichments in the Log Stream Guide. | ||
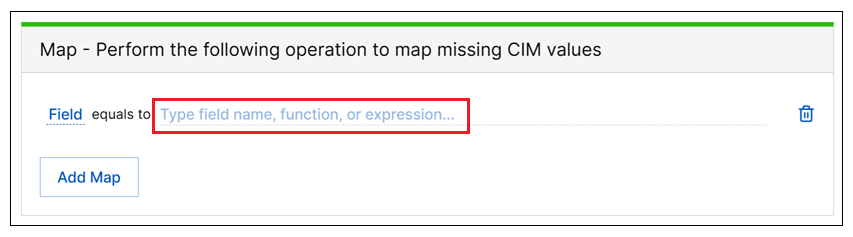
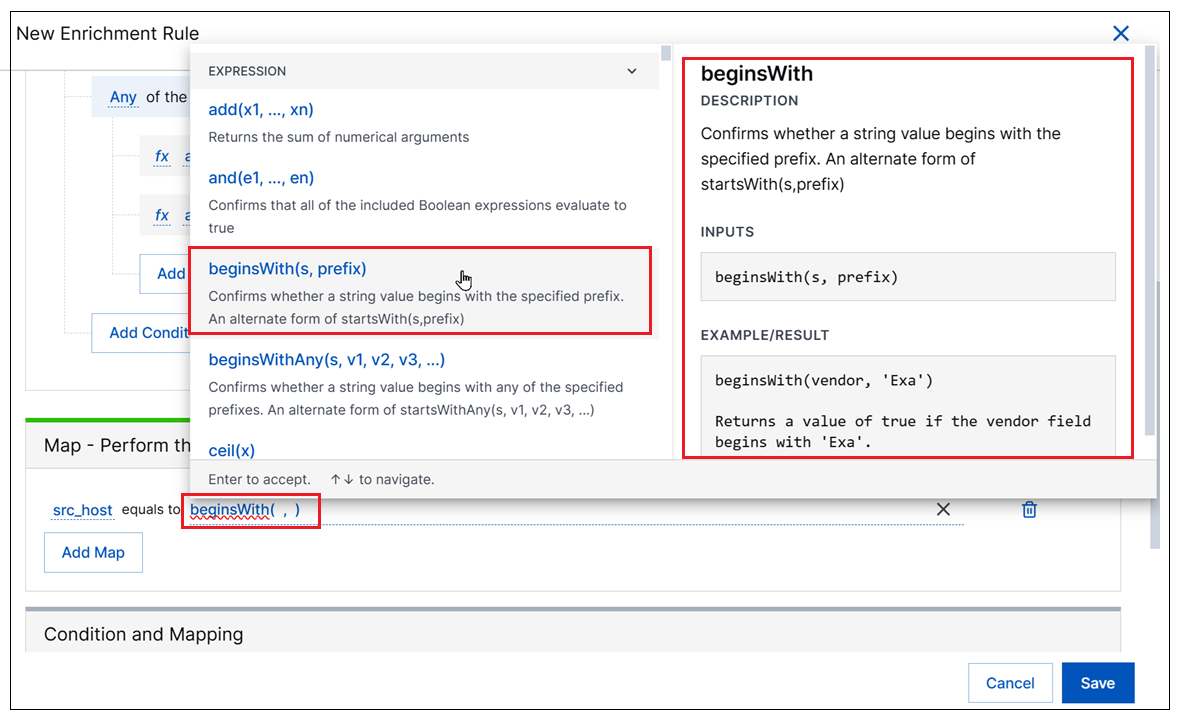
Enricher Field Mapping Improvements | A new selection menu has been added to streamline the process of defining a field mapping statements in a new custom enrichment rule. The new selection menu is available by clicking the mapping statement field. When it opens, it shows the list of available Expressions first and, below it, a list of available Fields.
When the Expressions list is expanded, available expressions appear on the left and information about using each expression appears on the right, including a description and the input syntax. This information provides on-the-spot guidance to help ensure the syntax for a specific expression is entered correctly. A link to the documentation about available expressions is also provided directly in the new menu.
For more information, see Define an Enrichment Rule in the Log Stream Guide. |
New-Scale Platform
Feature | Description |
|---|---|
Global Search | A global search bar is now as an Early Access feature available platform-wide to help locate entities such as users and devices in a single, integrated search. 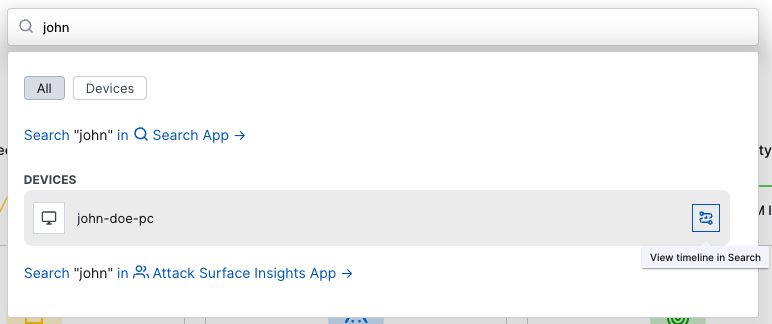 When further analysis is needed, you can quickly navigate from the search into specific apps for further advanced searching and investigation. For more information, see Navigation Center in the New-Scale Security Operations Platform Administration Guide. As an Early Access feature, contact your account team to inquire about availability. |
Outcomes Navigator
These features were released on March 30, 2026.
Feature | Description |
|---|---|
Compliance Coverage | You can now use Outcomes Navigator to measure and track your coverage of compliance frameworks. With this release, you can track your coverage of the HIPAA and PCI DSS compliance frameworks. For a selected compliance framework, you can get an overview of how well your environment is configured to meet compliance requirements and use a Compliance Coverage Score to quantify your coverage and track your compliance progress over time. 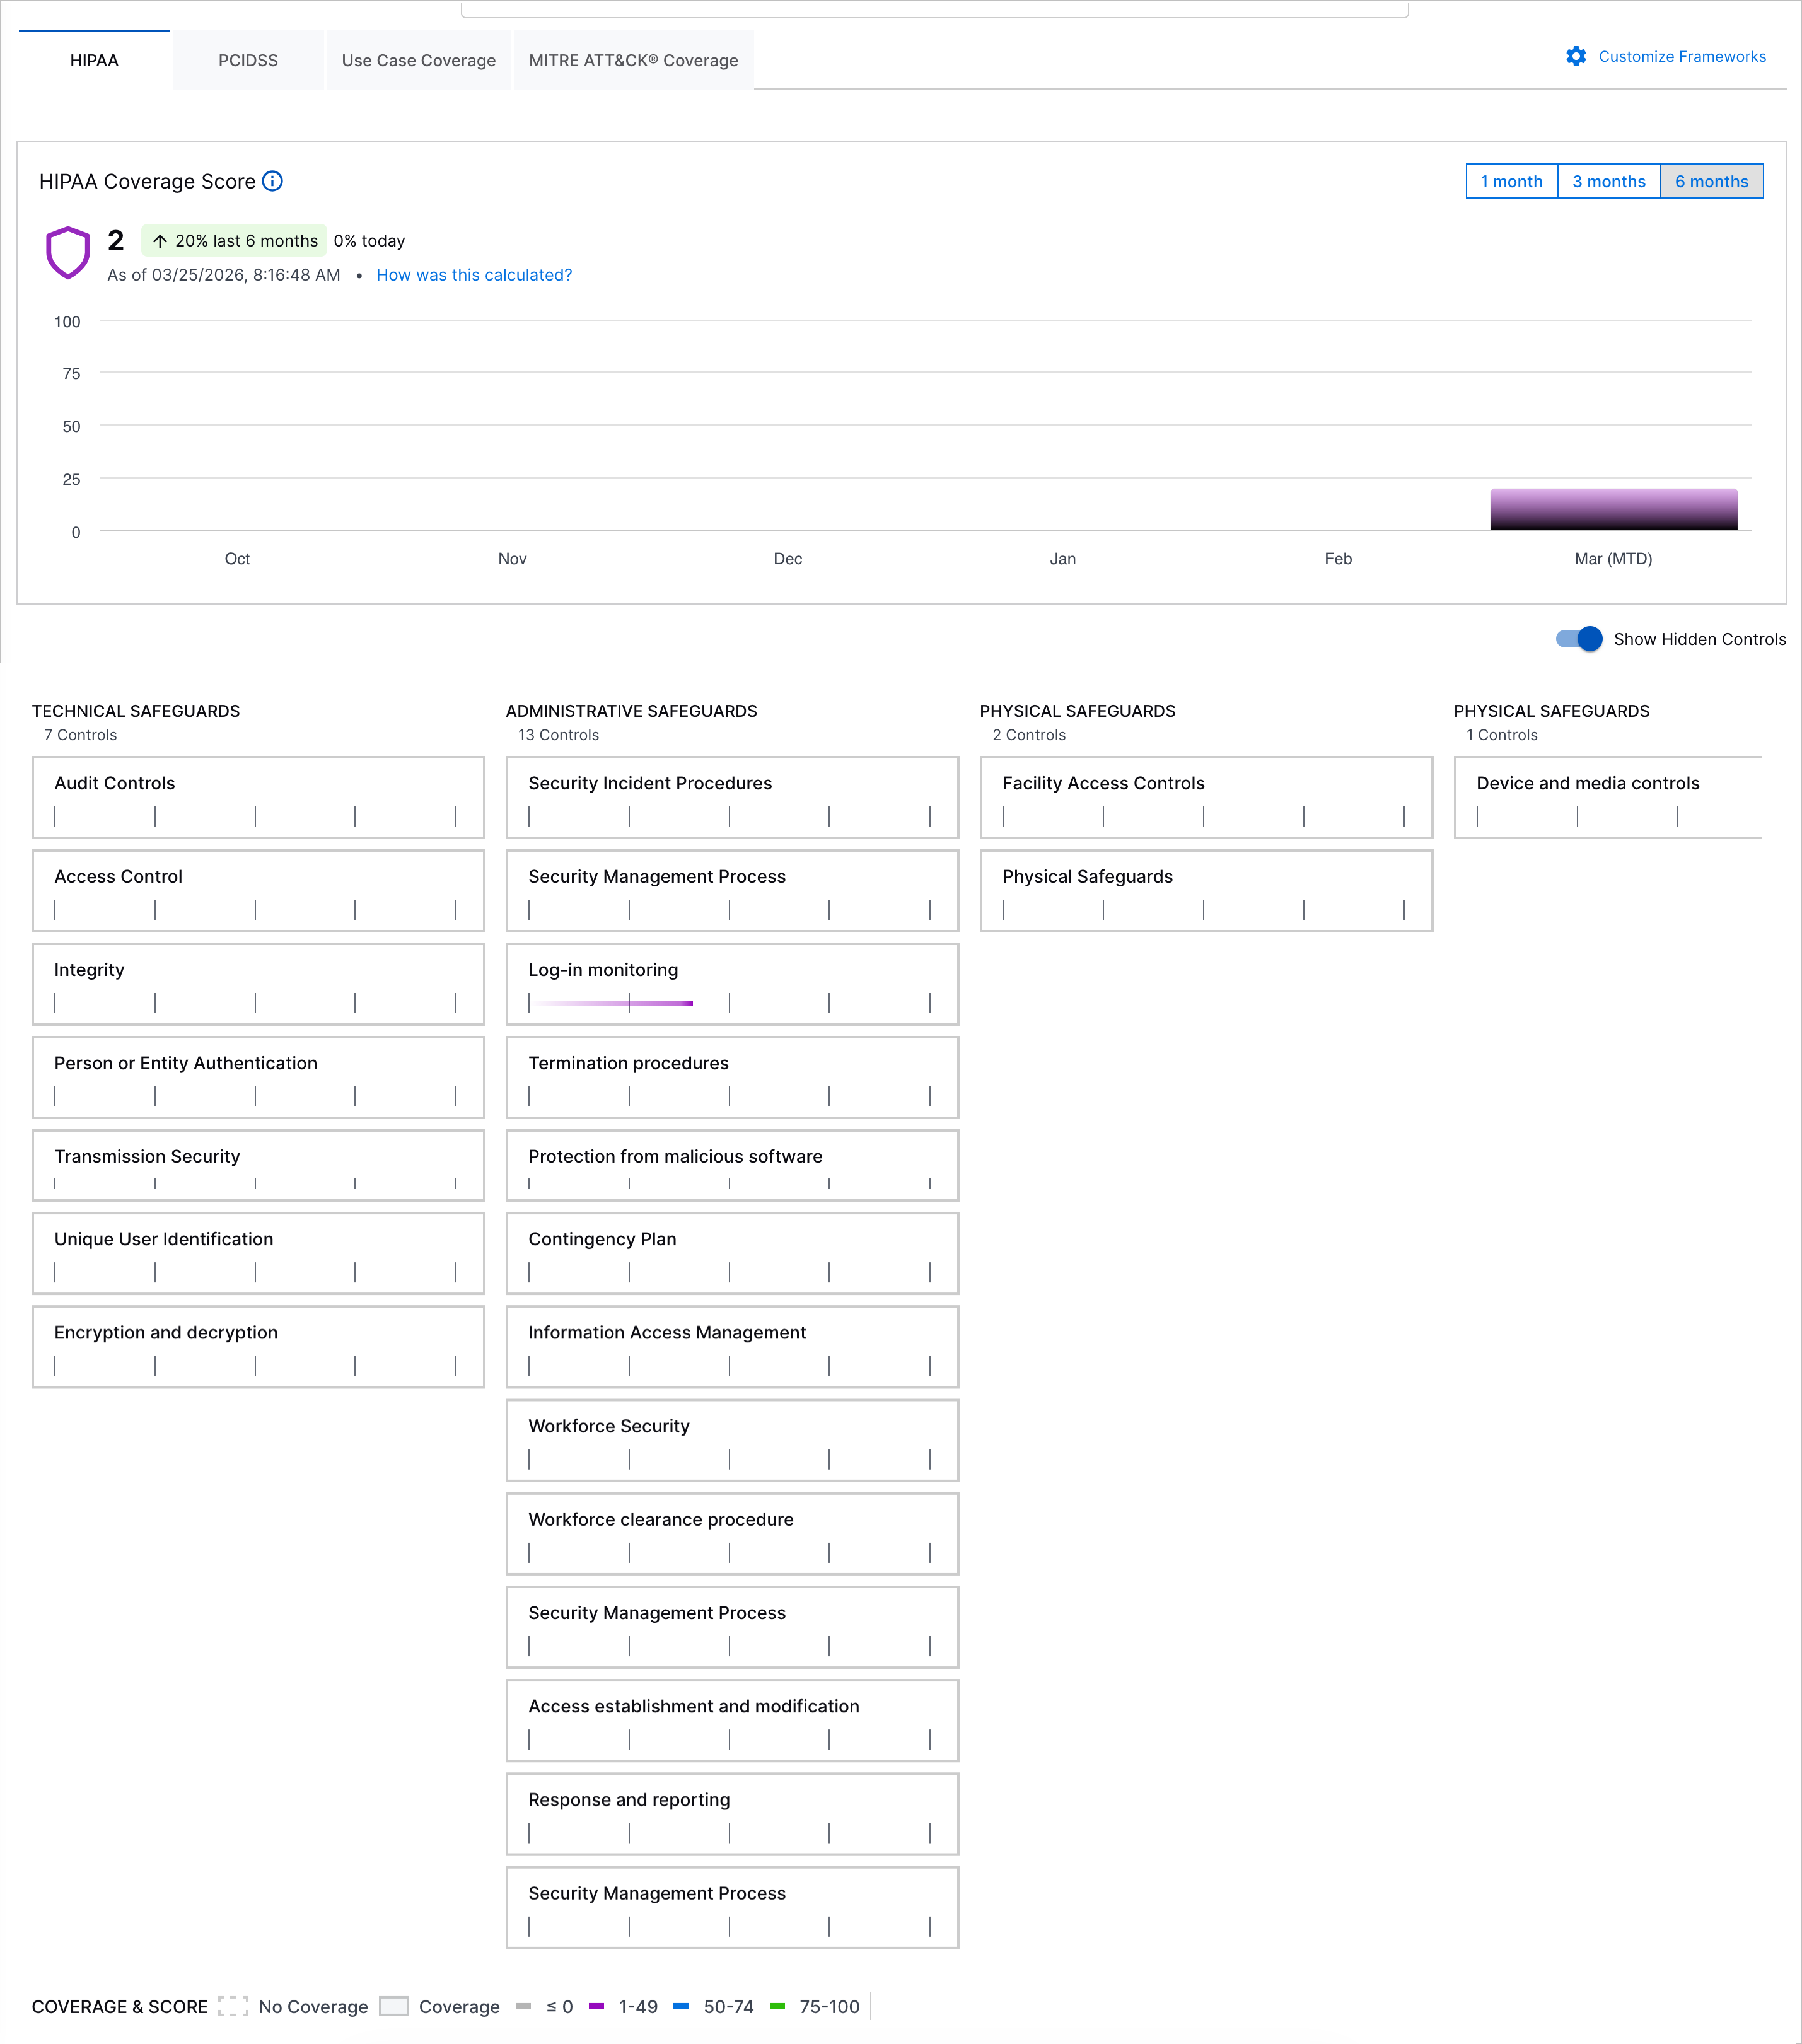 |
Customizable Frameworks | To create a more focused view, you can now customize which frameworks you can see and work with in Outcomes Navigator. You can select from Exabeam Threat Detection, Investigation, and Response (TDIR) Use Case Categories framework, MITRE ATT&CK® framework, the HIPAA framework, and the PCI DSS compliance framework. 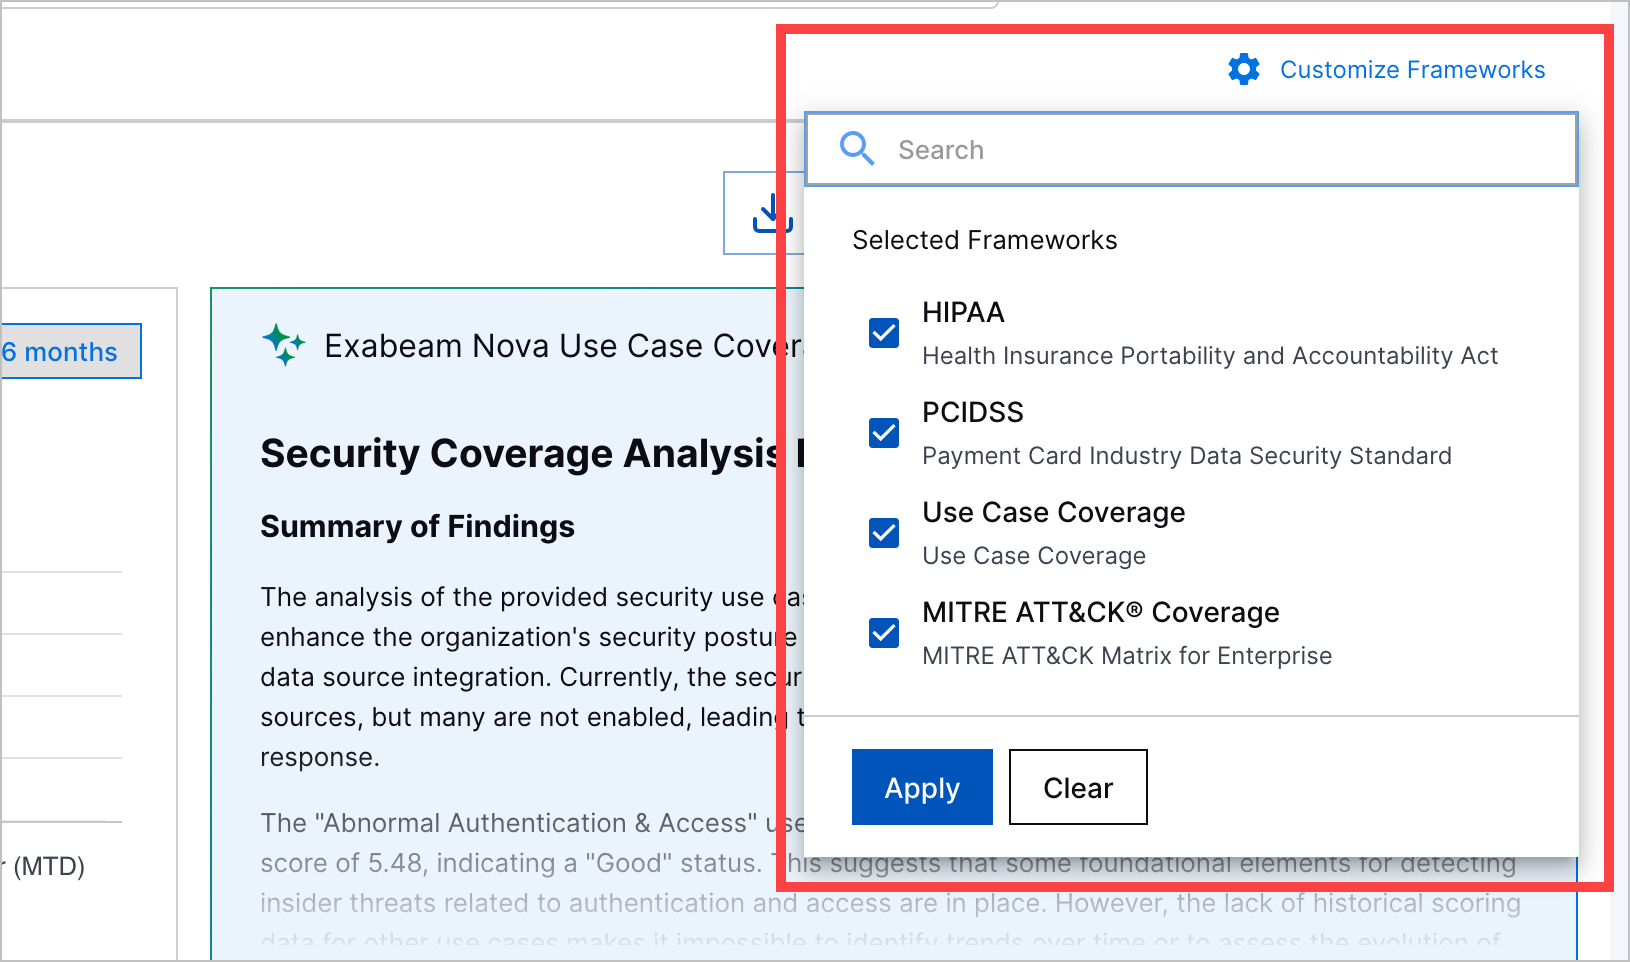 |
Search
Feature | Description | |
|---|---|---|
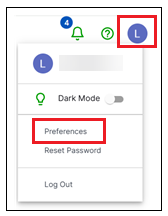
Configurable Rule Display Options | A configurable Detection Rule Display preference has been added to Exabeam settings. With this new setting, you can control the level of rule information displayed on detection events in the Search application. You can set this preference by clicking your account profile circle in the upper-right corner of the Exabeam application, and selecting Preferences.
By default, rules on detection events are displayed with only the rule reason field showing ( For more information about how to configure the rule display options, see Search Application Preferences. | |
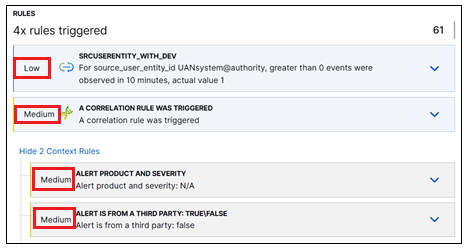
Visible Rule Severity Scores | As part of the enhancements to the way rules are displayed, rule severity scores have been made visible on the Detections tab in the Details panel. In the Rules section of the Detections tab, the rule severity is listed to the left of each rule. This applies to both primary rules that triggered the detection, and context rules that you can opt to expand.
Rule severity is one of the business factors used to calculate risk scores. For information about tuning rule severity scores, see Adjust Analytics Rule Severity in the Threat Detection Management Guide. | |
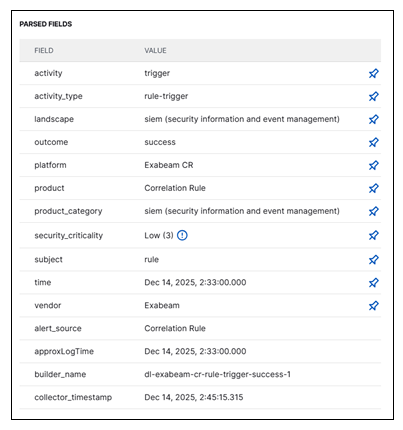
Easy Access to Pinned Fields | In the Event and Detection tabs of the Details panel, you can toggle field visibility in Search results by pinning and unpinning parsed fields. This functionality has been improved so that pinned fields are now persisted to the top of the Parsed Fields list across all of the tabs in the Details pane. The unpinned fields are listed alphabetically below the pinned fields.
| |
Table View Efficiency Enhancements | The Table view of Search results has been significantly enhanced, both in form and function. The enhancement features listed below help streamline the process of working with results in the Table view:
For more information about working with the Table view, see Table View of Search Results in the Search Guide. |
Site Collectors 2.17
Feature | Description |
|---|---|
Direct Access Agent (DAA) Windows Collector | The Direct Access Agent (DAA) Windows Collector is now available as part of the Early Access program to collect logs natively from your Windows server and push the logs to New-Scale Security Operations Platform. The DAA Windows Collector natively collects and filters Windows Event Logs using defined event IDs and XPath queries. It compresses the data into JSON for efficient upload to Google Cloud Storage and publishes real-time health metrics through GCP Pub/Sub. |
Threat Center
Feature | Description | |||||
|---|---|---|---|---|---|---|
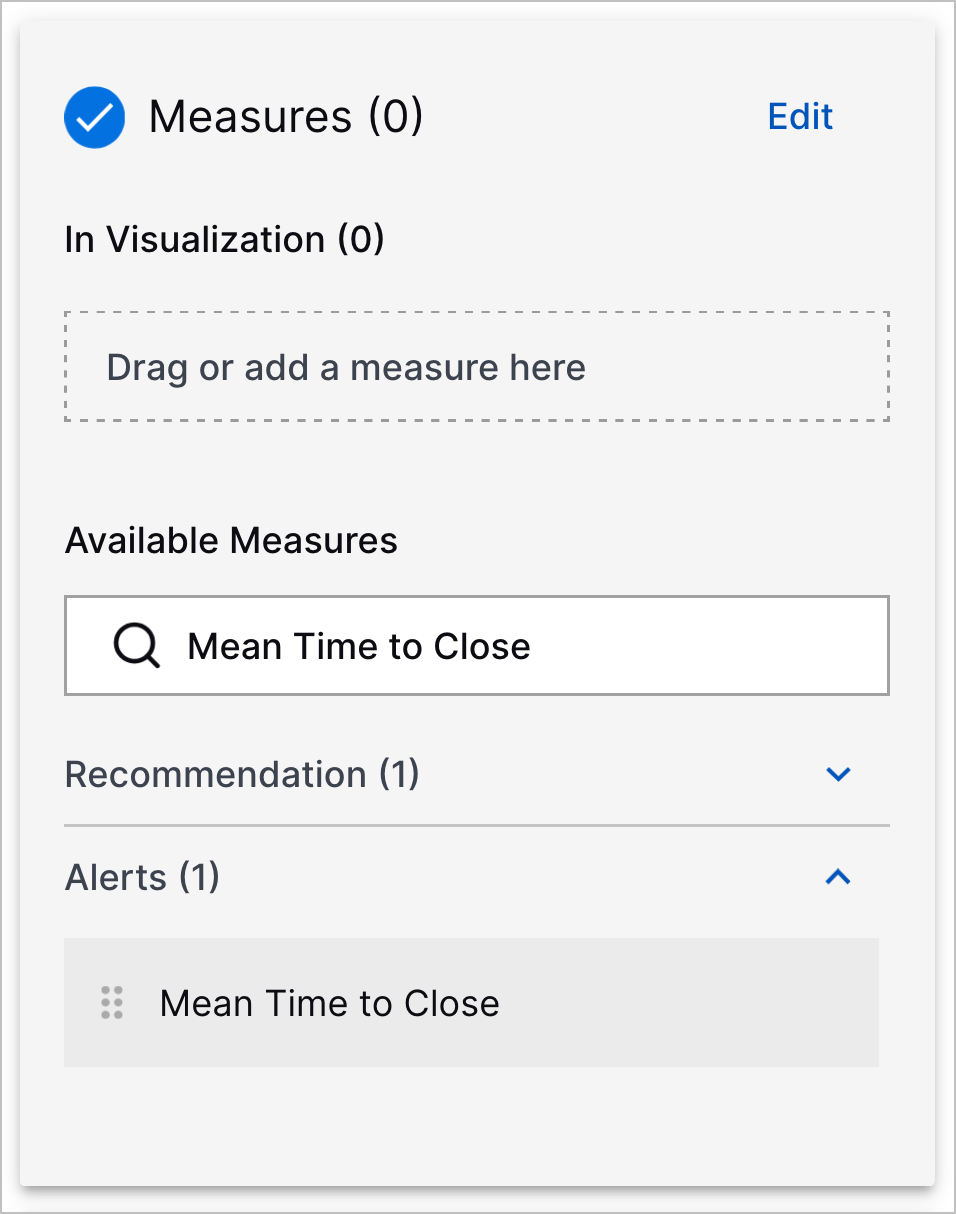
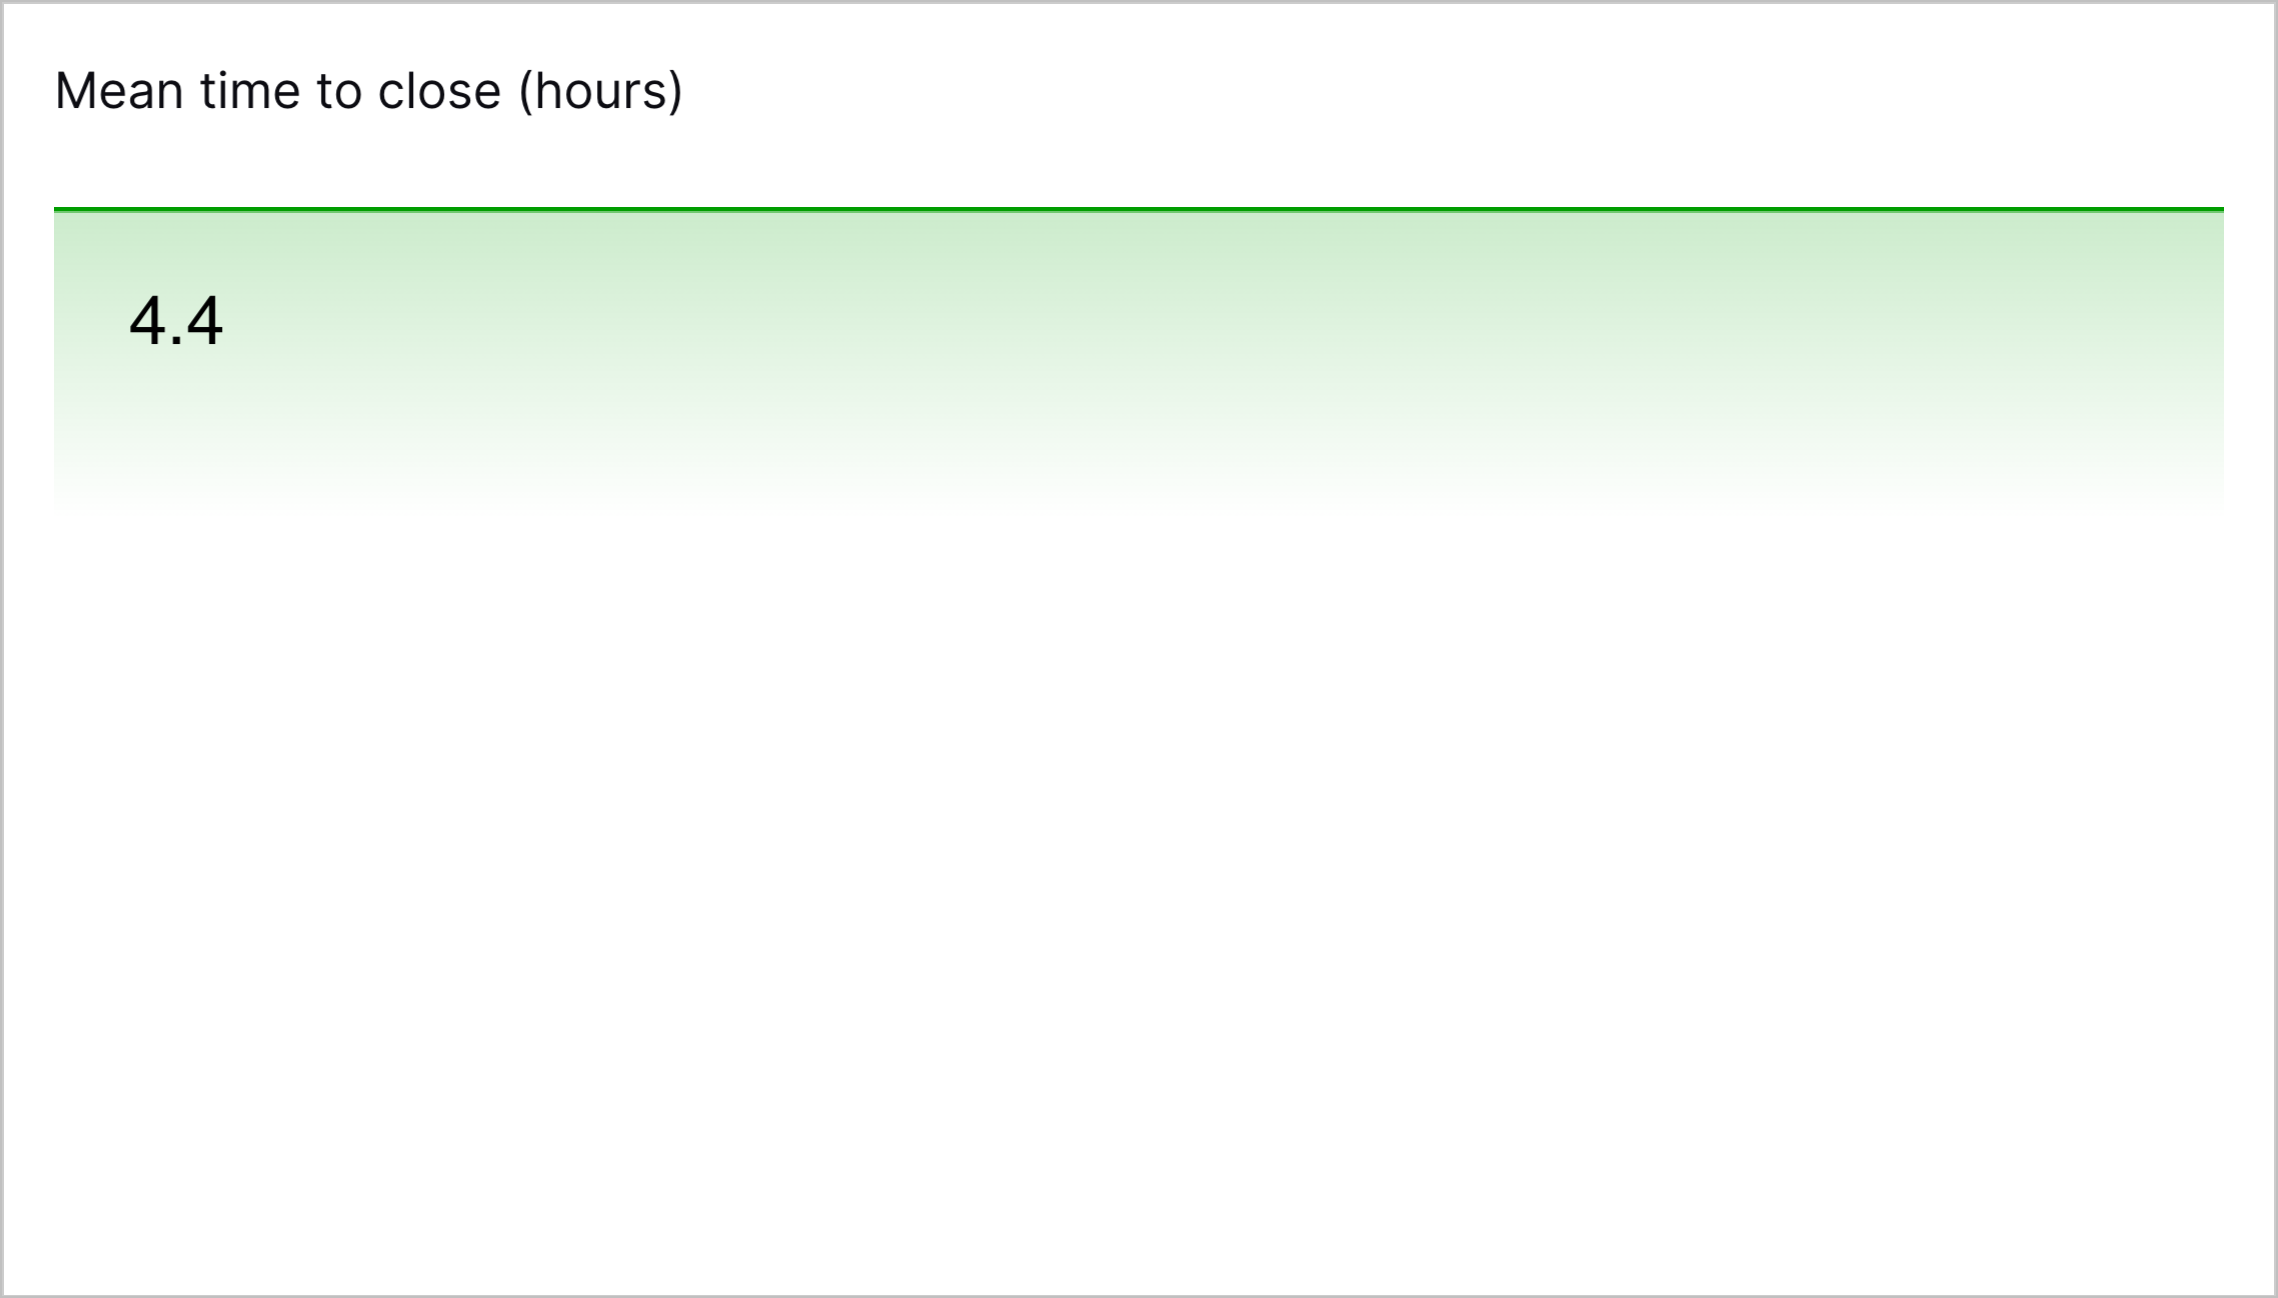
Dashboards Threat Center Data Model Mean Time to Close Measure | To measure how effectively your team closes cases, you can now use the new Mean Time to Close measure to create Dashboard visualizations with the Threat Center data model.
The Mean Time to Close measure is the average hours taken to close cases, from when the alert was created to when the status of the associated case was changed to Closed. | |||||
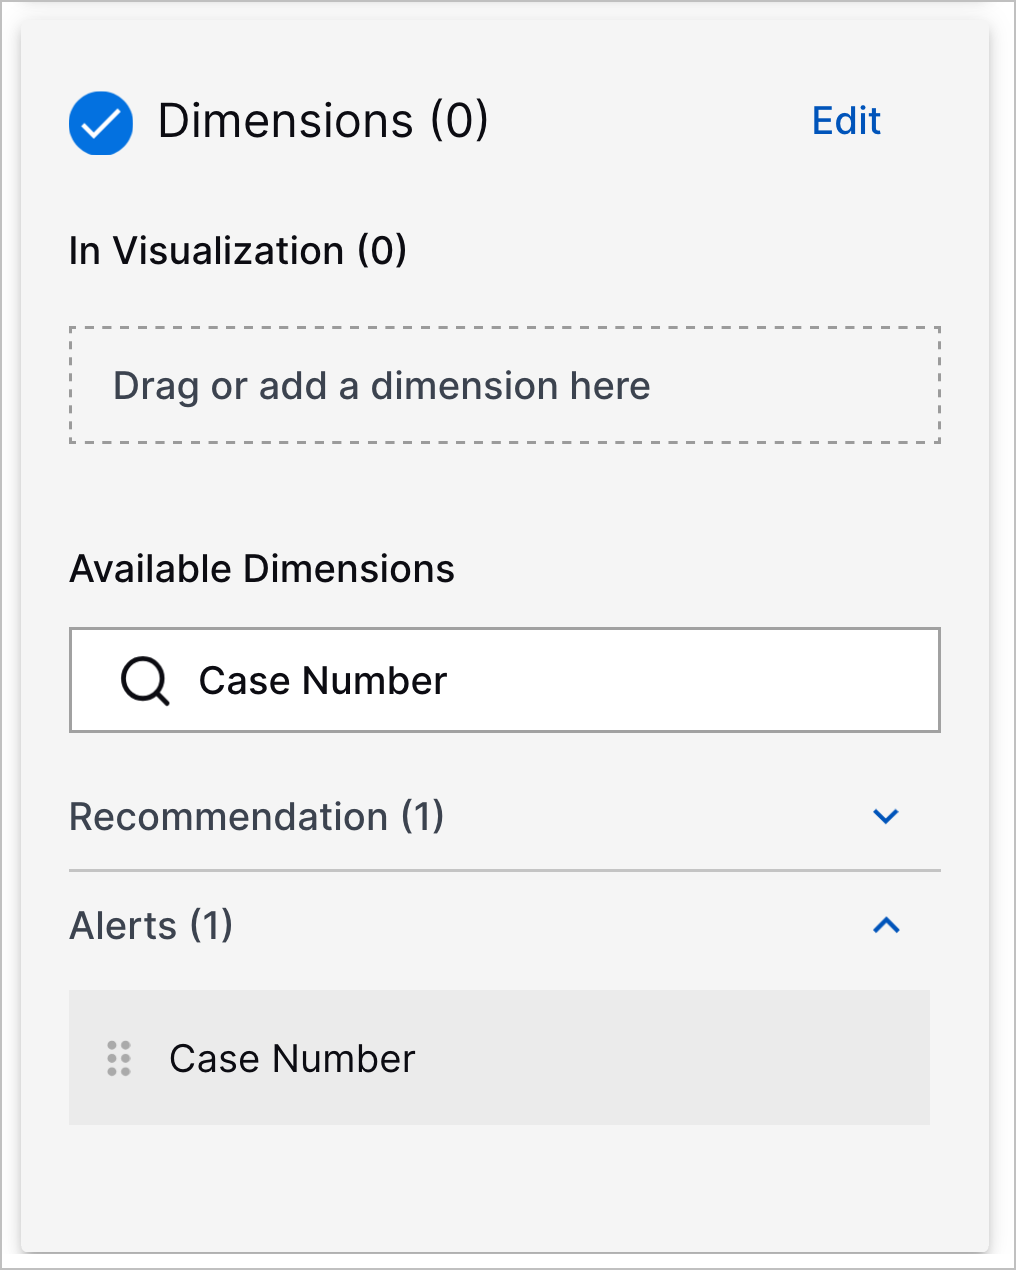
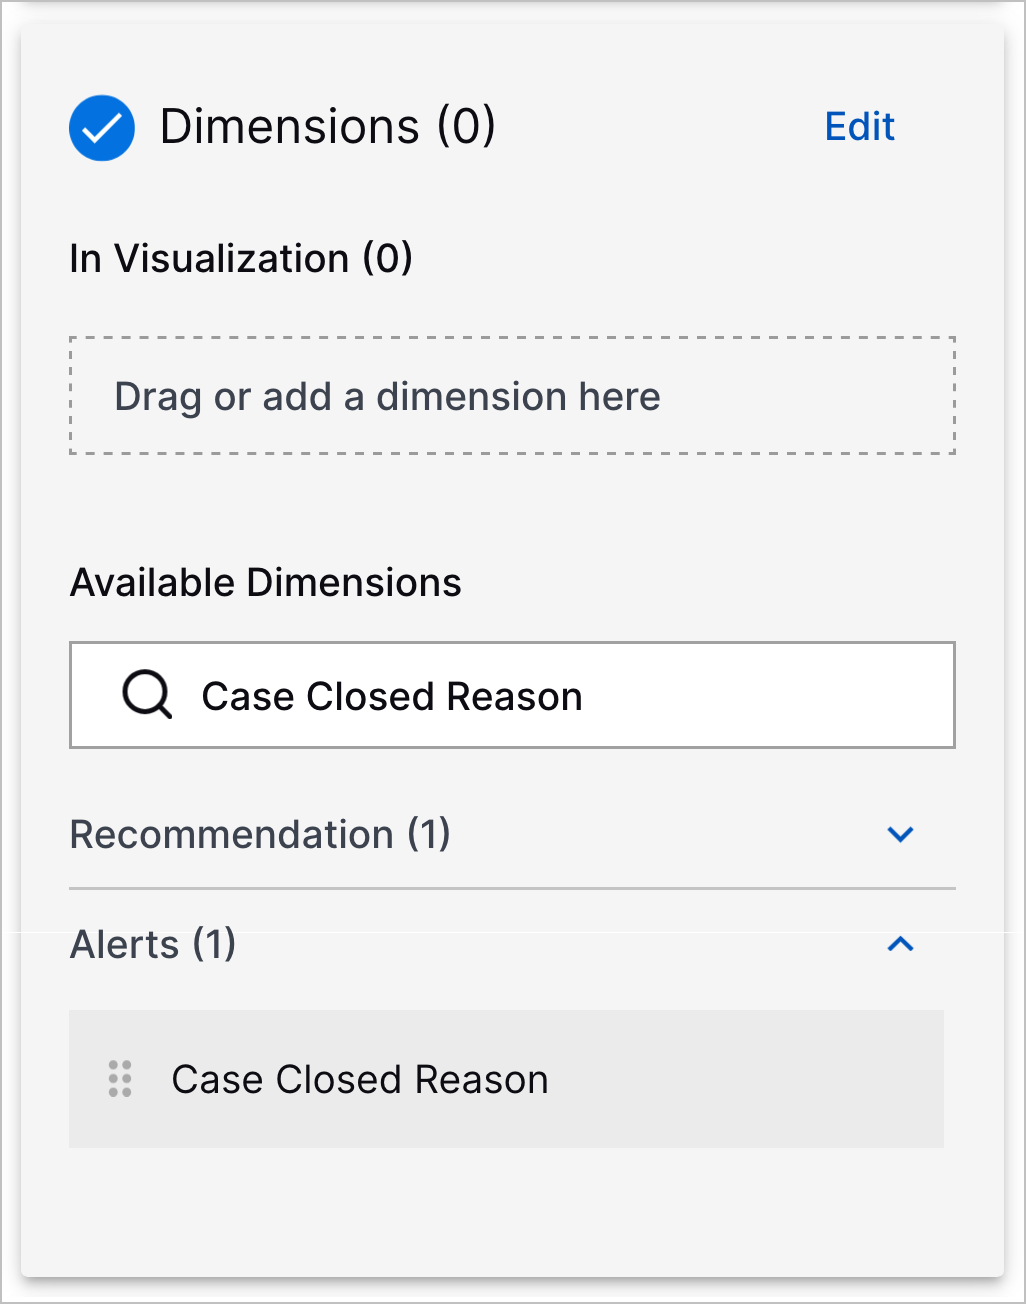
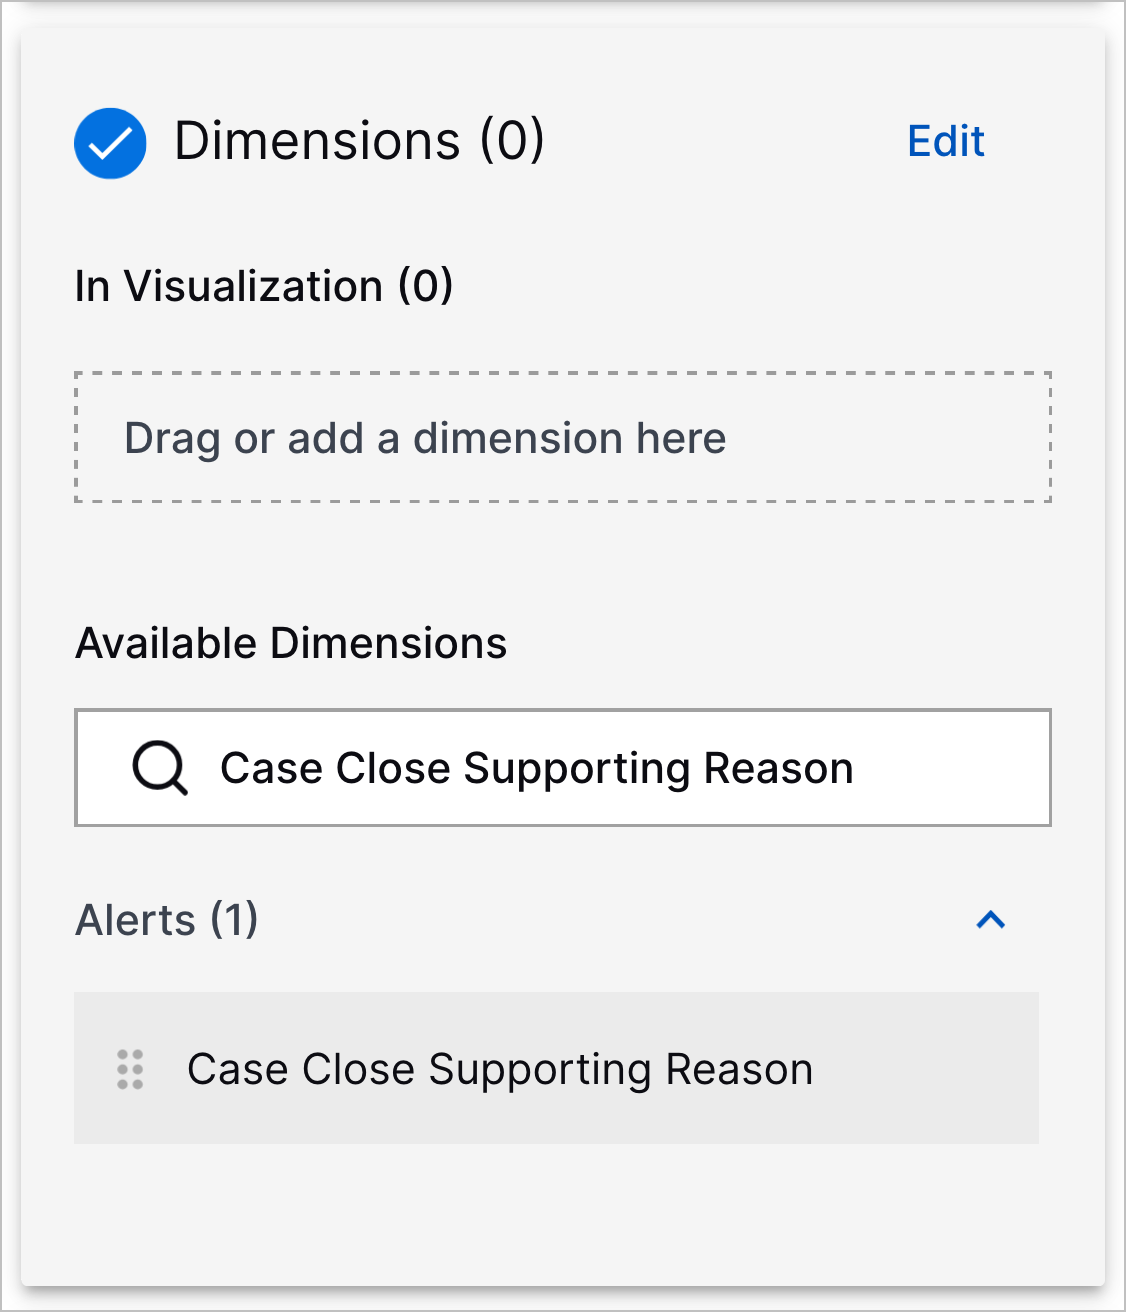
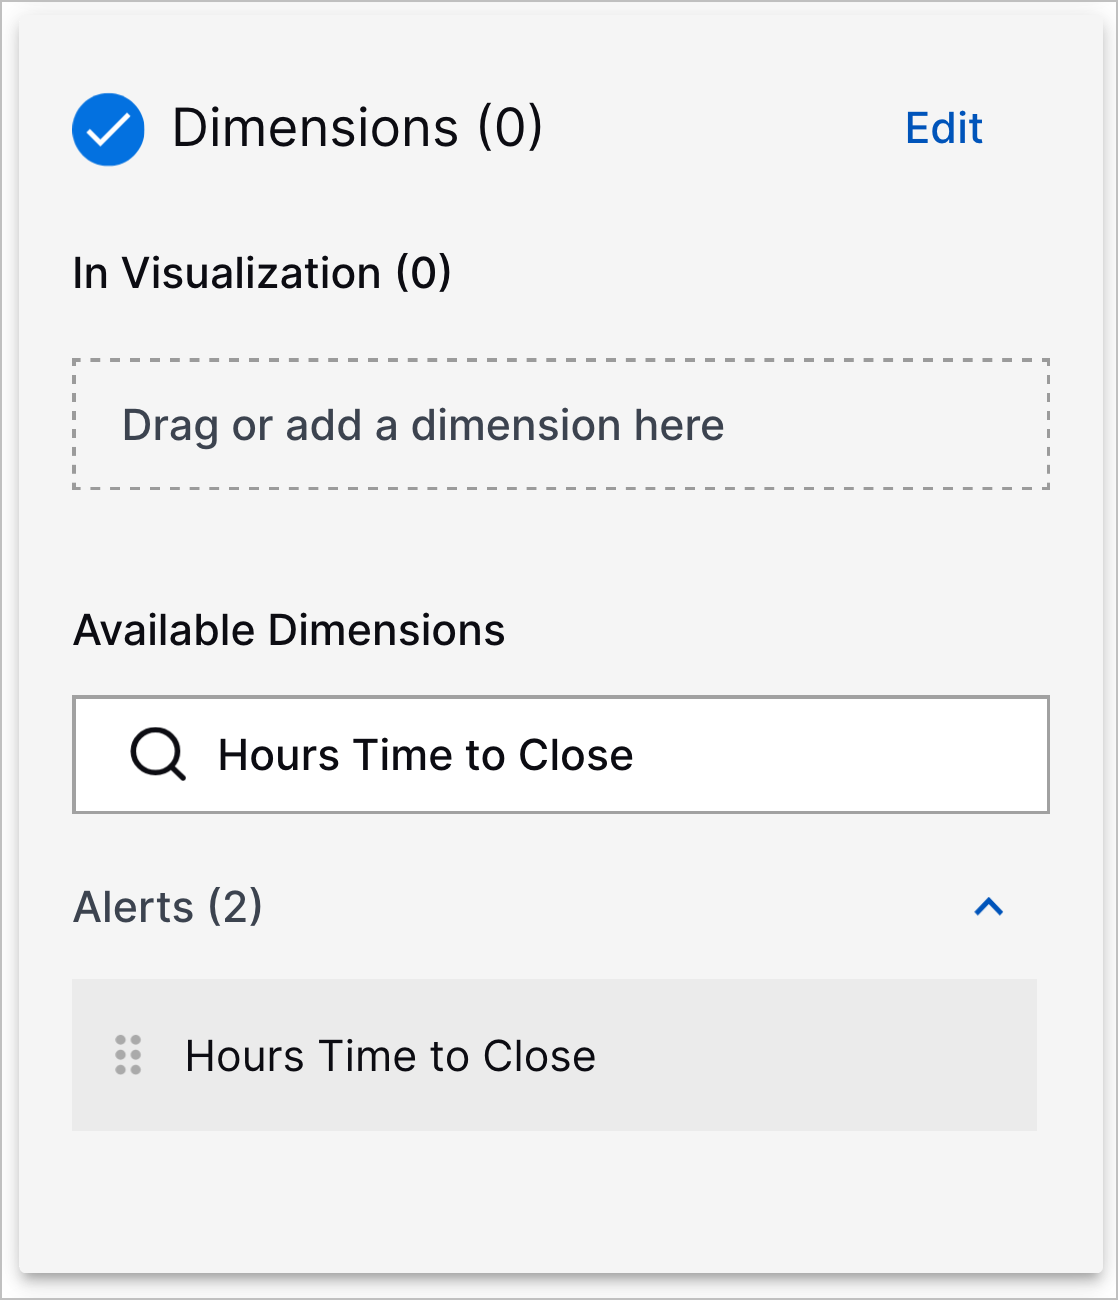
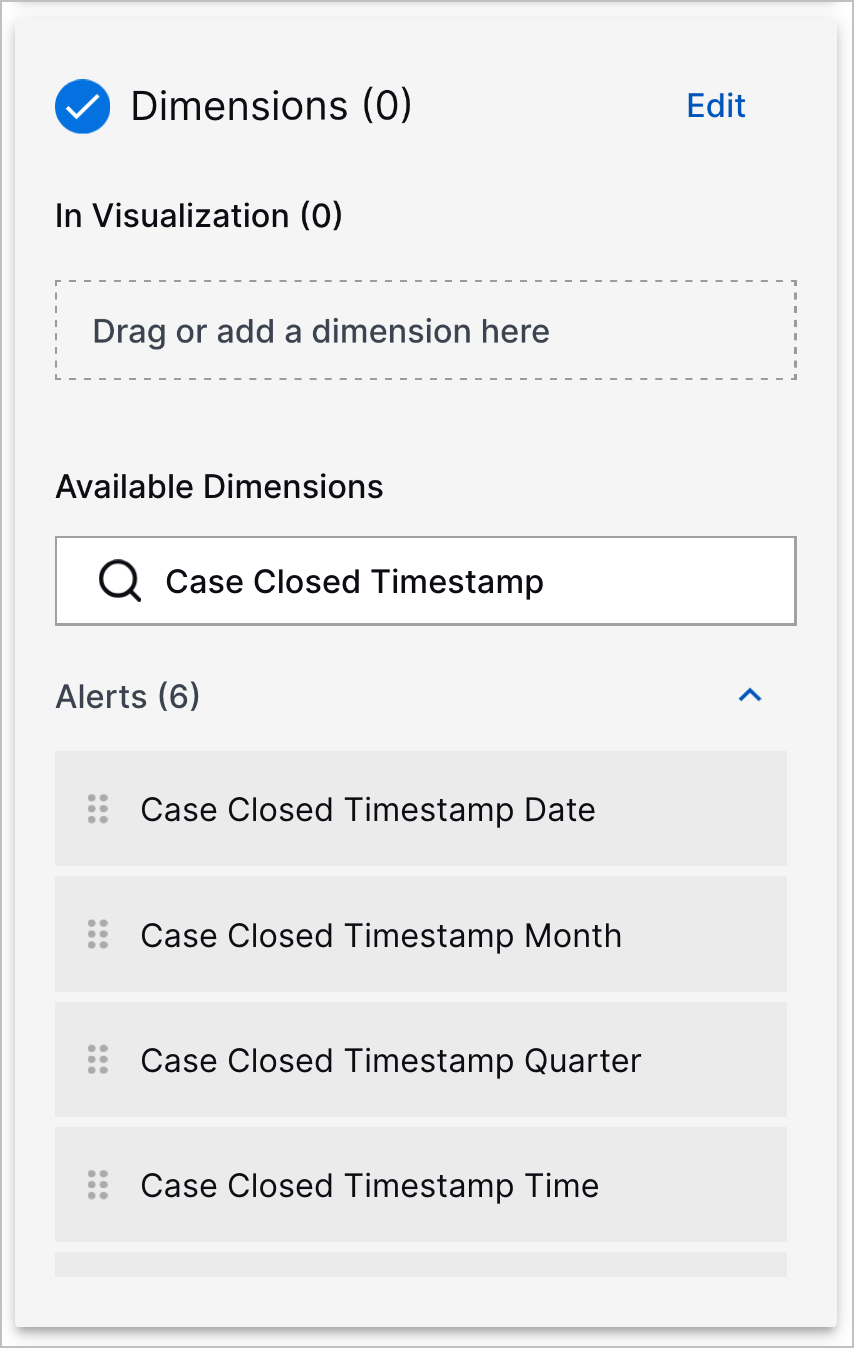
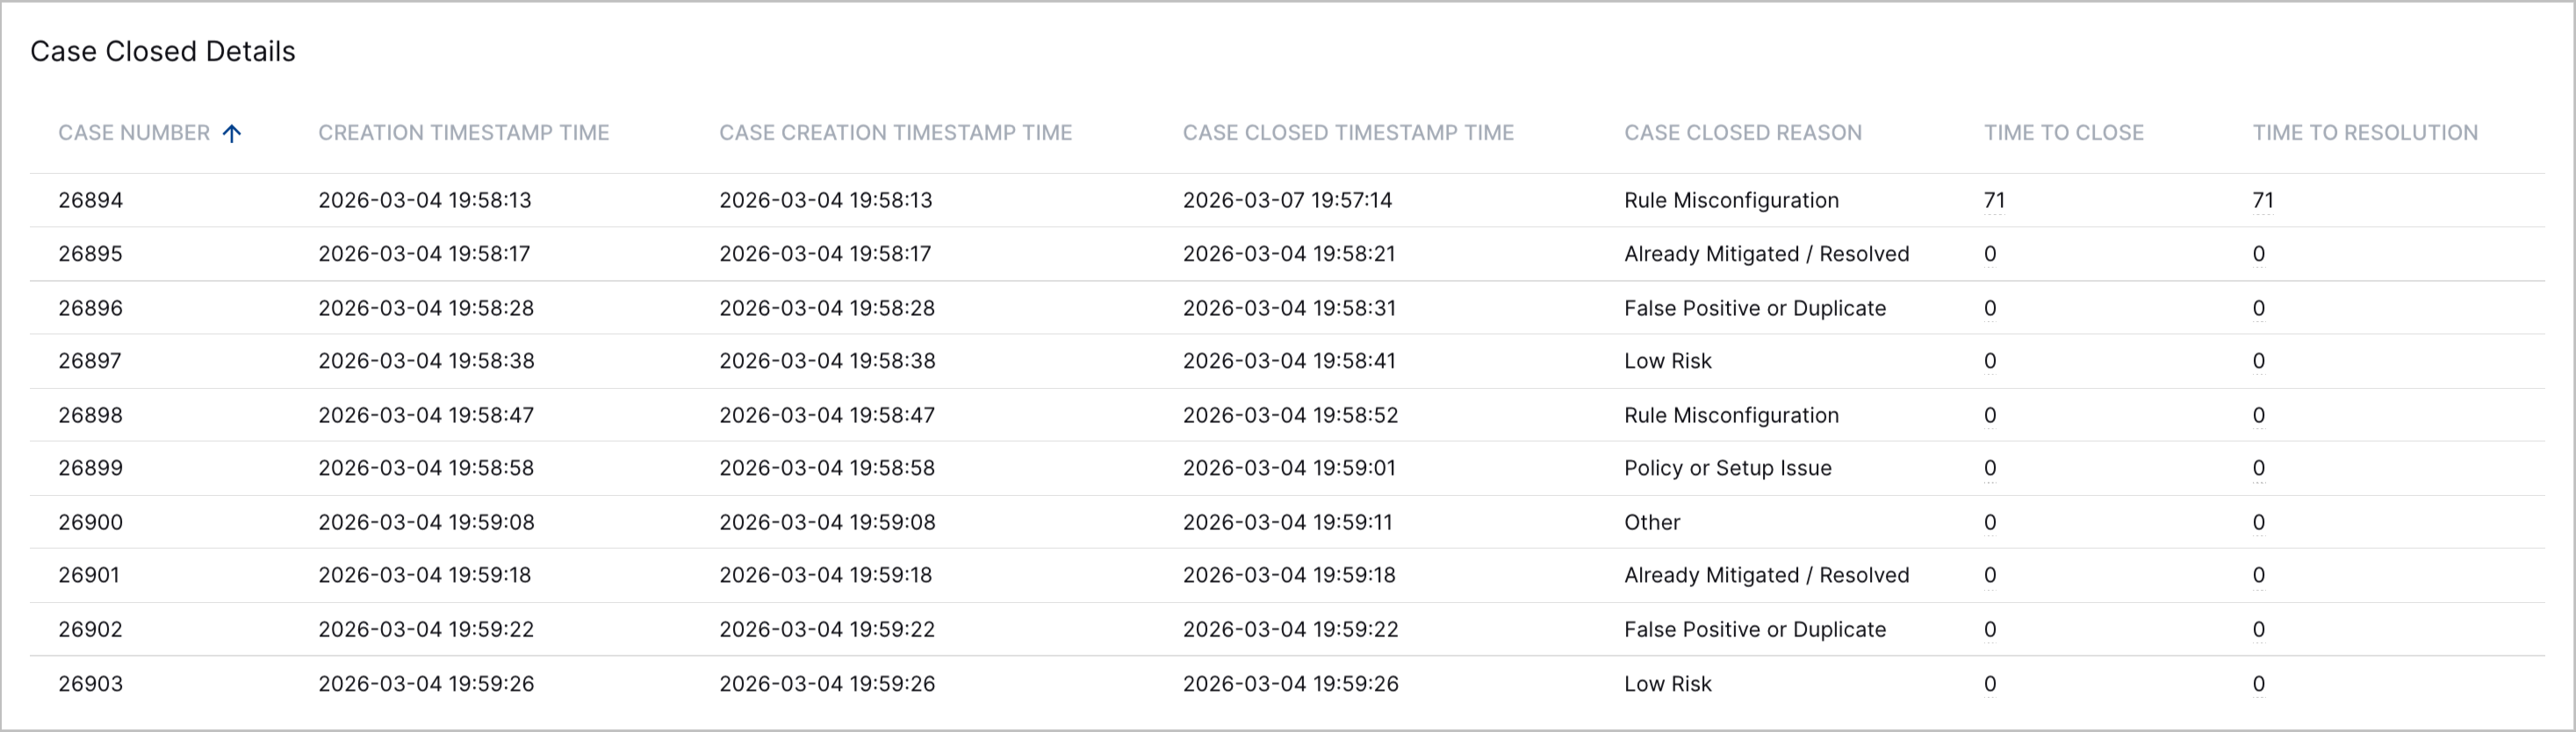
New and Updated Dashboards Threat Center Data Model Dimensions | To monitor more metrics on cases, you can now use new dimensions to create Dashboard visualizations with the Threat Center data model. New dimensions include:
The dimensions whose names start with Closed Timestamp have been renamed and now start with Case Closed Timestamp.
| |||||
Pre-Built Threat Center Overview Dashboard Filters | To narrow the range of data you see in the pre-built Threat Center Overview dashboard, you can now filter the dashboard by:
 | |||||
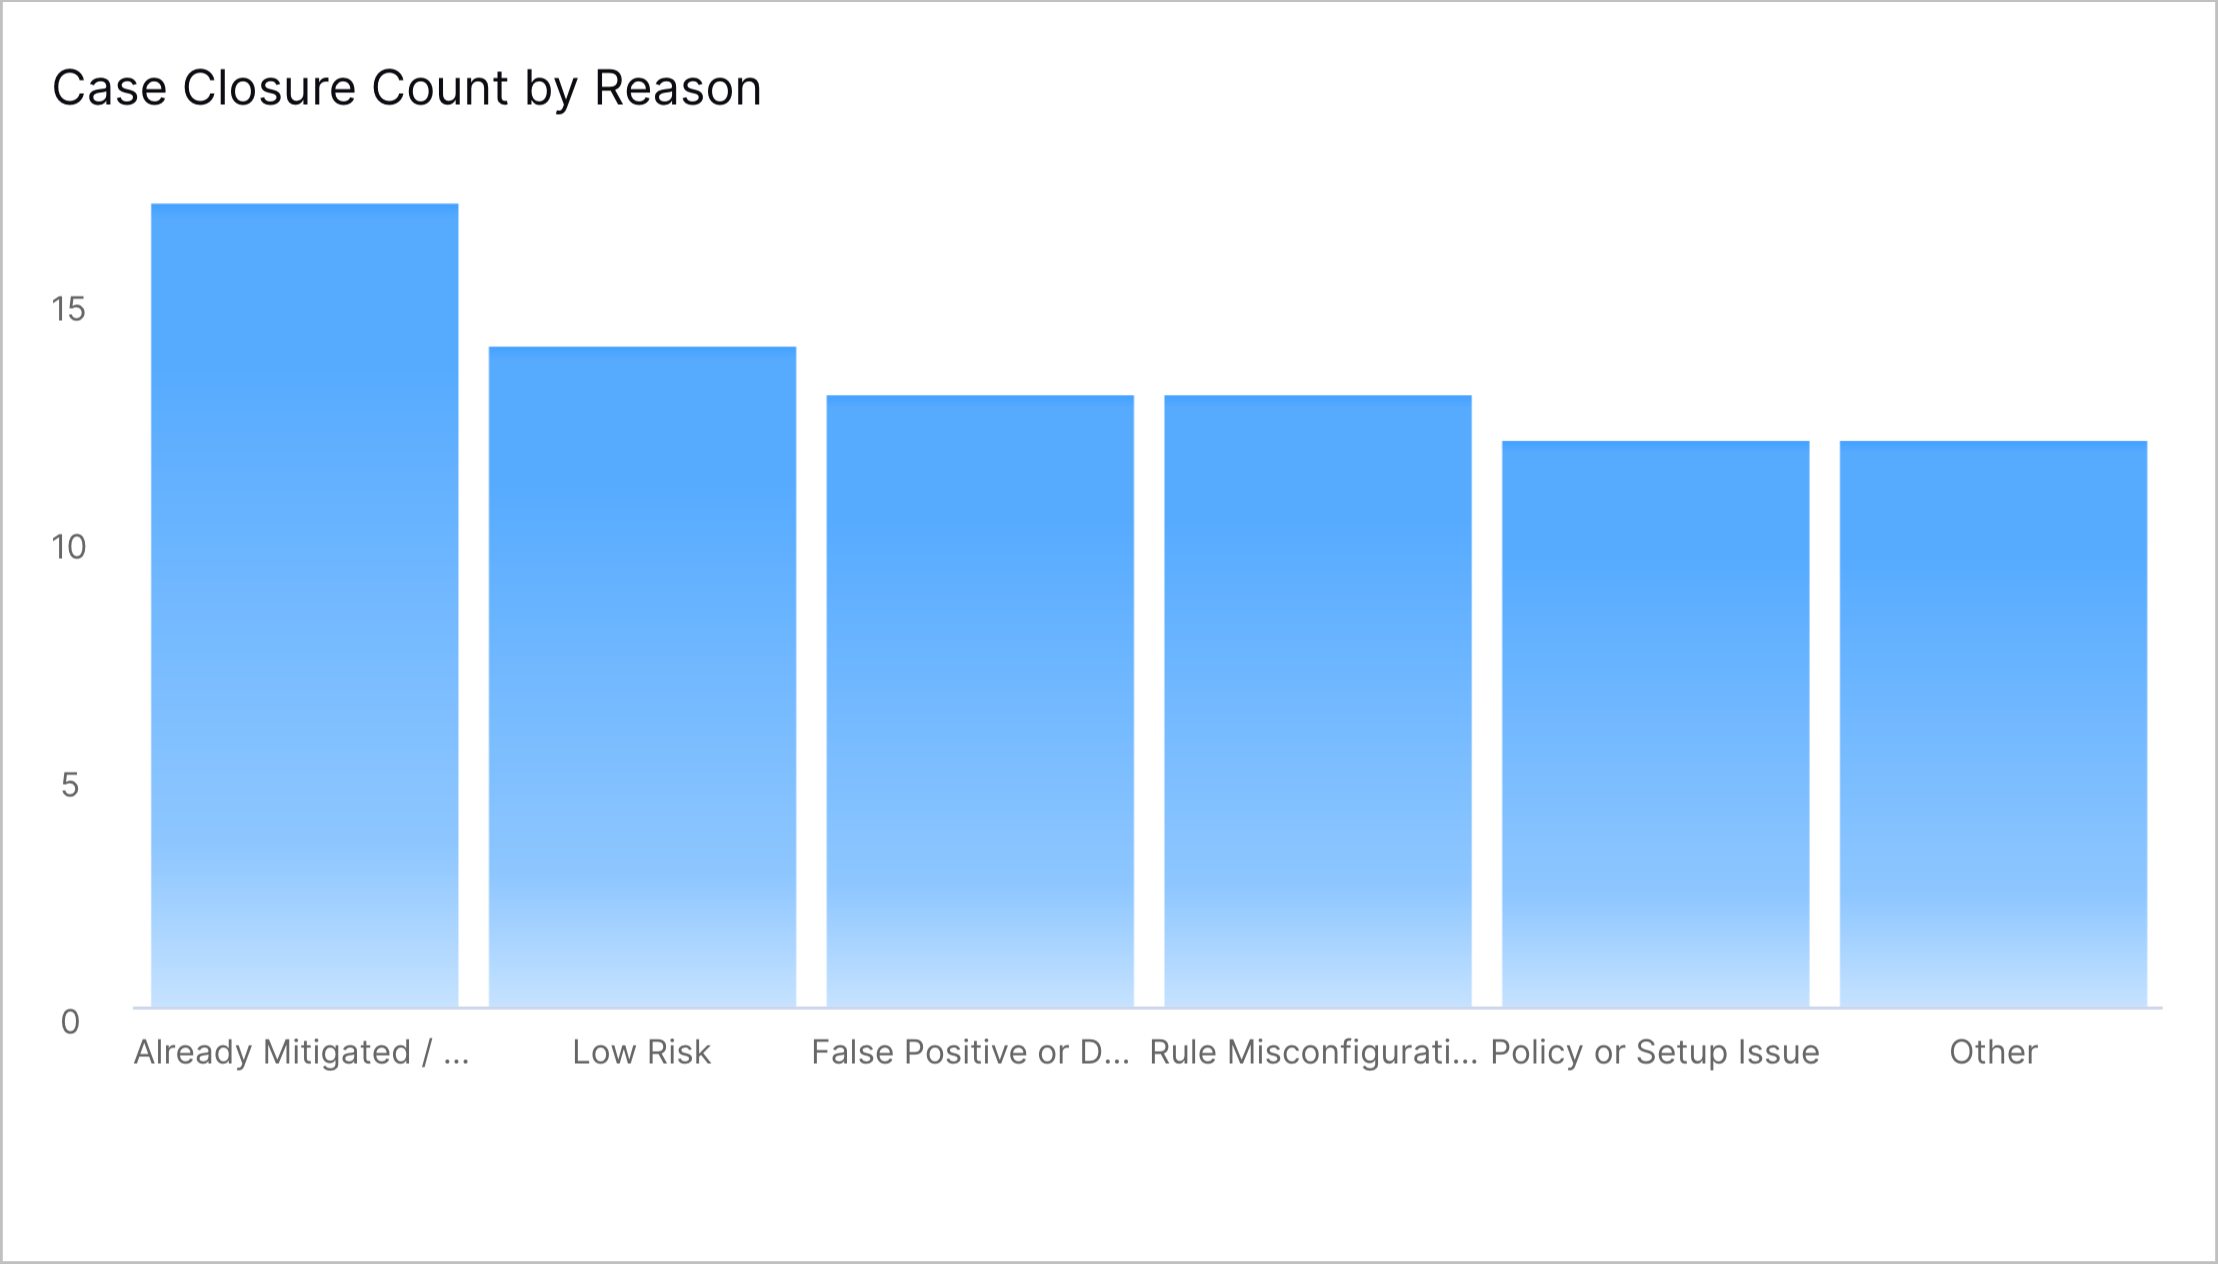
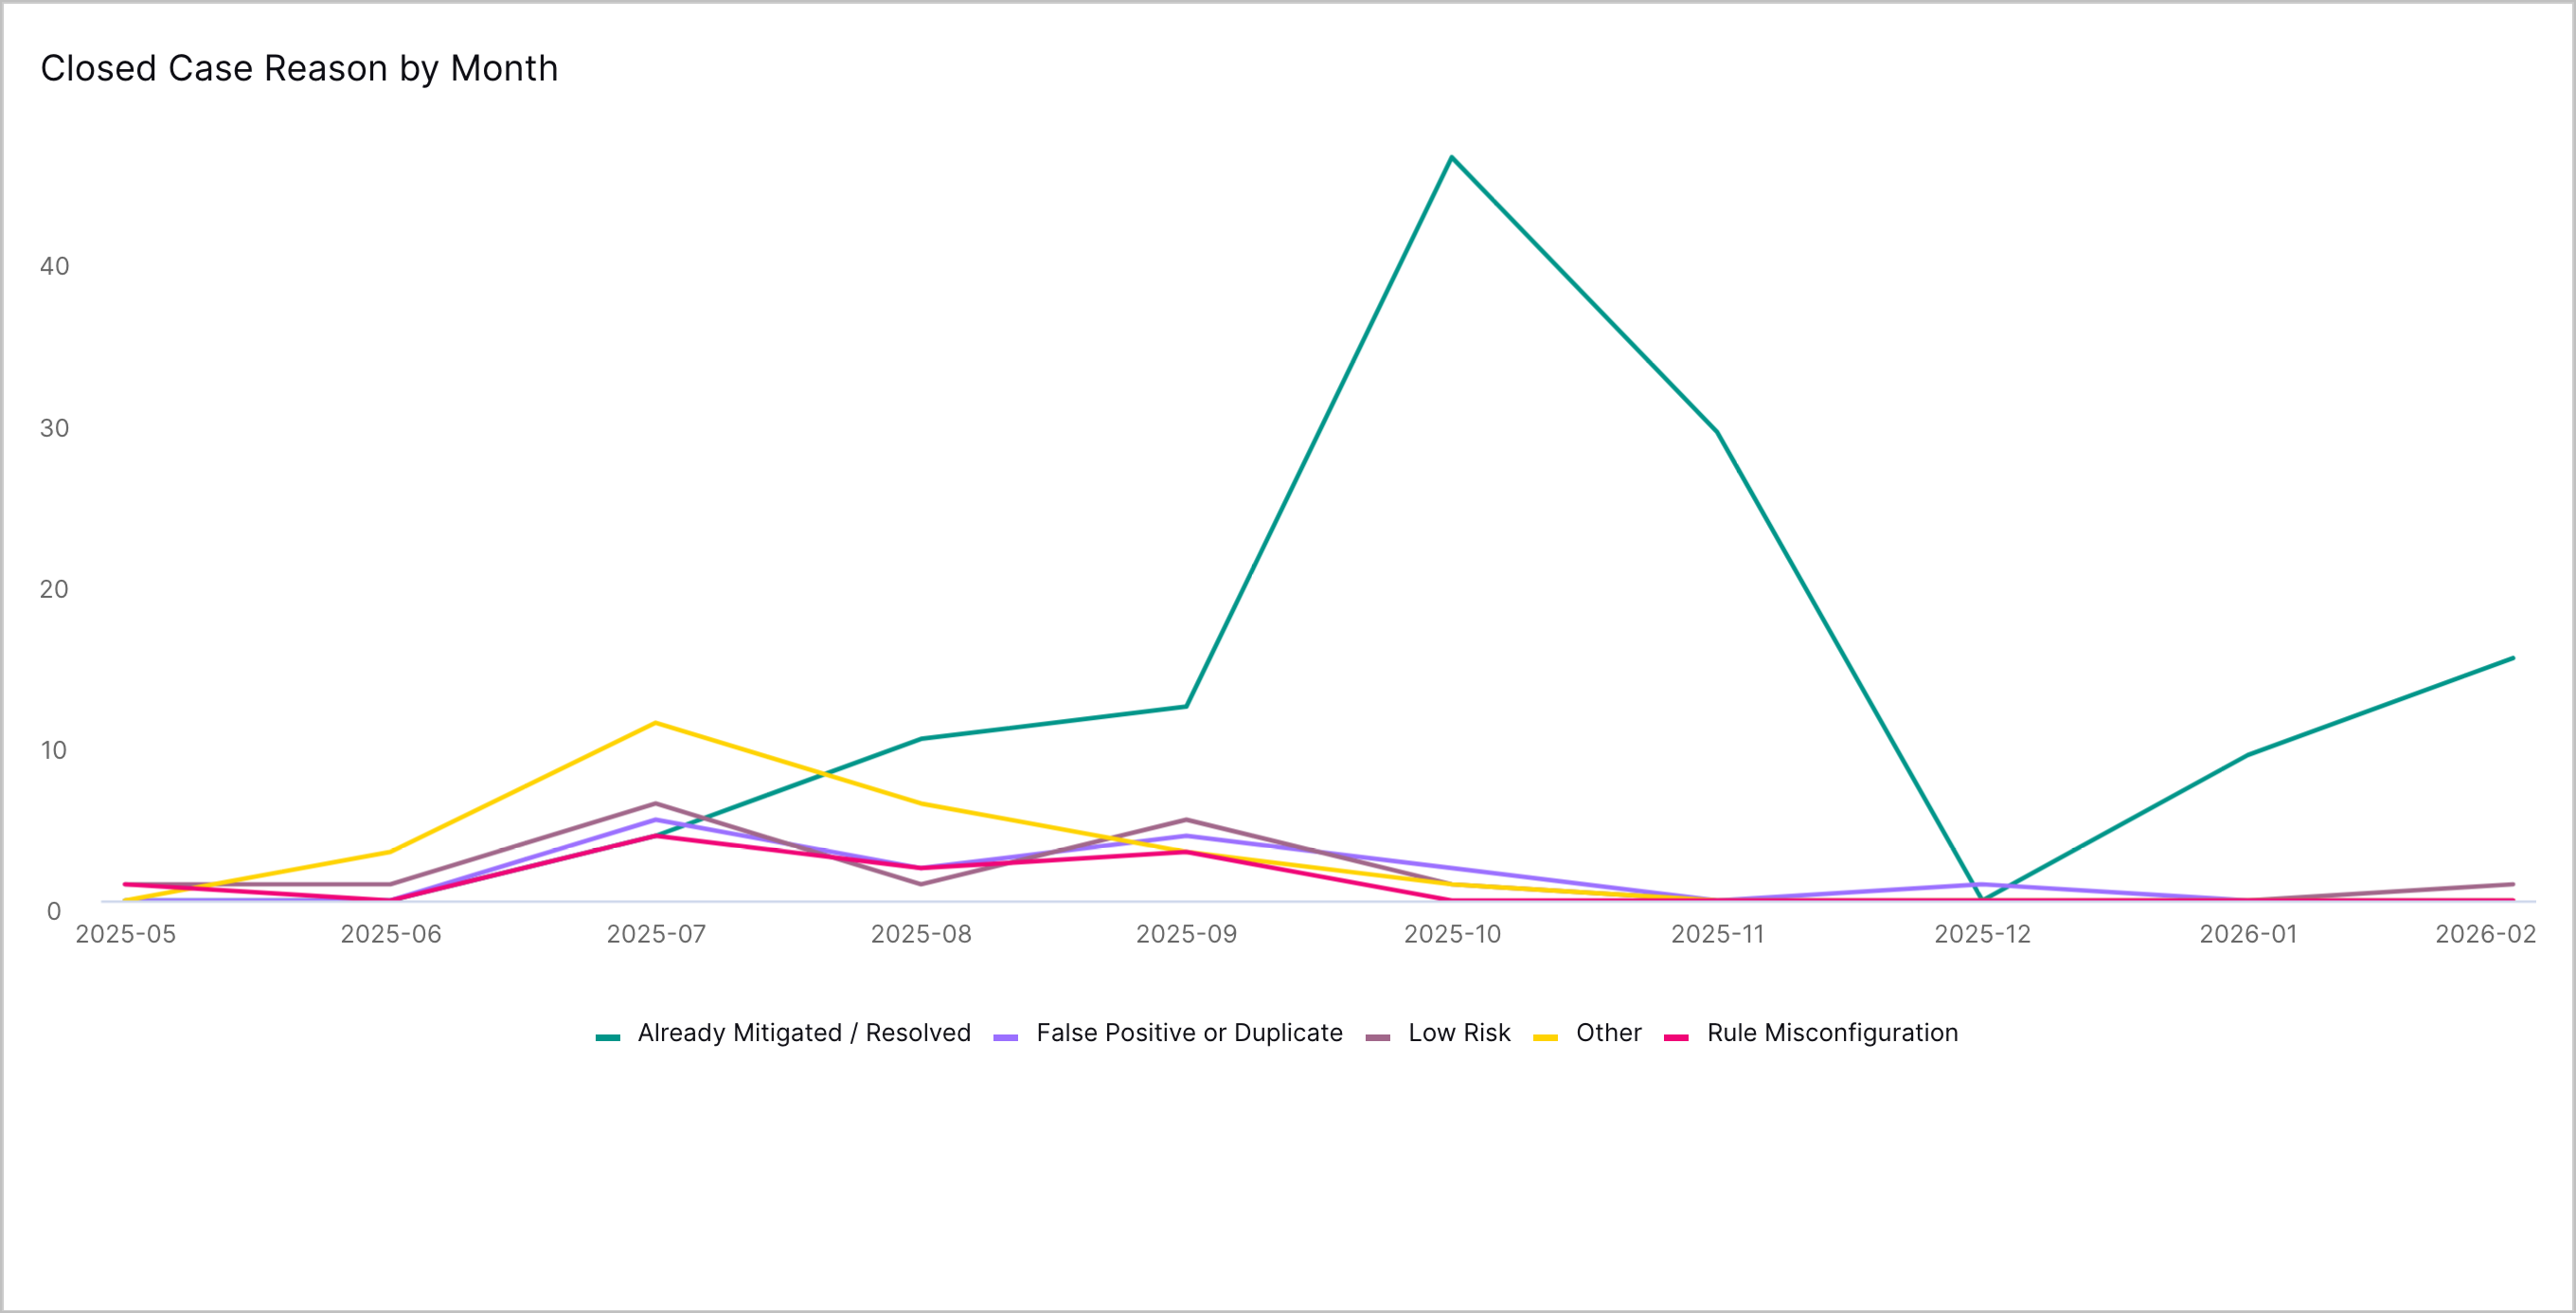
New Visualizations in the Pre-Built Threat Center Overview Dashboard | In the pre-built Threat Center Overview dashboard, you can now analyze and identify trends in case closures with four new visualizations:
| |||||
Case Bulk Edit | You can now quickly edit multiple cases at once. On the Cases tab, you can now select up to 50 cases to update. 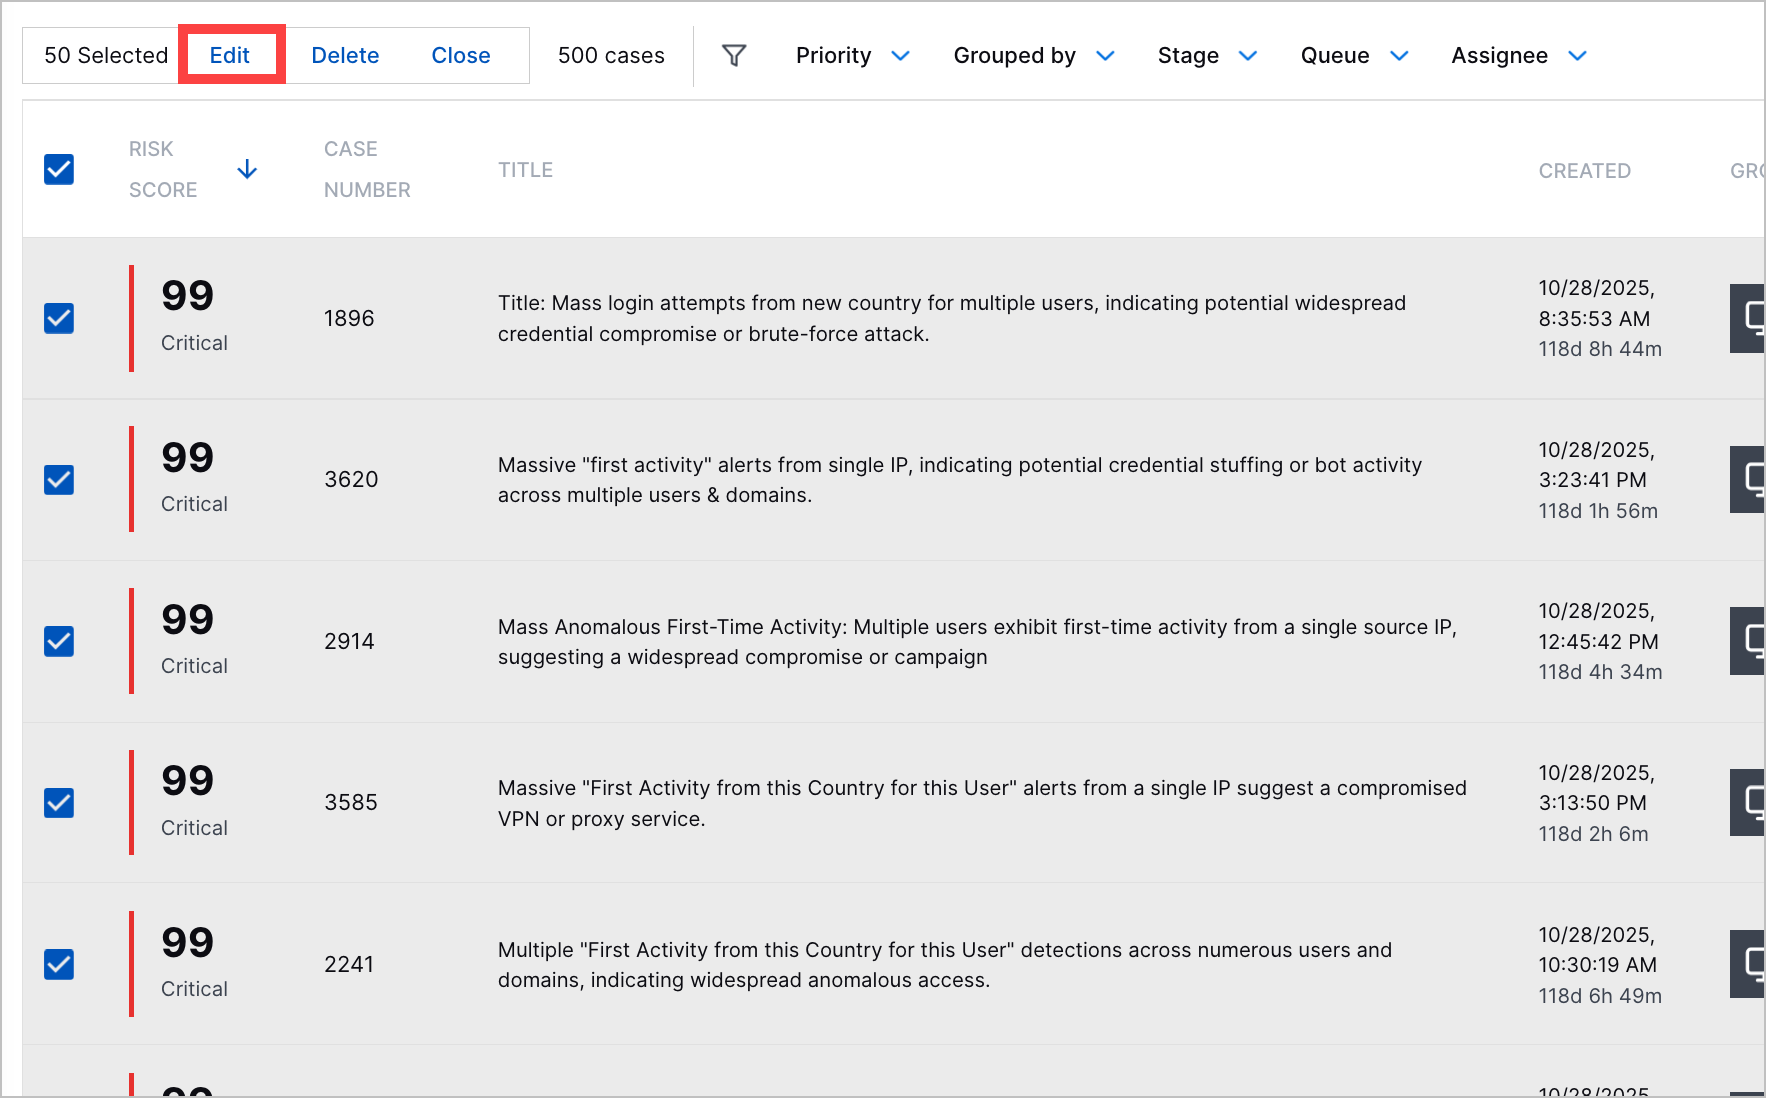 You can update the following case attributes:
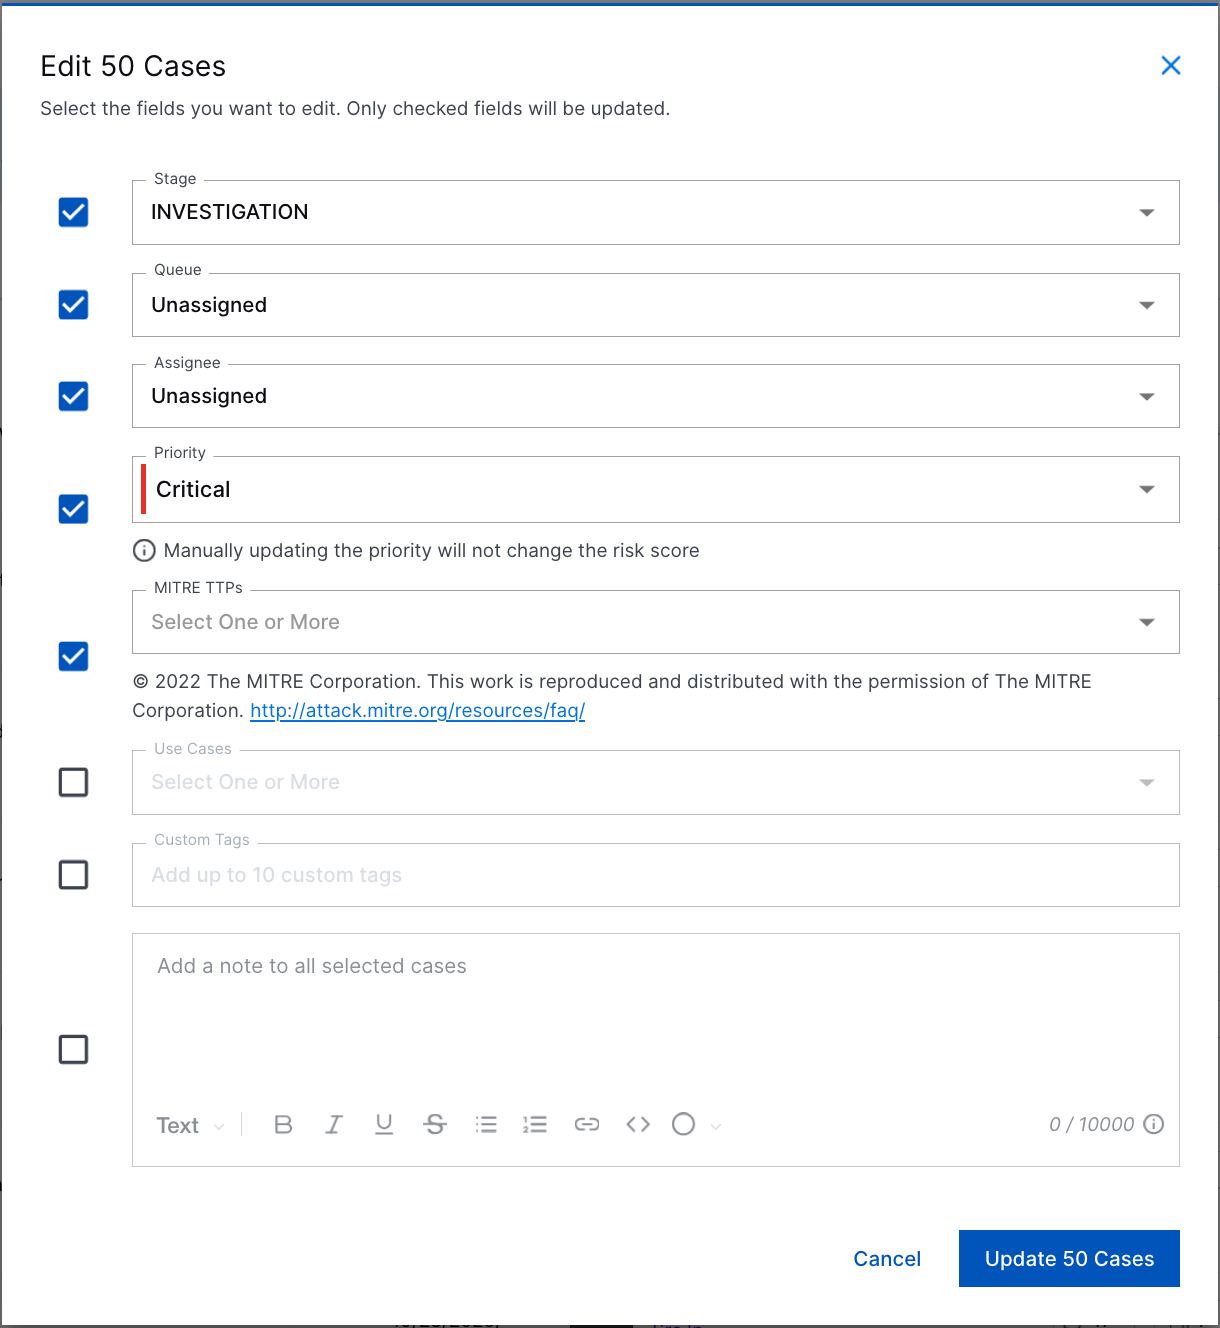 The updated stage, queue, assignee, and priority replace the existing value for those attributes. MITRE TTPs, use cases, tags, and notes are appended to the cases without replacing existing values. | |||||
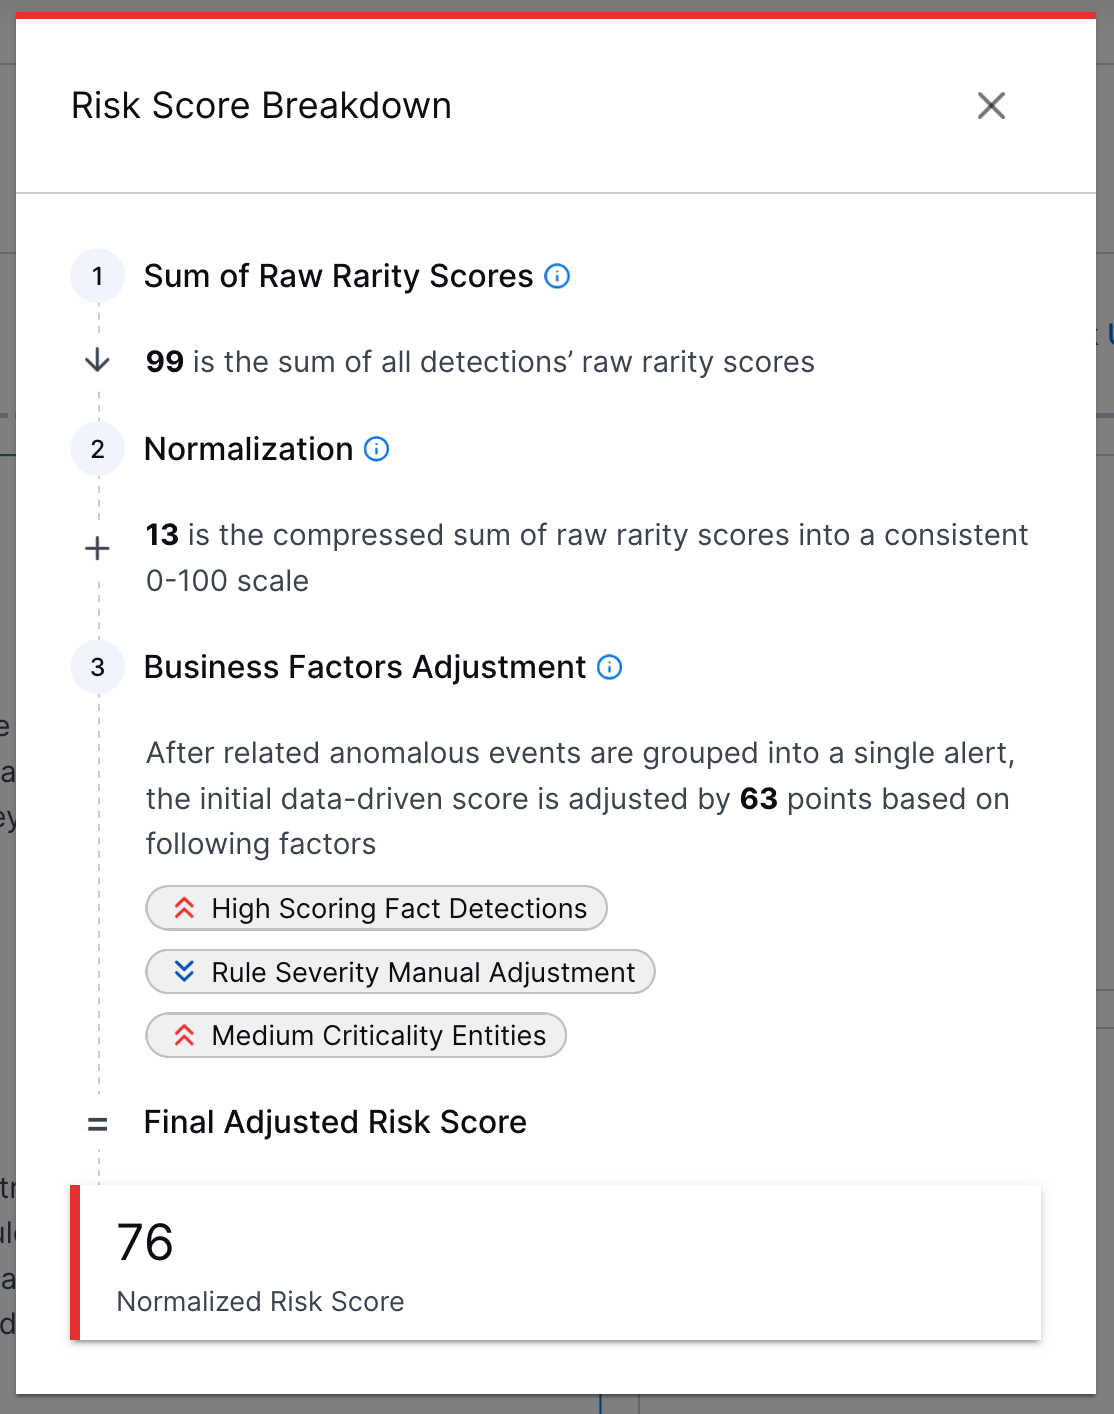
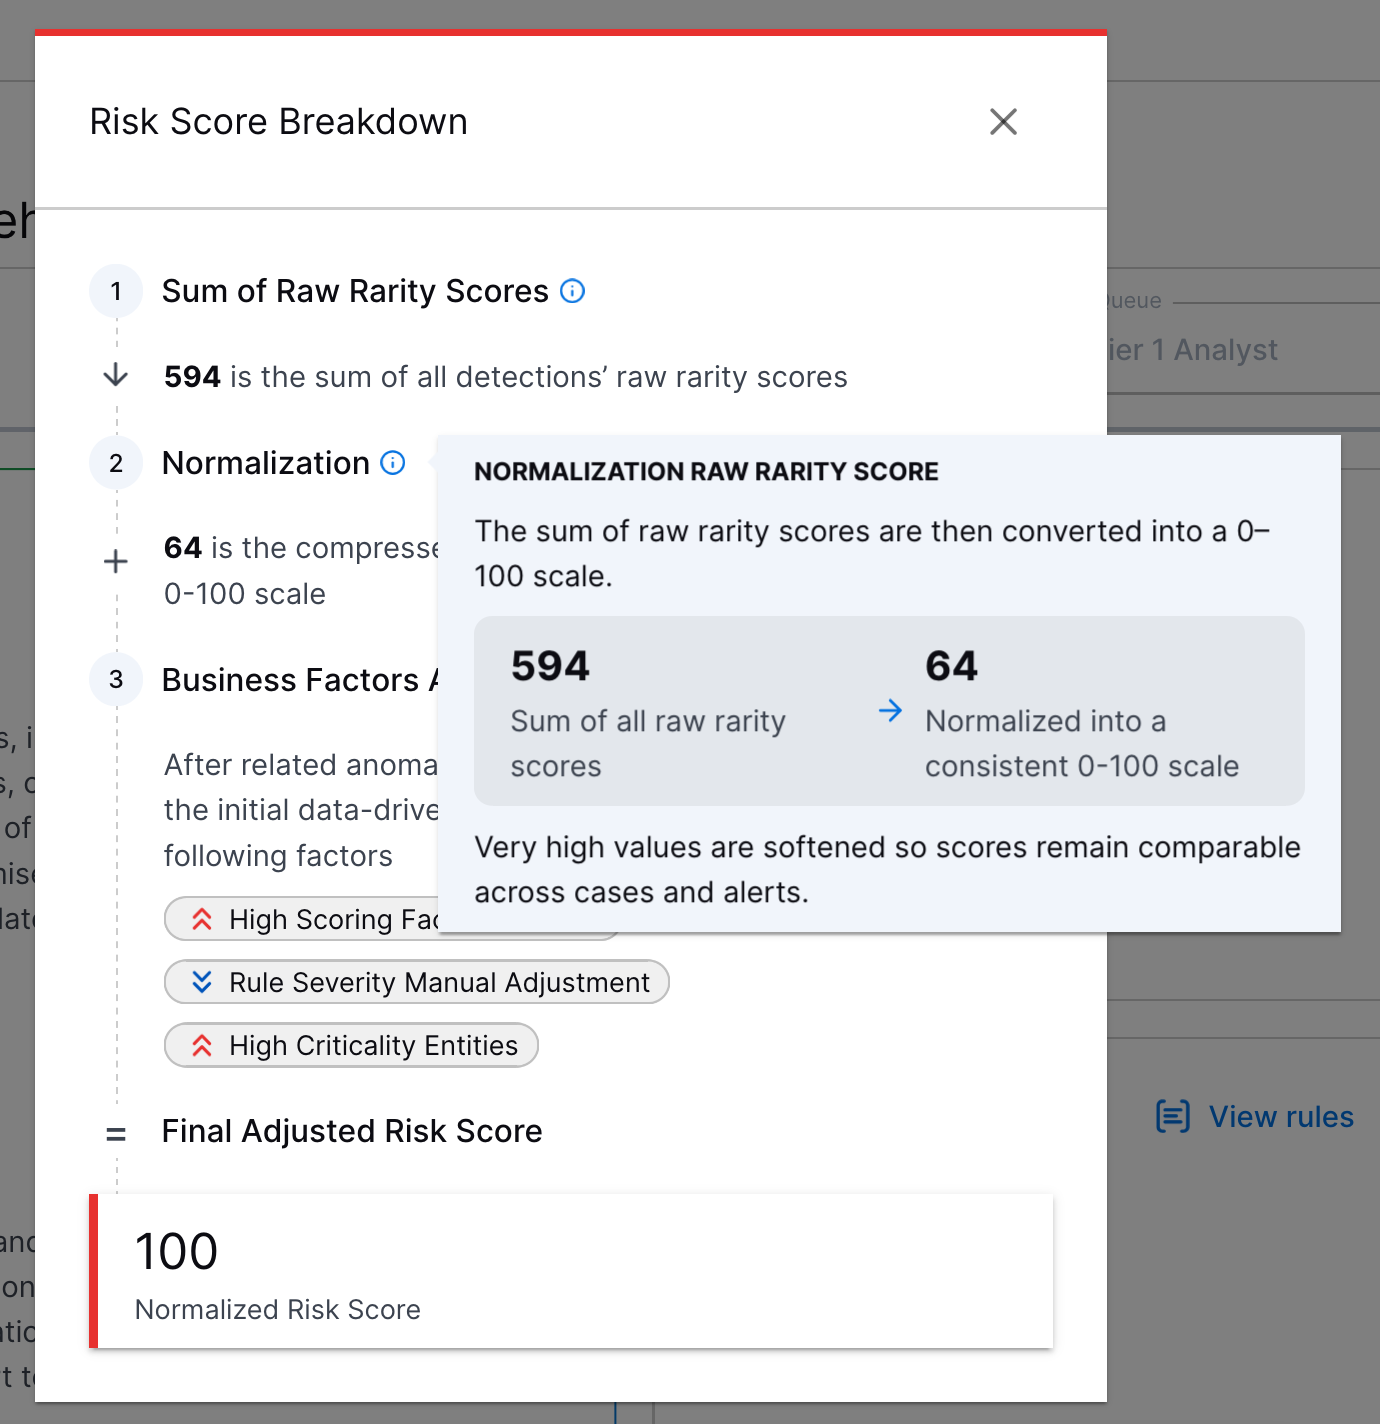
Risk Score Explanation Enhancement | To better understand how a risk score for an alert or case was calculated, under How was this calculated?, you can now view a step-by-step explanation that more clearly explains how the risk score was calculated.
For more information about each step, hover over
This enhancement is available only for New-Scale Security Operations portfolio licenses. | |||||
Manual Playbook Execution for Manually Created Cases | To respond consistently to all cases, you can now manually run Automation Management playbooks on manually created Threat Center cases. | |||||
Automation History for Manually Created Cases | You can now view a history of all Automation Management playbooks run on manually created Threat Center cases under the case Automation tab. |

Threat Detection Management
Feature | Description |
|---|---|
Applicable Events AND/OR Nested Logic in the Analytics Rule Builder | To more precisely define which events an analytics rule evaluates, you can now use complex You can now select whether an event must match all conditions with 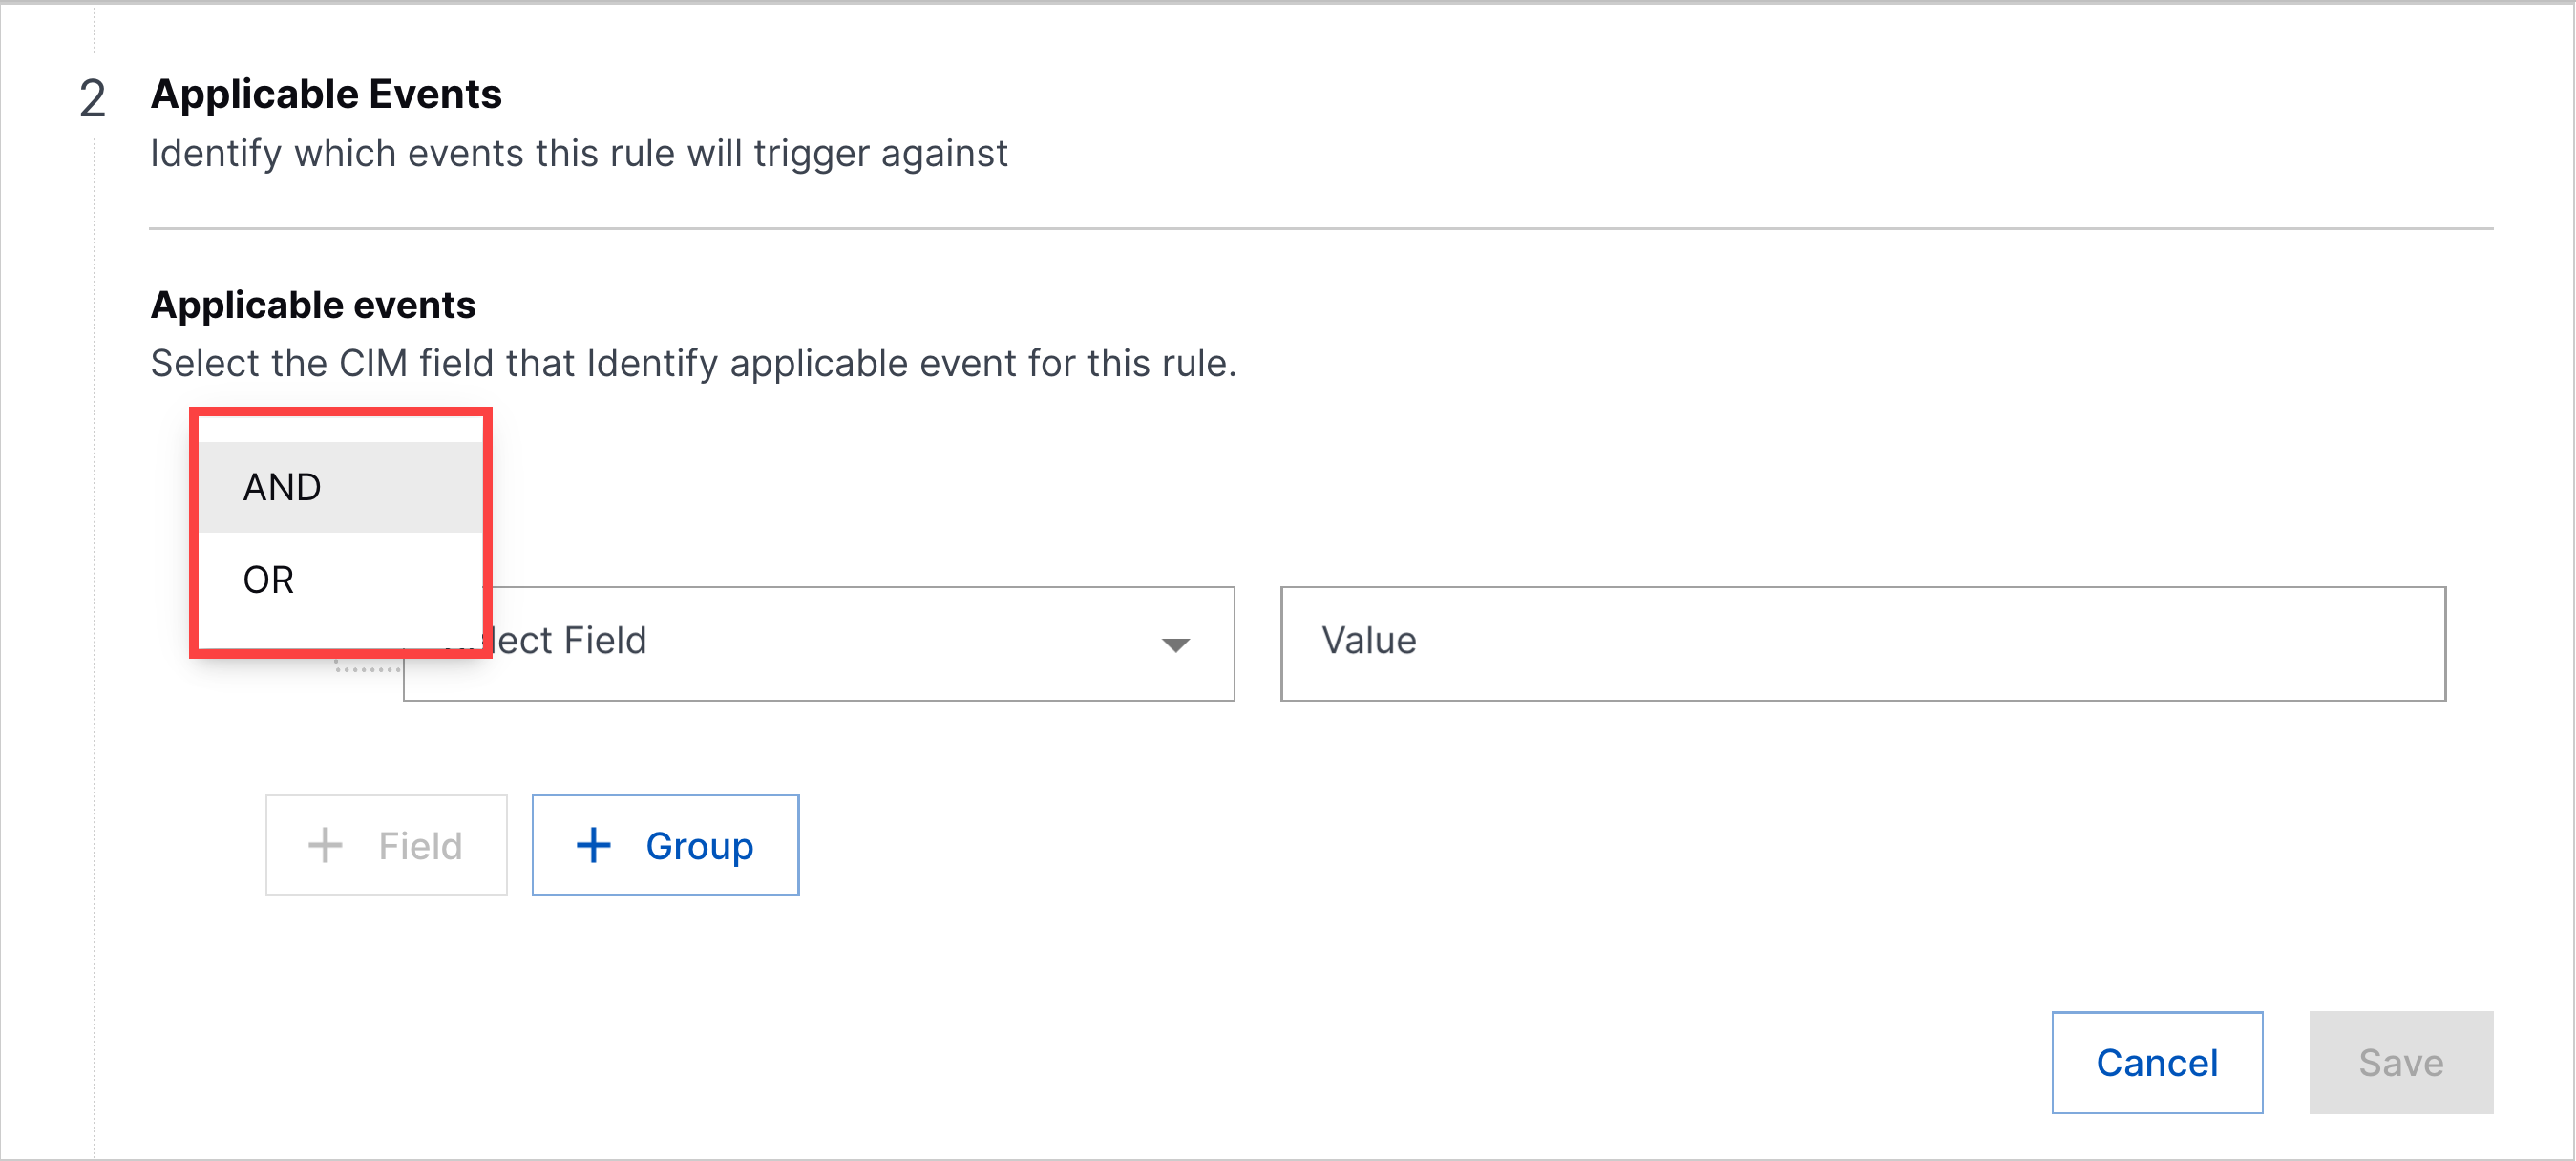 To build nested logic, you can now organize event fields into groups. Each group functions like a set of parentheses containing multiple fields evaluated together using 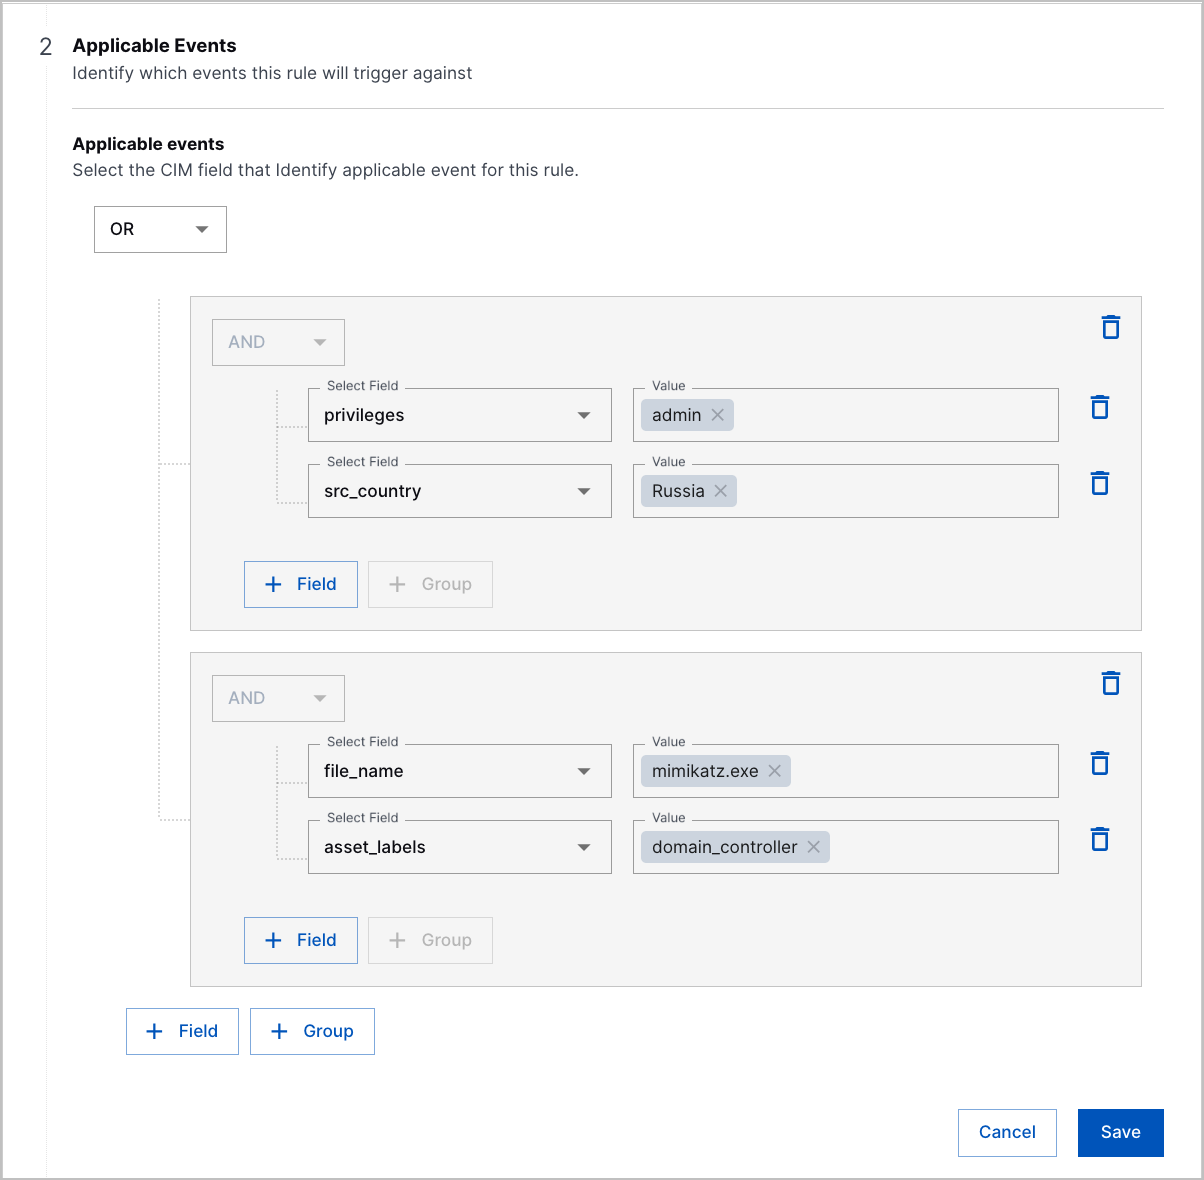 |
New Analytics Rule Functions | You can now identify randomly generated host and domain names and retrieve values from context tables with three new functions:
|
minTotalEventsThreshold and maxTotalEventsThreshold Fields for Select Analytics Rules | To more precisely control when numericCountProfiledFeature, numericDistinctCountProfiledFeature, and numericSumProfiledFeature analytics rules trigger, you can now specify a minimum and maximum number of events the rule must evaluate during the Setting a minimum number of events prevents the analytics rule from triggering on an insignificant amount of events and reduces false positives. Setting a hard upper bound of events prevents the rule from over-triggering during a sudden spike of events. To configure a minimum and maximum threshold, add the 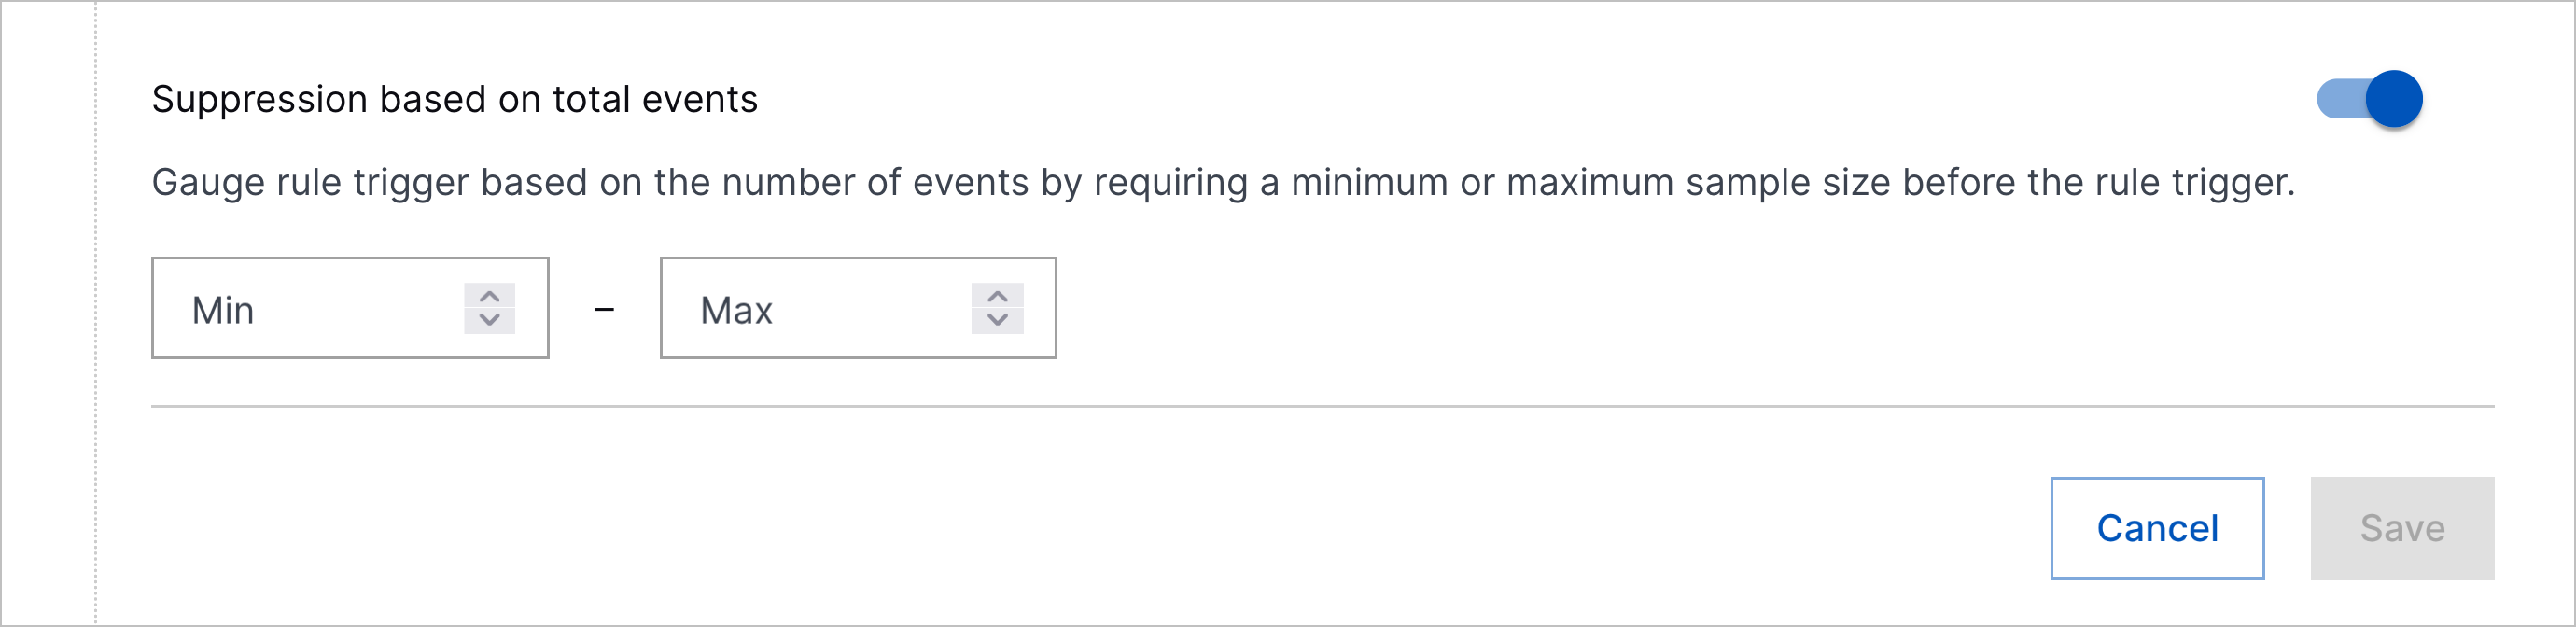 |
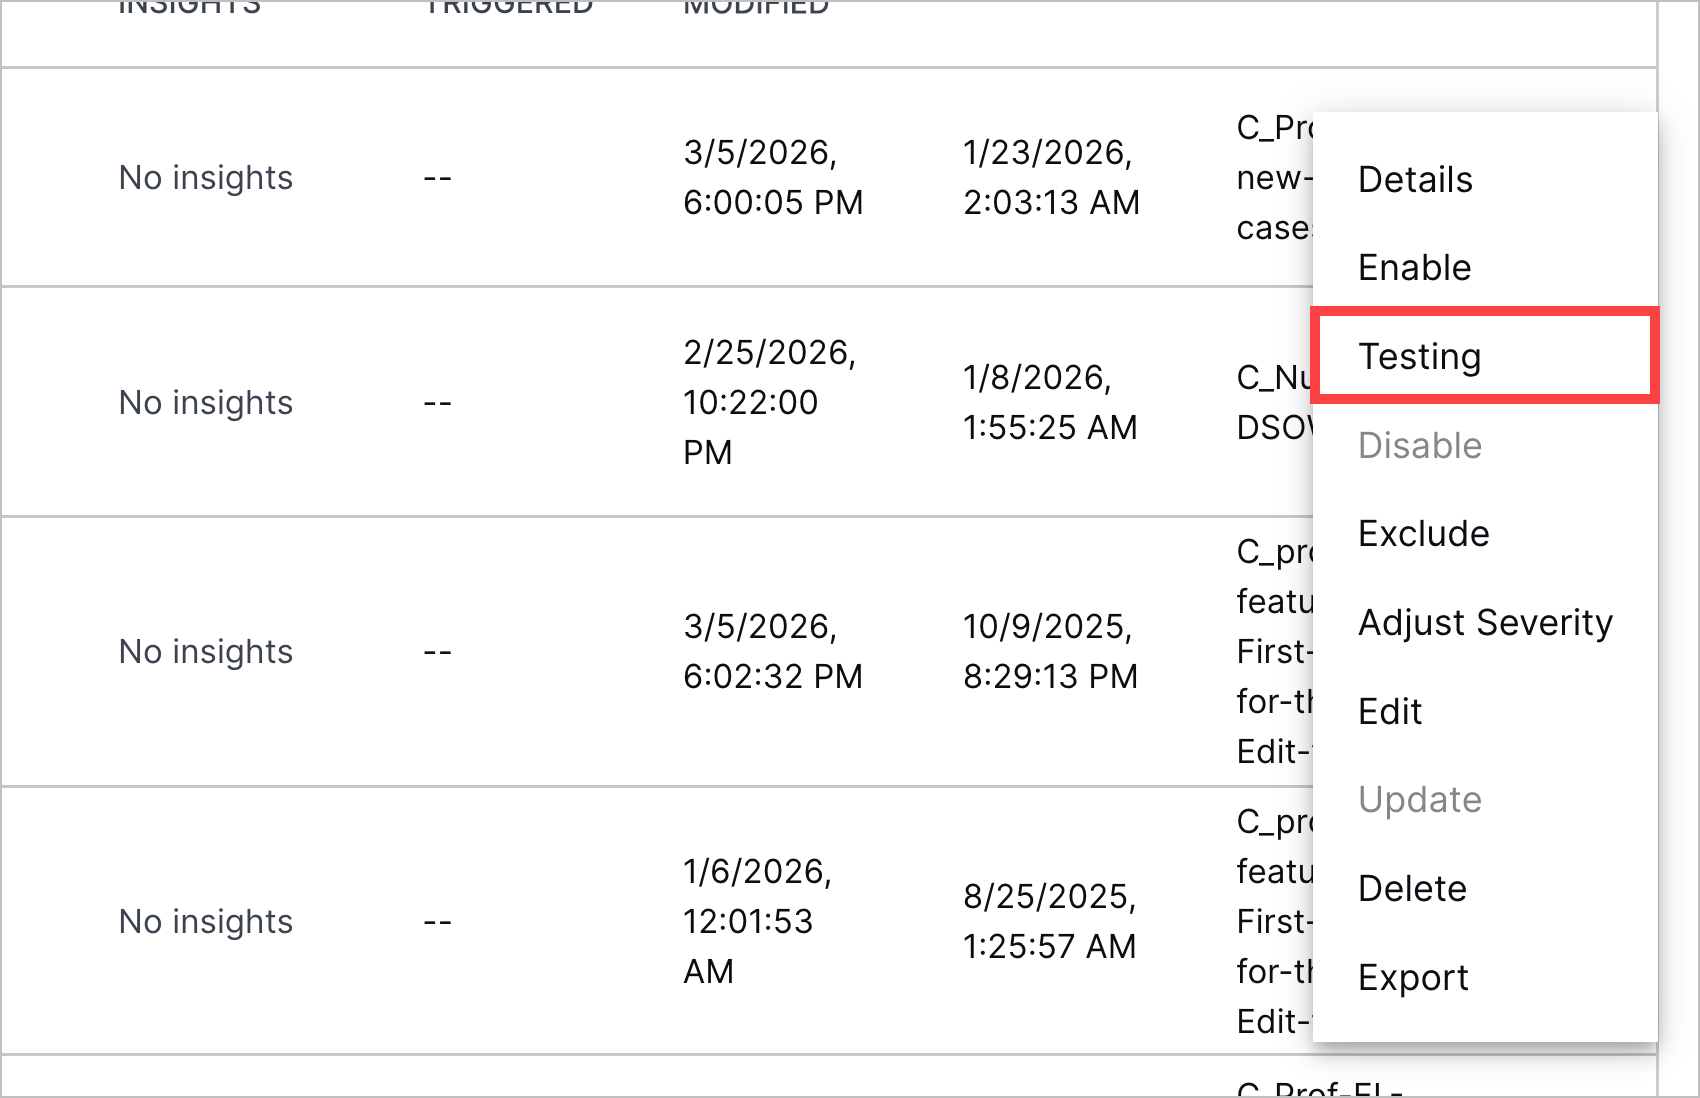
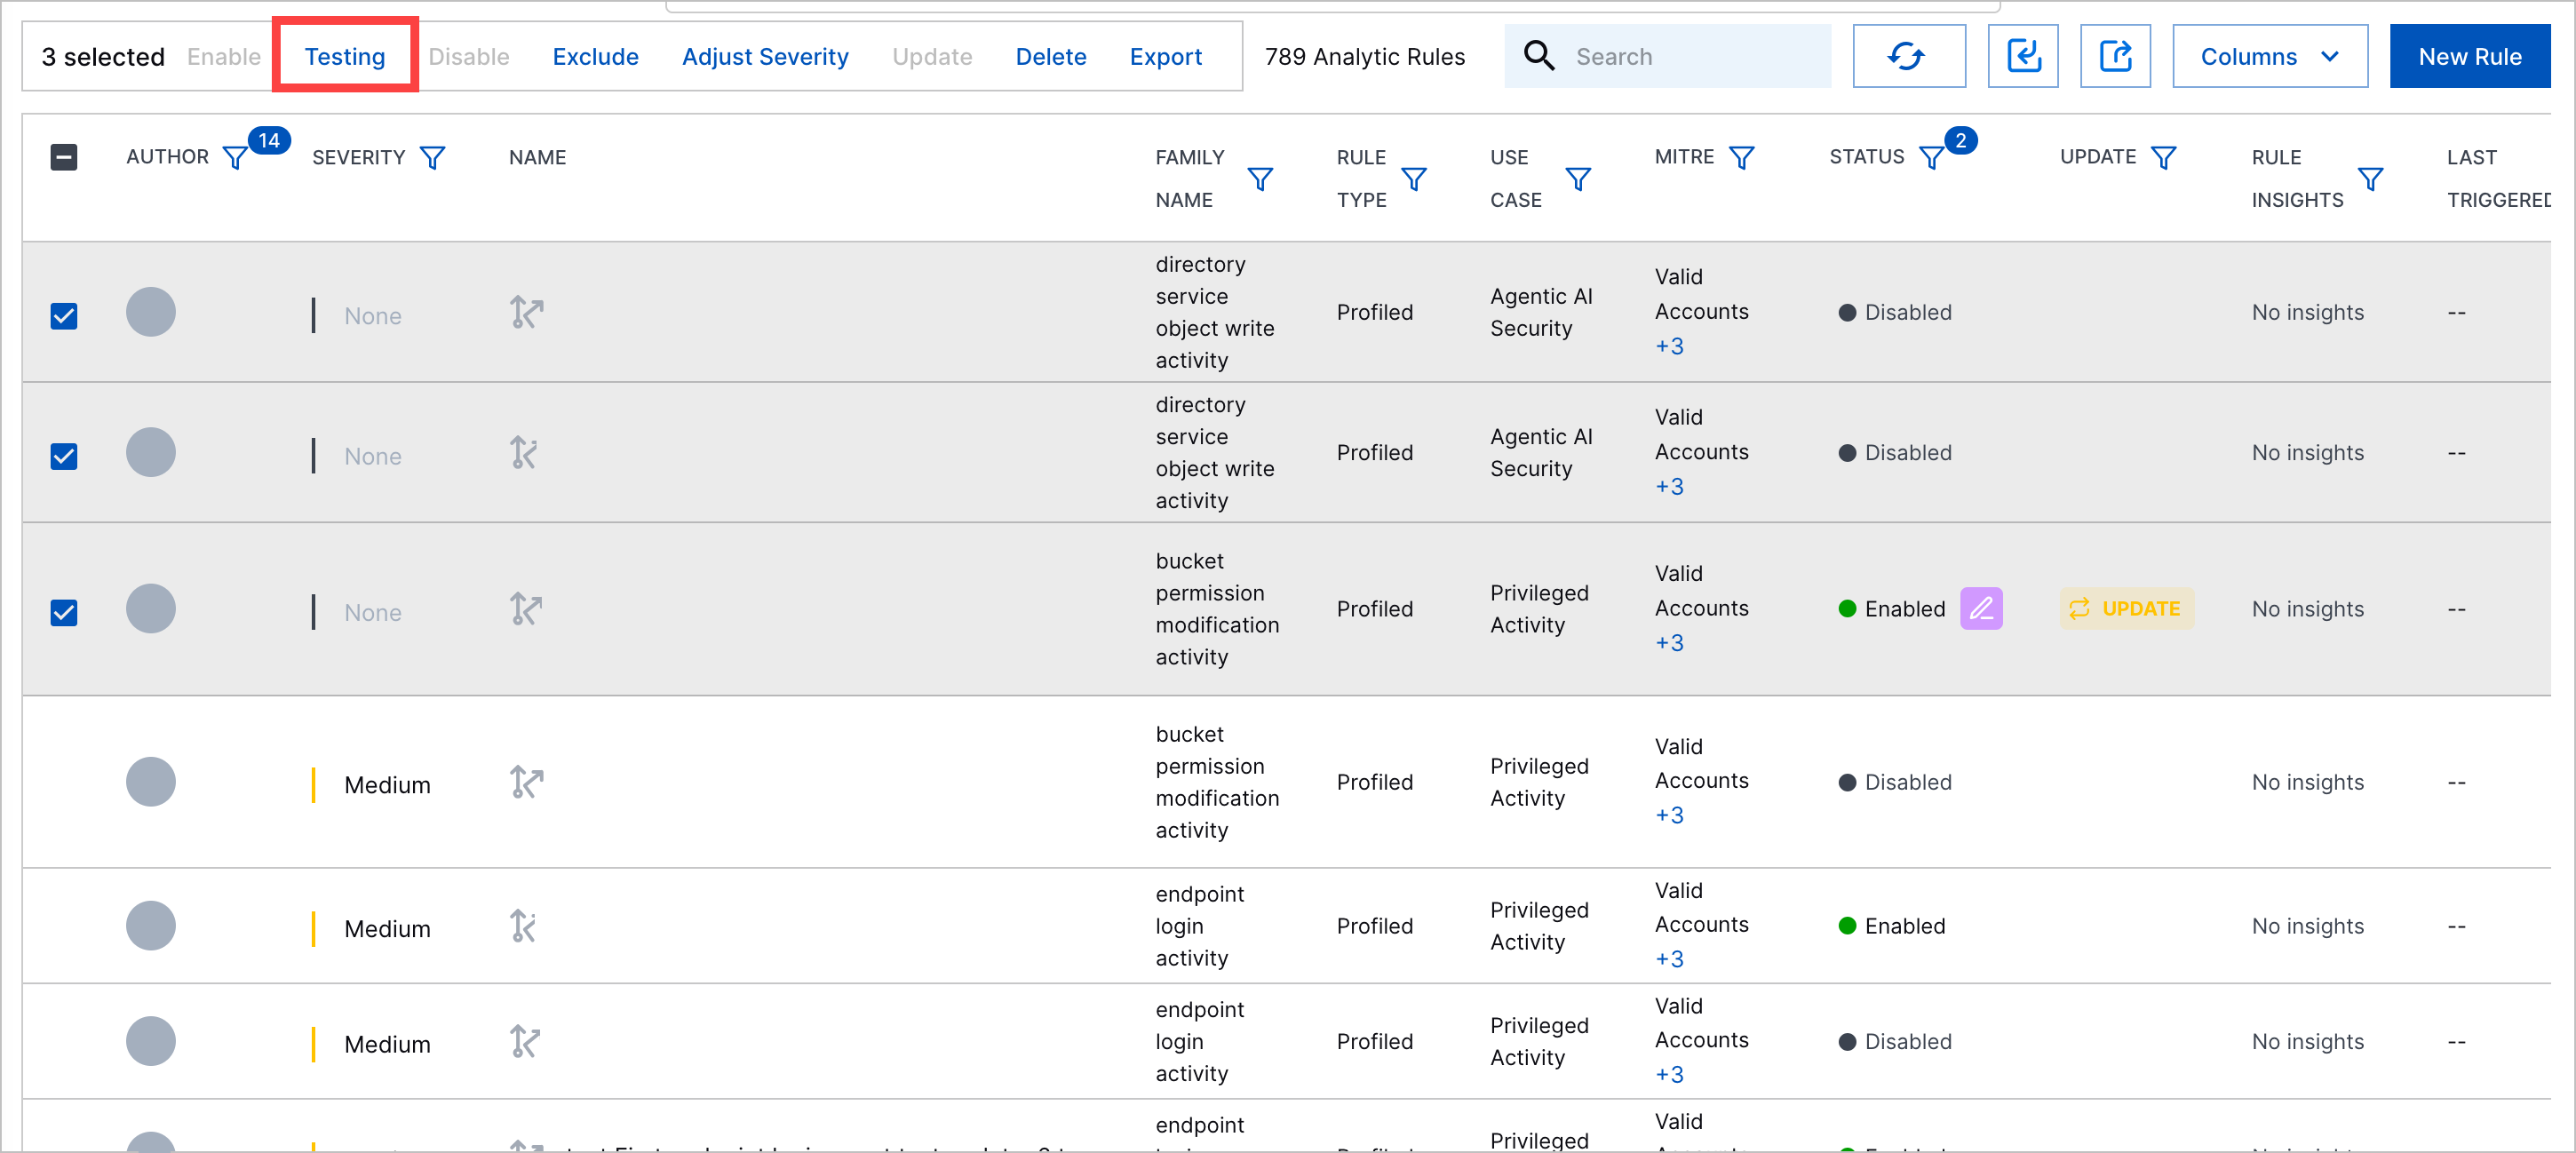
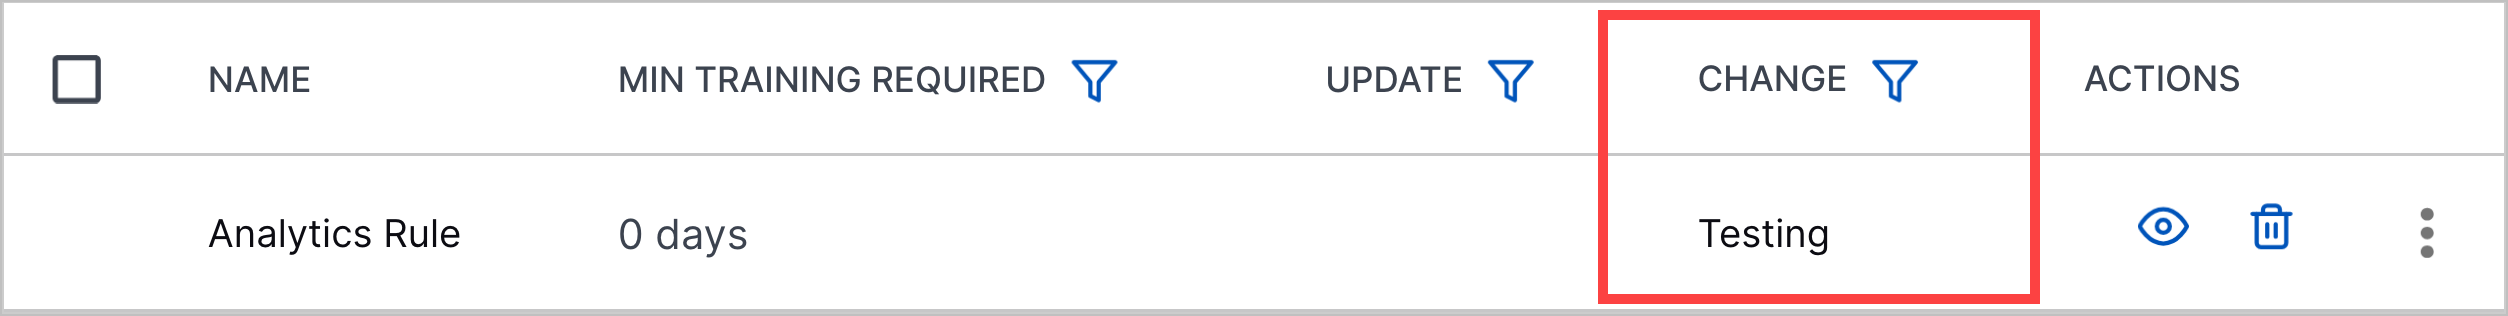
Analytics Rule Testing Enhancements | You can now more easily test analytics rules with enhancements to the analytics rule testing process:
|
Analytics Rules Quick Search Column | To investigate the events that trigger an analytics rule, you can now navigate to the events in Search using the new QUICK SEARCH column. 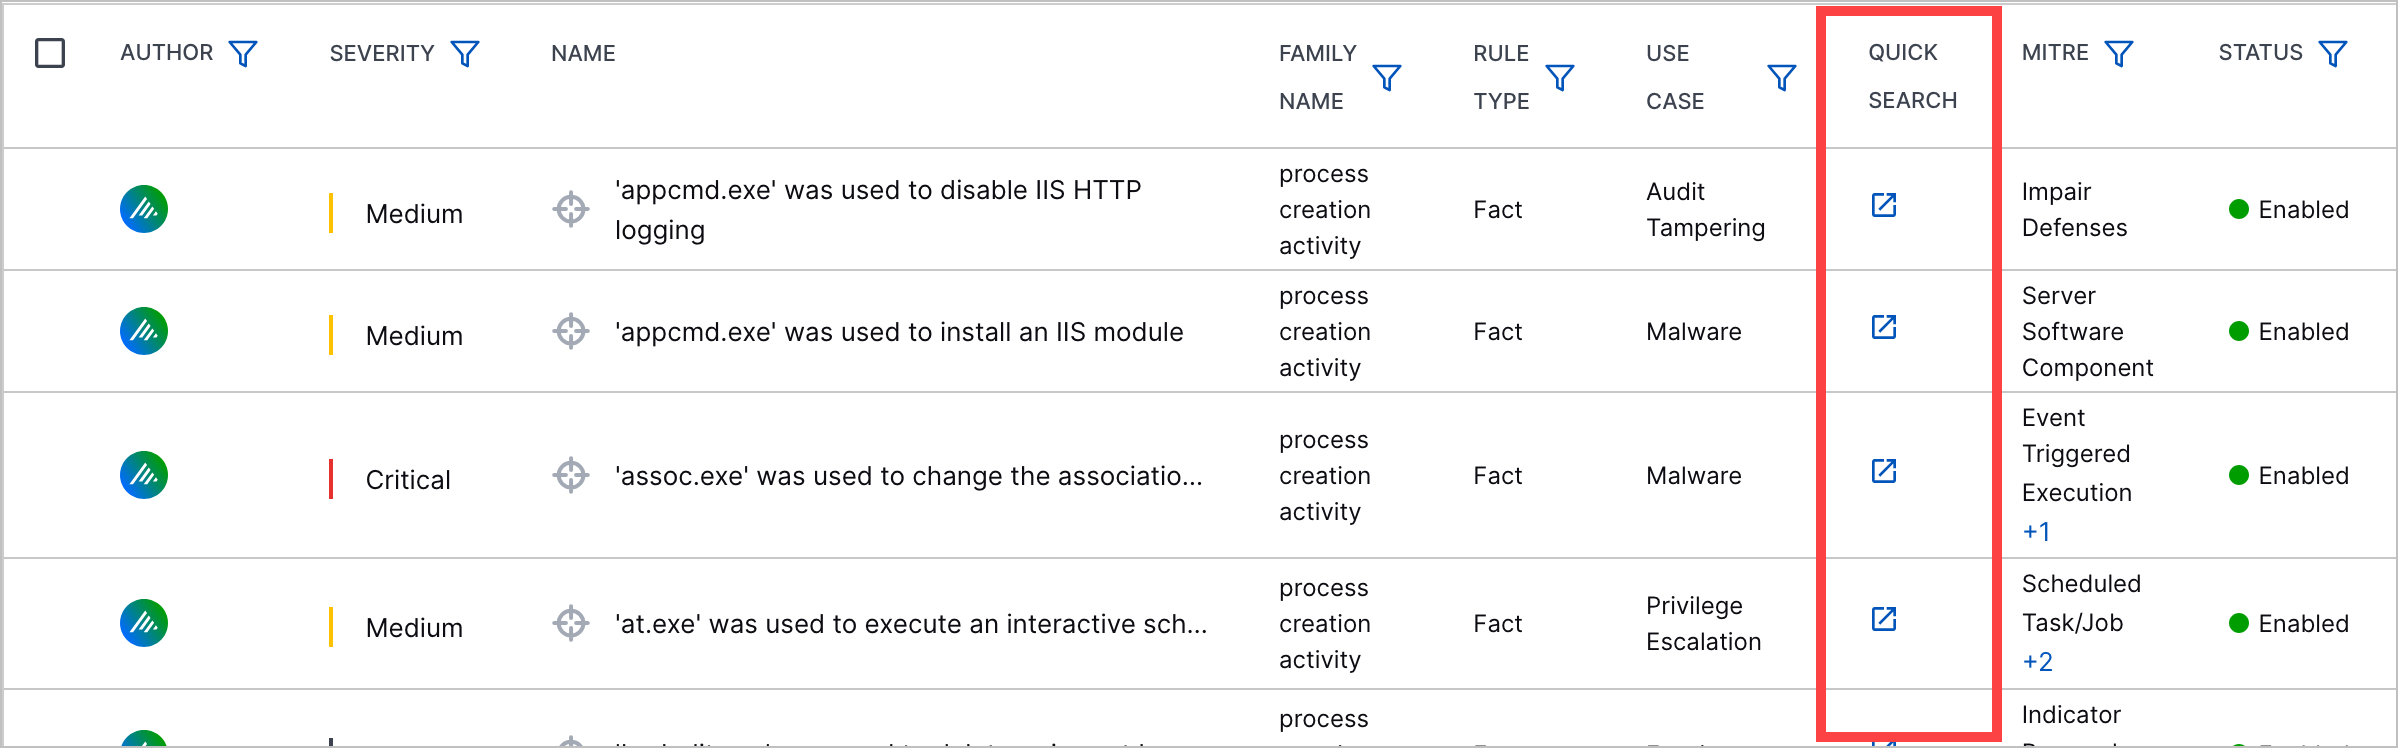 The column is not displayed by default. To display the column, you must manage which columns are displayed. |
Score Unless for profiledFeature and factFeature Analytics Rules in the Analytics Rule Builder | To create more complex trigger conditions for profiledFeature and factFeature analytics rules, you can now configure the Score Unless analytics rule field in the analytics rule builder. |
New and Updated Pre-Built Analytics Rules | You can now better detect abnormal AI usage patterns, first-time administrative actions, and potential prompt injection attempts with new and updated pre-built analytics rules. New pre-built analytics rules include:
Pre-built analytics rules for which
Pre-built analytics rules for which
Pre-built analytics rules for which
Pre-built analytics rules for which
Pre-built analytics rules for which
Pre-built analytics rules for which
Pre-built analytics rules for which
Pre-built analytics rules for which
|
Resolved Issues
Attack Surface Insights Resolved Issues
ID | Description |
|---|---|
ENG-88428 | Attributes with identical prefixes but different domains were incorrectly linked because Attack Surface Insights didn't differentiate between domains during prefix linking. During the prefix linking process, if the identifying entity attribute is Under this new prefix linking logic:
|
Threat Detection Management Resolved Issues
ID | Description |
|---|---|
ENG-79822 | In the analytics rule builder, the step to configure Applicable Events was incorrectly removed for contextFeature rules. The step has now been restored. |
Hotfixes in Site Collector 2.17 Release
The following table provides details about the hotfixes and enhancements implemented after the March 2026 release.
Release Number | Description |
|---|---|
2.17.1 | Resolved an issue for Site Collector trendline in which monitoring heartbeats that are trend indicators and the last seen timestamps were not updating in real-time on the user interface. You can now see consistent and up-to-date information for heartbeats and last seen status. |
Site Collector 2.17: Security Vulnerabilities Remediations
The Site Collectors 2.17 (March 2026) release includes remediated security vulnerabilities. For more information about Exabeam’s commitment to remediating vulnerabilities for Site Collector, see the Vulnerability Remediation Policy.
There are no open known CVEs in any container image (Nifi). Toolkit has been deprecated and is no longer in use hence no security vulnerabilities update is available for that.
The following table lists the CVEs remediated for the Nifi container and their severity.
Critical | High | Medium | Low |
|---|---|---|---|
Total: 0 | Total: 3 | Total: 30 | Total: 16 |
– |
|
|
|