- Get Started with Threat Center
- Threat Center
- Threat Center Permissions
- Threat Center Alerts: Read
- Threat Center Alerts: Read, Write, and Delete
- Threat Center Cases: Read
- Threat Center Cases: Read, Write, and Delete
- Threat Center Detection Grouping Rules: Read
- Threat Center Detection Grouping Rules: Read, Write, and Delete
- Threat Center Watchlist: Read
- Threat Center Watchlist: Read, Write, and Delete
- Threat Center Cases
- Threat Center Alerts
- Threat Center Detections
- Threat Center Risk Score
- Configure Threat Center
- Monitor Entities of Interest in Threat Center
- Work on Cases
- Work on Alerts
- Edit and Collaborate in Threat Center
- Use Automation Tools in Threat Center
- Find Cases and Alerts
- Sort Cases or Alerts
- Filter Cases or Alerts
- Search for Cases or Alerts in Threat Center
- Build a Search in Threat Center
- Enter a Search Using Exabeam Query Language in Threat Center
- Enter a Search Using Natural Language in Threat Center
- Run a Recent Search in Threat Center
- Create a New Saved Search in Threat Center
- Run a Saved Search in Threat Center
- Edit a Saved Search in Threat Center
- Delete a Saved Search in Threat Center
- View Case and Alert Metrics
- Get Notified About Threat Center
- Threat Center APIs
Respond to a Case
After you create a case, investigate, remediate, and close it. Document your response and track your progress.
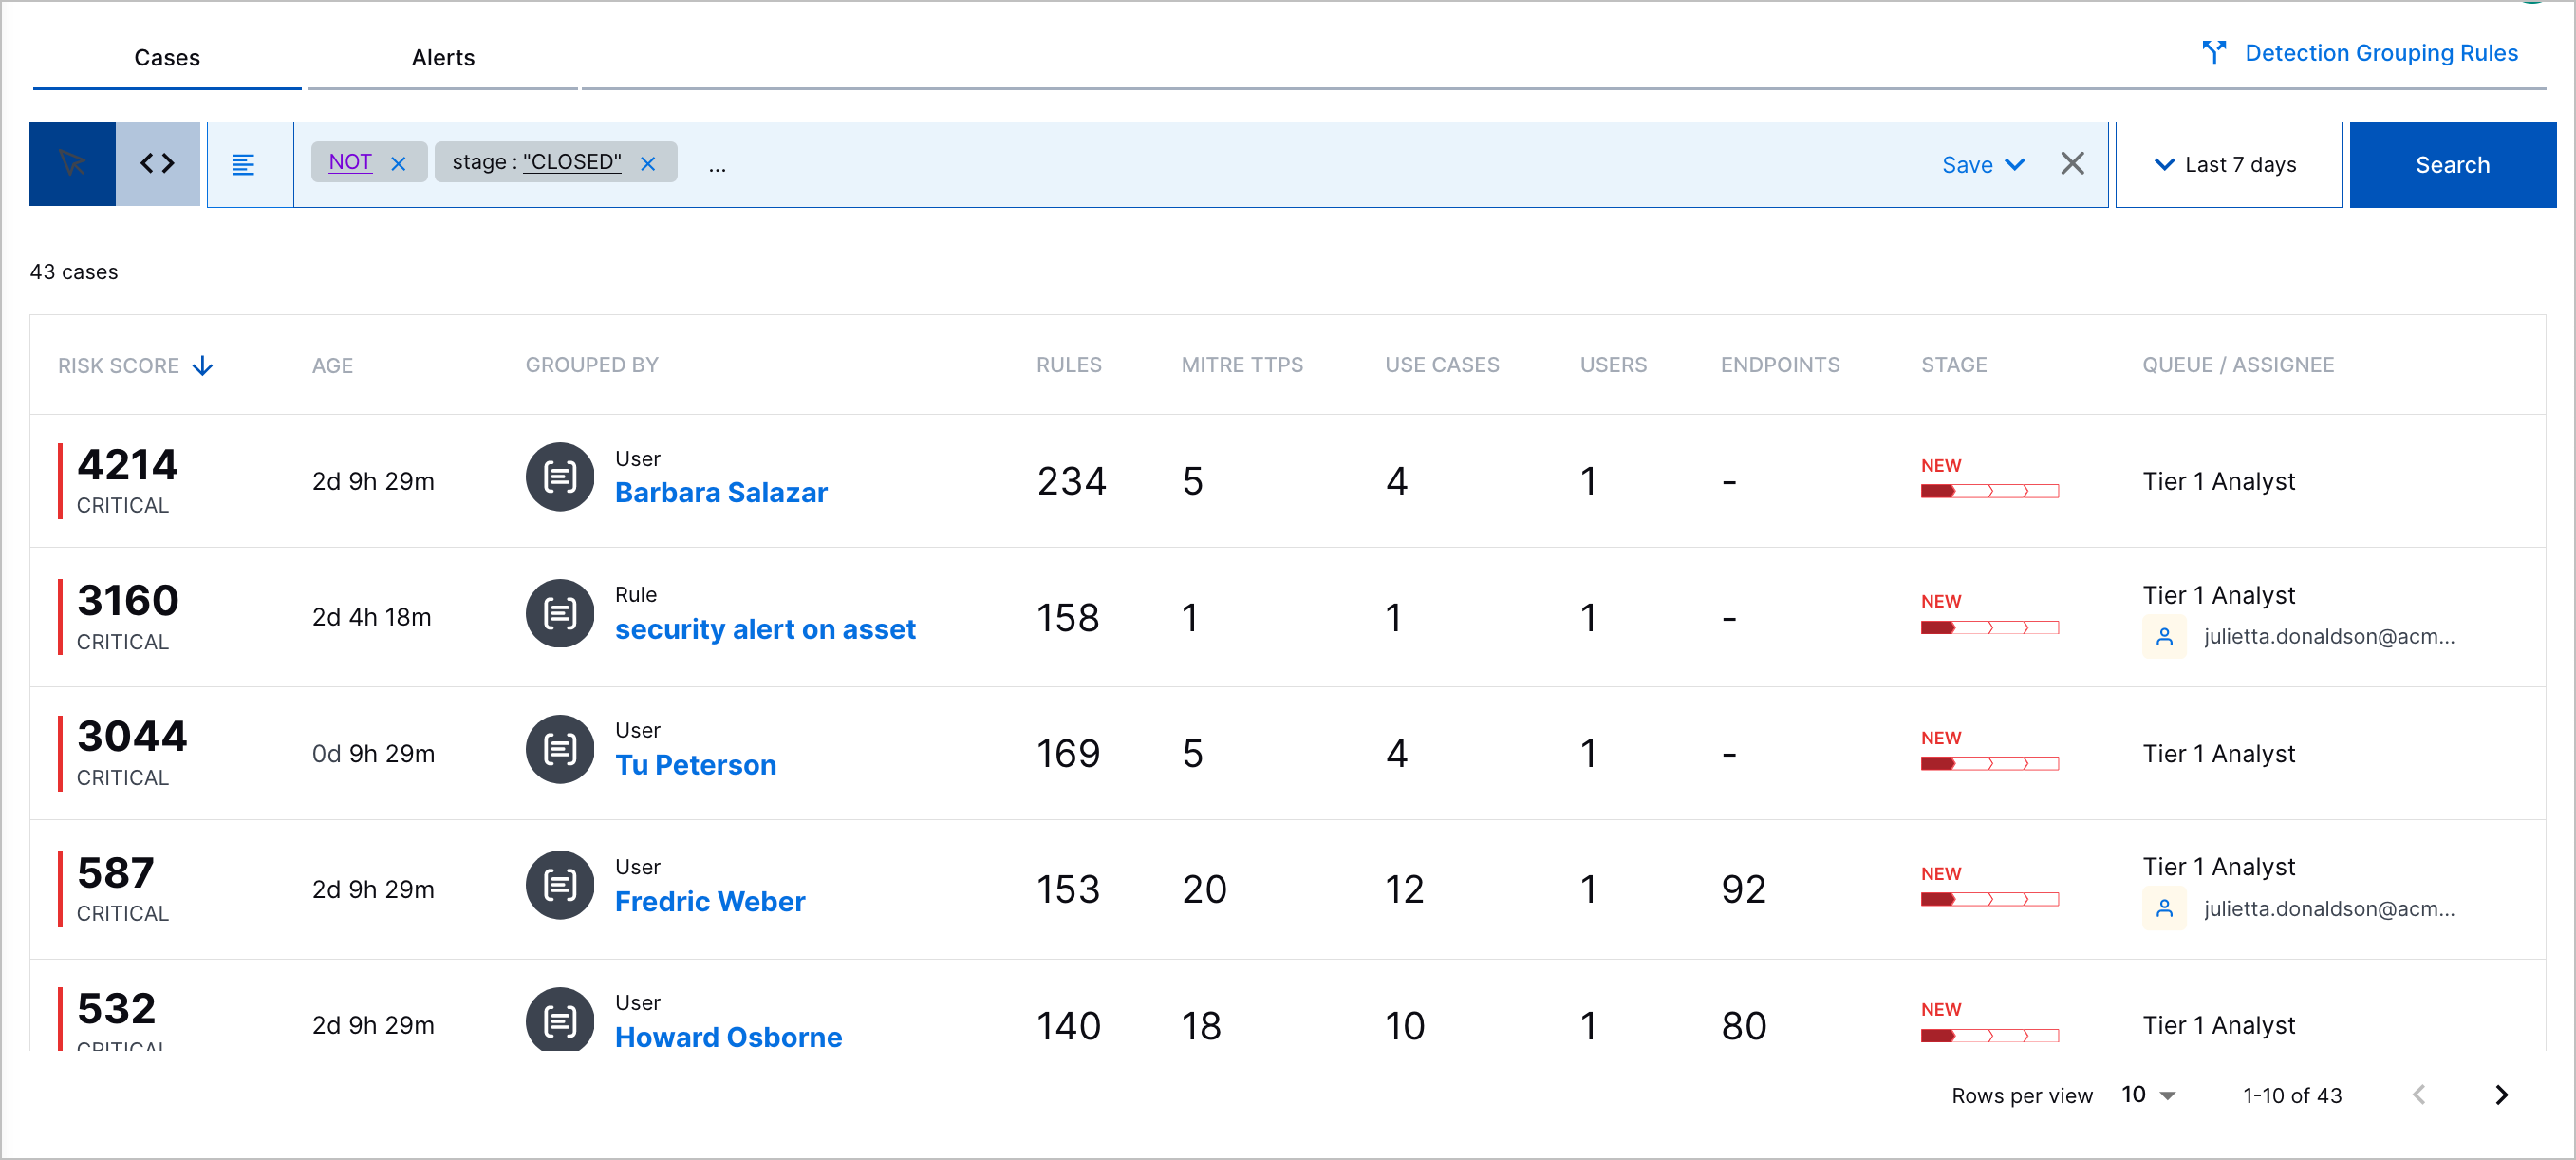
Find cases of interest. By default, Threat Center displays cases opened in the past week, and cases are sorted by risk score, from highest to lowest.
Get an overview of cases of interest:

Risk Score – The case risk score and associated priority.
Case Number – The unique case ID assigned to the case.
Title – The case name.
Created – The date and time the case was created and the time elapsed since the case was created.
Grouped By – The attribute by which detections are grouped. If the detections are grouped by entity, to view the entity details, click the entity. If you receive an error, the entity may have been deleted.

Scope – The number of objects associated with the case:
The number of triggered analytics, correlation, or Advanced Analytics rules associated with related detections
The number of MITRE ATT&CK® tactics and techniques the case best describes[6]
The number of Exabeam use cases the case best describes
The number of users associated with related detections
The number of source and destination hosts associated with related detections.
Stage – The current case stage.
Queue – The queue assigned to respond to the case.
Assignee – The assignee assigned to respond to the case.
 – Navigate to all related detections in the Search timeline view.
To view more details about a case, select the case.
In the Overview tab, get an overview of the case:
Exabeam Nova Investigation Summary – An AI-generated summary of the case and recommended next steps. This summary is updated every time detections are added to the case.
Risk Score – The case risk score and associated priority.
User Description – The case description.
Grouped By – The attribute by which detections are grouped. If the detections are grouped by entity, to view the entity details, click View Details.
Timeframe – Important markers of time associated with the case, including:
First Detection – The date and time the first detection was added to the alert.
Duration – The days, hours, and minutes elapsed between when the first and last detection was added to the alert.
Case Creation – The date and time the case was created.
Age – For an open case, the days, hours, and minutes elapsed between when the case was created and the current time; or, for a closed case, the days, hours, and minutes between when the case was created and last closed.
Users – Users associated with related detections.
Devices – The source and destination hosts associated with related detections.
Rules Triggered – The top seven triggered rules from which associated detections are created and the number of times they created associated detections. To view all triggered rules from which associate detections are created, click View all rules.
Latest Notes – The notes most recently added to the case.
MITRE TTPs – The ATT&CK tactics and techniques that best describe the case.
Use Cases – The Exabeam use cases that best describe the case.
Attachments – Files attached to the case.
Under the Threat Timeline tab, understand the historical context around the case. Review a timeline of related detections; up to 100 associated parsed events; and key response moments, including when the associated alert was created, when the case was created, when the investigation started, when remediation ended, and when the case closed.
To continue your investigation and view the event in Search, click Open in Search.
To view all detection details, including the assigned risk score, ATT&CK tactics and techniques, Exabeam use cases, tags, and event fields associated with the detection, click View All.
To view all parsed event fields, click View All Fields.
For analytics rule detections, to review more information about the analytics rule that created the detection, click Rule Definition, then view:
The triggered analytics rule name and description
Detection reason – The reason why the event triggered the analytics rule.
Author – Who created the analytics rule. If the analytics rule is pre-built, the author is Exabeam.
Created – The date and time the analytics rule was created.
Last modified – The date and time the analytics rule was last modified.
Status – Whether the analytics rule is enabled or disabled.
Tags – Tags associated with the analytics rule.
Use Cases Coverage – Exabeam use cases associated with the analytics rule.
MITRE ATT&CK Coverage – ATT&CK tactics and techniques associated with the analytics rule.
The entire triggered analytics rule definition.
For Advanced Analytics detections, to review all events for the user or asset in the Advanced Analytics Smart Timeline™, click View Timeline in Advanced Analytics.
For correlation rule detections, to review more information about the correlation rule that created the detection, click Rule Definition, then view:
Name – The correlation rule name.
Author – Who created the correlation rule.
Severity – The rule severity: None, Low, Medium, High or Critical.
Use Case – The Exabeam use case most relevant to the rule.
MITRE Properties – The ATT&CK techniques most relevant to the rule.
Tags – Tags associated with the rule.
Repeating Triggers – The field values by which the rule is suppressed if the rule is over-triggered.
As you work on a case:
Update the priority and case stage, assign the case to another queue or assignee, and add notes and attachments with your findings.
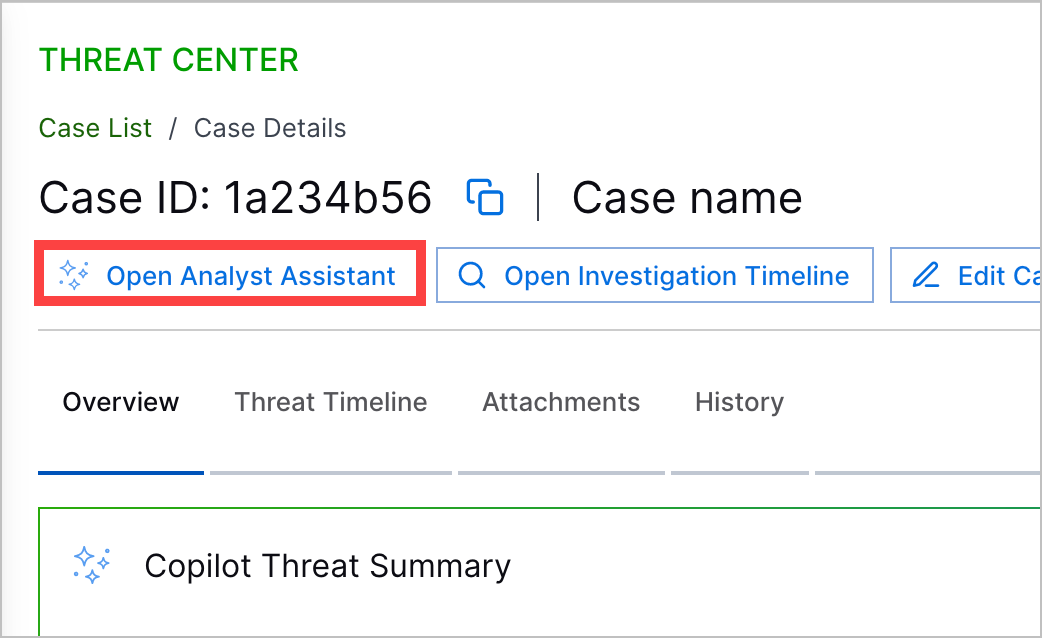
Expedite your case response and get answers to any question about the case or related entities using the Exabeam Nova Analyst Assistant. To navigate to the Exabeam Nova Analyst Assistant, click Exabeam Nova, then navigate to the Analyst Asisstant tab.[7]

In Exabeam Nova Analyst Assistant, enter a prompt, then press return or Enter or click
 .
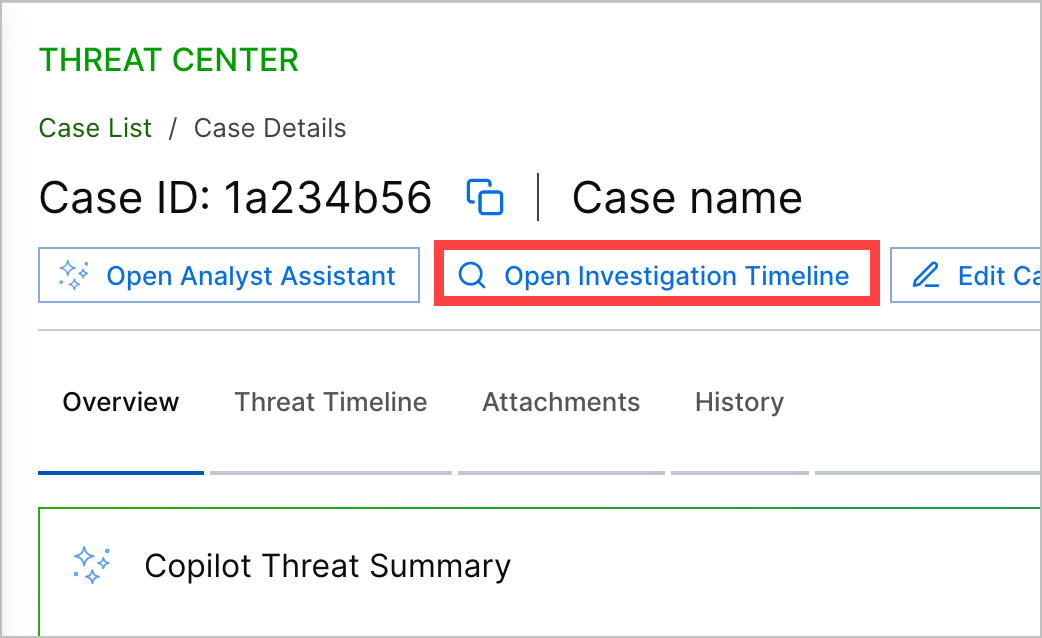
.Deepen your investigation in Search and view all detections related to the case. To navigate directly to detections in the Search timeline view, click Timeline.

[6] MITRE ATT&CK and ATT&CK are trademarks of The MITRE Corporation ("MITRE"). Exabeam is not affiliated with or sponsored or endorsed by MITRE. Nothing herein is a representation of the views or opinions of MITRE or its personnel.
[7] This tool is designed to condense security event data into easy-to-understand language, focusing on important security details. It can also answer follow-up questions and discuss security tech topics, but its accuracy might vary outside these areas. Always double-check responses for crucial decisions. Your queries and data will only be retained temporarily and won't be used for AI training. Exabeam is actively improving this tool and welcomes feedback.
