- Advanced Analytics
- Understand the Basics of Advanced Analytics
- Configure Log Management
- Set Up Admin Operations
- Set Up Authentication and Access Control
- Additional Configurations
- Configure Rules
- Exabeam Threat Intelligence Service
- Threat Intelligence Service Prerequisites
- View Threat Intelligence Feeds
- Threat Intelligence Context Tables
- View Threat Intelligence Context Tables
- Assign a Threat Intelligence Feed to a New Context Table
- Create a New Context Table from a Threat Intelligence Feed
- Check ExaCloud Connector Service Health Status
- Exabeam Cloud Telemetry Service
- Manage Security Content in Advanced Analytics
- Health Status Page
Proactive and On-Demand System Health Checks
System Health is used to check the status of critical functionality across your system and assists Exabeam engineers with troubleshooting. Exabeam provides visibility on the backend data pipeline via Health Checks. Graphs and tables on the page visually represent the health status for all of the key systems, as well as indexes and the appliance, so you are always able to check statuses at a glance and track health over time.
Proactive health checks run automatically and periodically in the background.
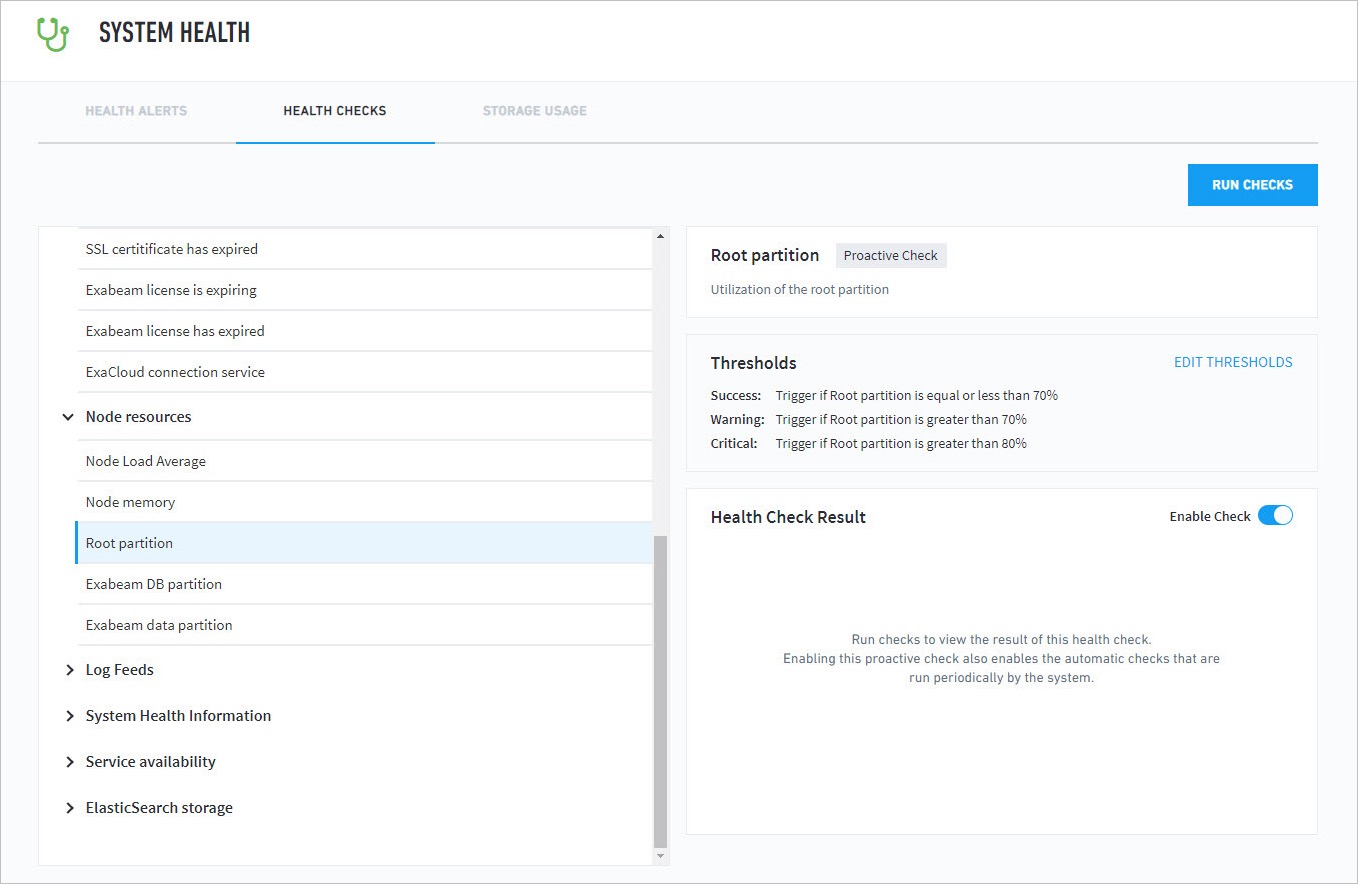
On-demand health checks can be initiated manually and are run immediately. All newly gathered health check statuses and data is updated in the information panes on the page. All proactive and on-demand health checks are listed on the Health Checks page. Proactive health checks are visible by any user in your organization. Only users with administrator permission can reach the page.
 |
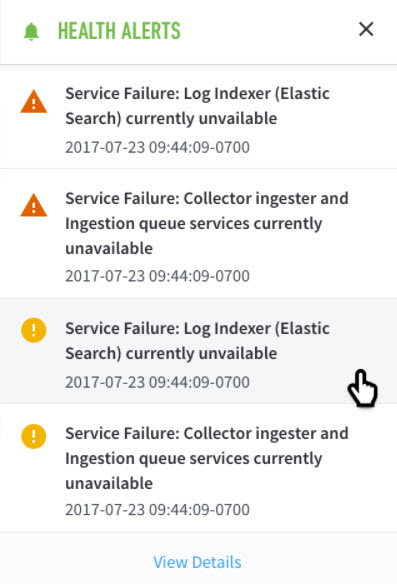
When a health check is triggered, a notification message is displayed in the upper right corner of the UI. Select the alert icon to open a side panel that lists the alerts and provides additional detail. A panel listing all notifications is expanded.
 |
These alerts are also listed under the Health Alerts tab in the System Health page. In general:
Warning: There is an issue that should be brought to the attention of the user.
Critical: Immediate action is recommended. In all cases, if an alert is raised on your system, please contact Exabeam Customer Success.
To reach the Health Checks page, navigate to the System Health page from the Settings tab at the top right corner of any page, then select the Health Checks tab.
Health check categories are:
Service Availability – License expiration, database, disaster recovery, Web Common application engine, directory service, aggregators, and external connections
Node Resources – Load, performance, and retention capacity
Service Availability (Incident Processors and Repositories) - IR, Hadoop, and Kafka performance metrics
Advanced Analytics Specific Health Checks
Log Feeds – Session counts, alerts, and metrics
System Health Information – Core data and operations processor metrics
Elasticsearch Storage (Incident Responder) – Elasticsearch capacity and performance metrics
 |
