- Onboard Cloud Collectors
- Shareable Service Accounts
- Add Accounts for AWS Cloud Collectors
- Add Accounts for Cisco Duo Cloud Collector
- Add Accounts for Google Cloud Collectors
- Add Accounts for Microsoft Cloud Collectors
- Add Accounts for Okta Cloud Collectors
- Add Accounts for Salesforce Cloud Collectors
- Add Accounts for Splunk Cloud Collectors
- Add Accounts for Trend Micro Cloud Collectors
- Add Accounts for Wiz
- Abnormal Security Cloud Collector
- Anomali Cloud Collector
- AWS CloudTrail Cloud Collectors
- AWS CloudWatch Cloud Collector
- AWS CloudWatch Alarms Cloud Collector
- AWS GuardDuty Cloud Collector
- AWS S3 Cloud Collector
- AWS Security Lake Cloud Collector
- AWS SQS Cloud Collector
- Azure Activity Logs Cloud Collector
- Azure Blob Storage Cloud Collector
- Azure Log Analytics Cloud Collector
- Azure Event Hub Cloud Collector
- Azure Storage Analytics Cloud Collector
- Azure Virtual Network Flow Cloud Collector
- Box Cloud Collector
- Broadcom Carbon Black Cloud Collector
- Cato Networks Cloud Collector
- ChatGPT Enterprise Cloud Collector
- Cisco Duo Cloud Collector
- Cisco Meraki Cloud Collector
- Cisco Secure Endpoint Cloud Collector
- Cisco Umbrella Cloud Collector
- Cloudflare Cloud Collector
- Cribl Cloud Collector
- CrowdStrike Cloud Collectors
- Cylance Protect (now Arctic Wolf) Cloud Collector
- DataBahn Cloud Collector
- Dropbox Cloud Collector
- GCP Cloud Logging Cloud Collector
- GCP Pub/Sub Cloud Collector
- GCP Security Command Center Cloud Collector
- Gemini Enterprise Cloud Collector
- GitHub Cloud Collector
- Gmail BigQuery Cloud Collector
- Google Workspace Cloud Collector
- LastPass Cloud Collector
- Microsoft Copilot Integration
- Microsoft Defender XDR (via Azure Event Hub) Cloud Collector
- Microsoft Entra ID Context Cloud Collector
- Microsoft Entra ID Logs Cloud Collector
- Microsoft 365 Exchange Admin Reports Cloud Collector
- Supported Sources from Microsoft 365 Exchange Admin Reports
- Migrate to the Microsoft 365 Exchange Admin Reports Cloud Collector
- Prerequisites to Configure the Microsoft 365 Exchange Admin Reports Cloud Collector
- Configure the Microsoft 365 Exchange Admin Reports Cloud Collector
- Troubleshooting the Microsoft 365 Exchange Admin Reports Cloud Collector
- Microsoft 365 Management Activity Cloud Collector
- Microsoft Security Alerts Cloud Collector
- Microsoft Sentinel (via Event Hub) Cloud Collector
- Mimecast Cloud Collector
- Mimecast Incydr Cloud Collector
- Netskope Alerts Cloud Collector
- Netskope Events Cloud Collector
- Okta Cloud Collector
- Okta Context Cloud Collector
- Palo Alto Networks Cortex Data Lake Cloud Collector
- Palo Alto Networks XDR Cloud Collector
- Phishing Email Inbox Cloud Collector
- PingOne Identity Cloud Collector
- Progress ShareFile Cloud Collector
- Proofpoint On-Demand Cloud Collector
- Proofpoint Targeted Attack Protection Cloud Collector
- Qualys Cloud Collector
- Recorded Future Cloud Collector
- Recorded Future Context Cloud Collector
- Rest API Cloud Collector
- S2W Threat Intelligence Cloud Collector
- Salesforce Cloud Collector
- Salesforce EventLog Cloud Collector
- SentinelOne Alerts Cloud Collector
- SentinelOne Cloud Funnel Cloud Collector
- SentinelOne Threats Cloud Collector
- SentinelOne Cloud Collector
- ServiceNow Cloud Collector
- Slack Cloud Collector
- Snowflake Cloud Collector
- Sophos Central Cloud Collector
- Splunk Cloud Collector
- STIX/TAXII Cloud Collector
- Symantec Endpoint Security Cloud Collector
- Tenable Cloud Collector
- Trend Vision One Cloud Collector
- Trellix Endpoint Security Cloud Collector
- Vectra Cloud Collector
- Webhook Cloud Collectors
- Wiz Issues Cloud Collector
- Wiz API Cloud Collector
- Workday Cloud Collector
- Zoom Cloud Collector
- Zscaler ZIA Cloud Collector
- Shareable Service Accounts
Configure the Splunk Cloud Collector
Set up the Splunk Cloud Collector to continuously ingest security events from Splunk Cloud.
Before you configure the Splunk Cloud Collector, ensure that you complete the Prerequisites to Configure the Splunk Cloud Collector.
Log in to the New-Scale Security Operations Platform with your registered credentials as an administrator.
Navigate to Collectors > Cloud Collectors.
Click New Collector.
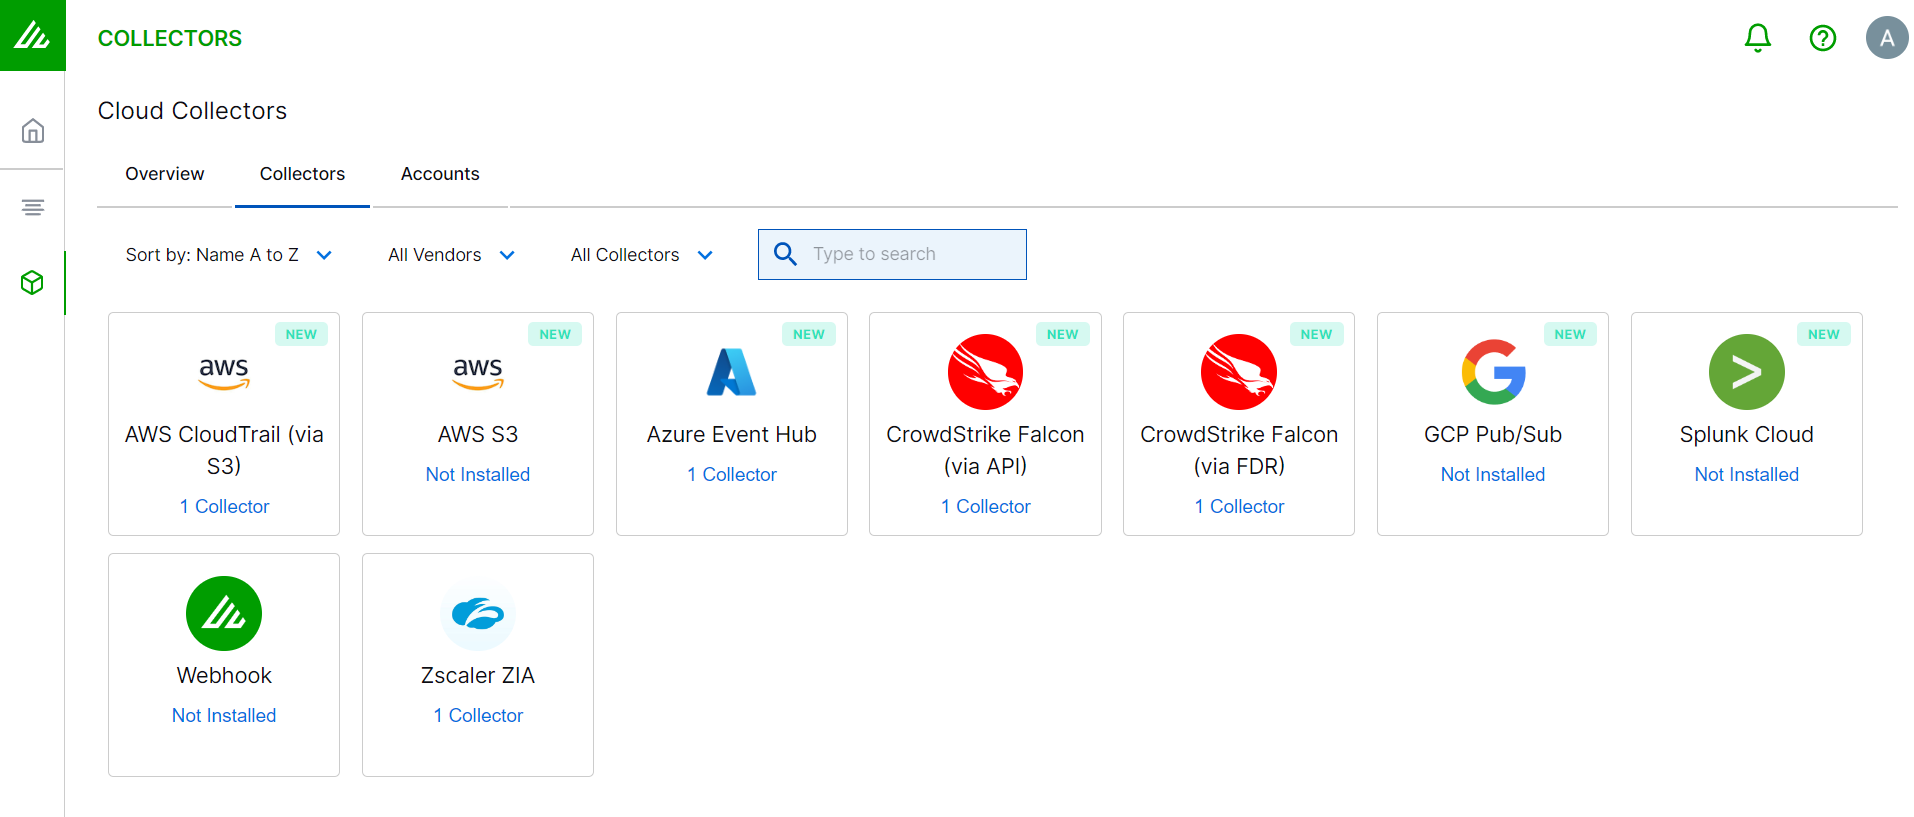
Click Splunk.
Enter the following information for the cloud collector:
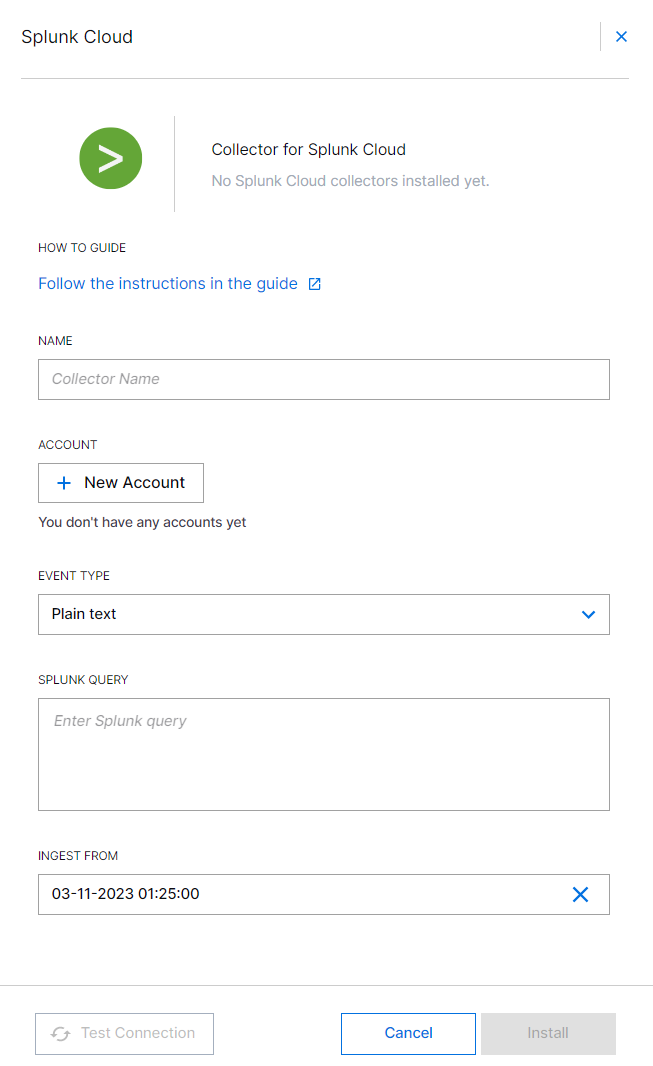
Name – Specify a name for the Cloud Collector instance.
Account – Select an account. If you have not created a Splunk account, click New Account to add a new Splunk account. You can use this account information across one or more Splunk Cloud Collectors. For more information, see Add Accounts for Splunk Cloud Collector.
Event Type – Select the format in which you want to receive event data. This is a format in which you want your Splunk query to respond.
Plain text – Use the plain text format to ingest a cloud log source that can forward logs in plain text format.

JSON – Use the JSON format to ingest a cloud log source that can forward logs in JSON format, containing single or multiple objects.

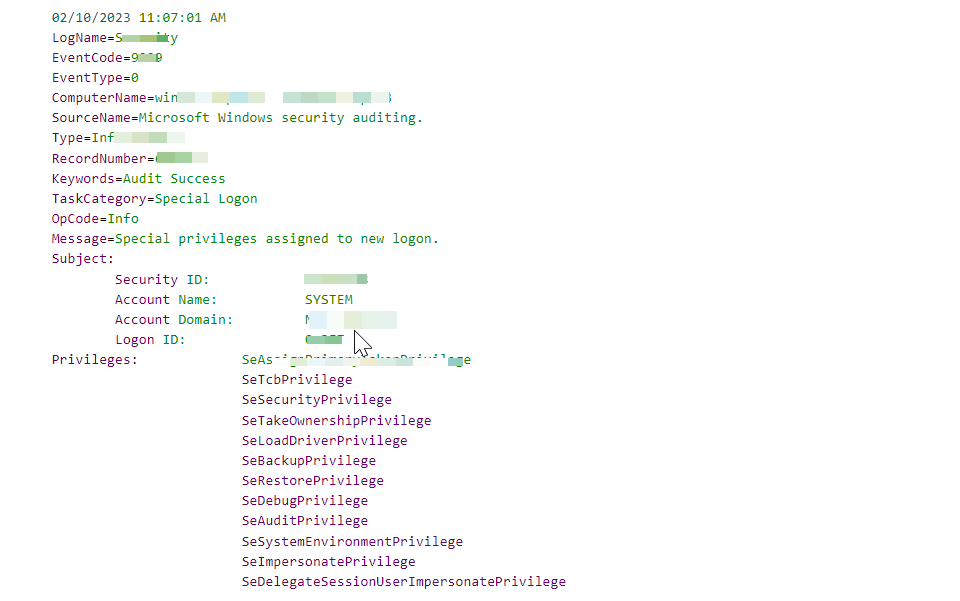
Windows Multiline – Use the Windows Multiline format to ingest a cloud log source that can forward logs in Windows Multiline format.
Note
The Splunk Cloud Collector fetches the Splunk metadata fields:
_time,sourcetype, andhostin addition to the_rawfield.Splunk Query – Enter the Splunk query that you use in the Splunk Cloud for fetching data, based on your requirement. Ensure that the Splunk query that you specify suits the event format that you set for receiving data. For example, a Splunk search query: search index=_internal.
Ingest From – Select the time and date to provide a threshold before which the collector will exclude events. If you want to select a threshold to include events to be ingested from the past, select a date previous to the present date. You can select a date which is backdated to 30 days.
If you leave this field blank and do not provide a threshold, all data is ingested starting from when the collector started running. However, the Cloud Collector does not collect historical events.
Note
After you complete the Cloud Collector configuration, you cannot modify the Ingest From date.
Collecting historical events is not supported with Advanced Analytics i62.x or i63.x. For more information see Supported Deployments.
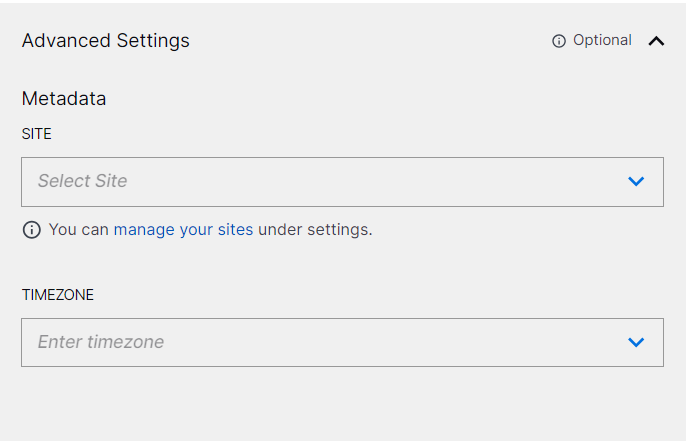
(Optional) SITE – Select an existing site or to create a new site with a unique ID, click manage your sites. Adding a site name helps you to ensure efficient management of environments with overlapping IP addresses.
By entering a site name, you associate the logs with a specific independent site. A sitename metadata field is automatically added to all the events that are going to be ingested via this collector. For more information about Site Management, see Define a Unique Site Name.
(Optional) TIMEZONE – Select a time zone applicable to you for accurate detections and event monitoring.
By entering a time zone, you override the default log time zone. A timezone metadata field is automatically added to all events ingested through this collector.
To confirm that the New-Scale Security Operations Platform communicates with the service, click Test Connection.
Click Install.
A confirmation message informs you that the new Cloud Collector is created.
Troubleshoot Common Errors
Refer to the following examples to troubleshoot common errors.
Example 1– Error Message about Search Job Limit
Error – The following error indicates that the current searches are 50 and the search job limit is 50. The Search Job Limit must be greater than the configured limits.
HTTP 503 –
{"messages":[{"type":"WARN","text":"Search
not executed: The maximum number of concurrent historical searches on this
instance has been reached., concurrency_category=\"historical\",
concurrency_context=\"instance-wide\", current_concurrency=50,
concurrency_limit=50","help":""}]}
Resolution – In the Splunk, set the Search Job Limit to twice the total number of Splunk queries configured in the Splunk Cloud Collectors. For example, if you have three collectors configured—Windows, Linux, and Firewall—the recommended Search Job Limit should be six.
Example 2 – Error Message about Search Disk Cache Limit
Error – The following error indicates current disk usage is over the 500MB limit.
HTTP 503 --
{"messages":[{"type":"ERROR","text":"reason=\"Search
not executed: The maximum disk usage quota for this user has been
reached. Use the Job Manager to delete some of your saved search
results.\", usage=686MB, quota=500MB, user=exabeam,
concurrency_category=\"historical\",
concurrency_context=\"user_instance-wide\"","help":""}]}
Resolution – In Splunk, it is best practice to increase the disk usage limit. Search results are stored for 10 minutes. Ensure that you have enough storage for all query results including possible spike in data.
